First Marriage Rate, 2021
Family Profile No. 17, 2023
Author: Krista K. Westrick-Payne
In 2021, the overall U.S. marriage rate remained low at 28.1 marriages per 1,000 unmarried women–the lowest since 1970 (Juteau, 2022). However, the overall marriage rate includes both first marriages and remarriages. It is important to examine the first marriage rate separately, because first marriages are less likely to end in divorce than remarriages (Cohen, 2016). Additionally, the traditional estimation of marriage and divorce rates has been restricted to marriages and divorces among the female population, but recognizing possible sex differences this profile provides separate estimates for both males and females using U.S Census data from the American Community Survey provided by IPUMS-USA. More specifically, we examine the first marriage rate (defined as the number of marriages per 1,000 never married individuals) among males and females aged 18 years and older. This Family Profile is an update to previous profiles on the first marriage rate (FP-21-09, FP-20-01, FP-18-14, FP-16-18, FP-14-08, FP-11-12, and FP-10-05).
Trends in the First Marriage Rate for Males and Females
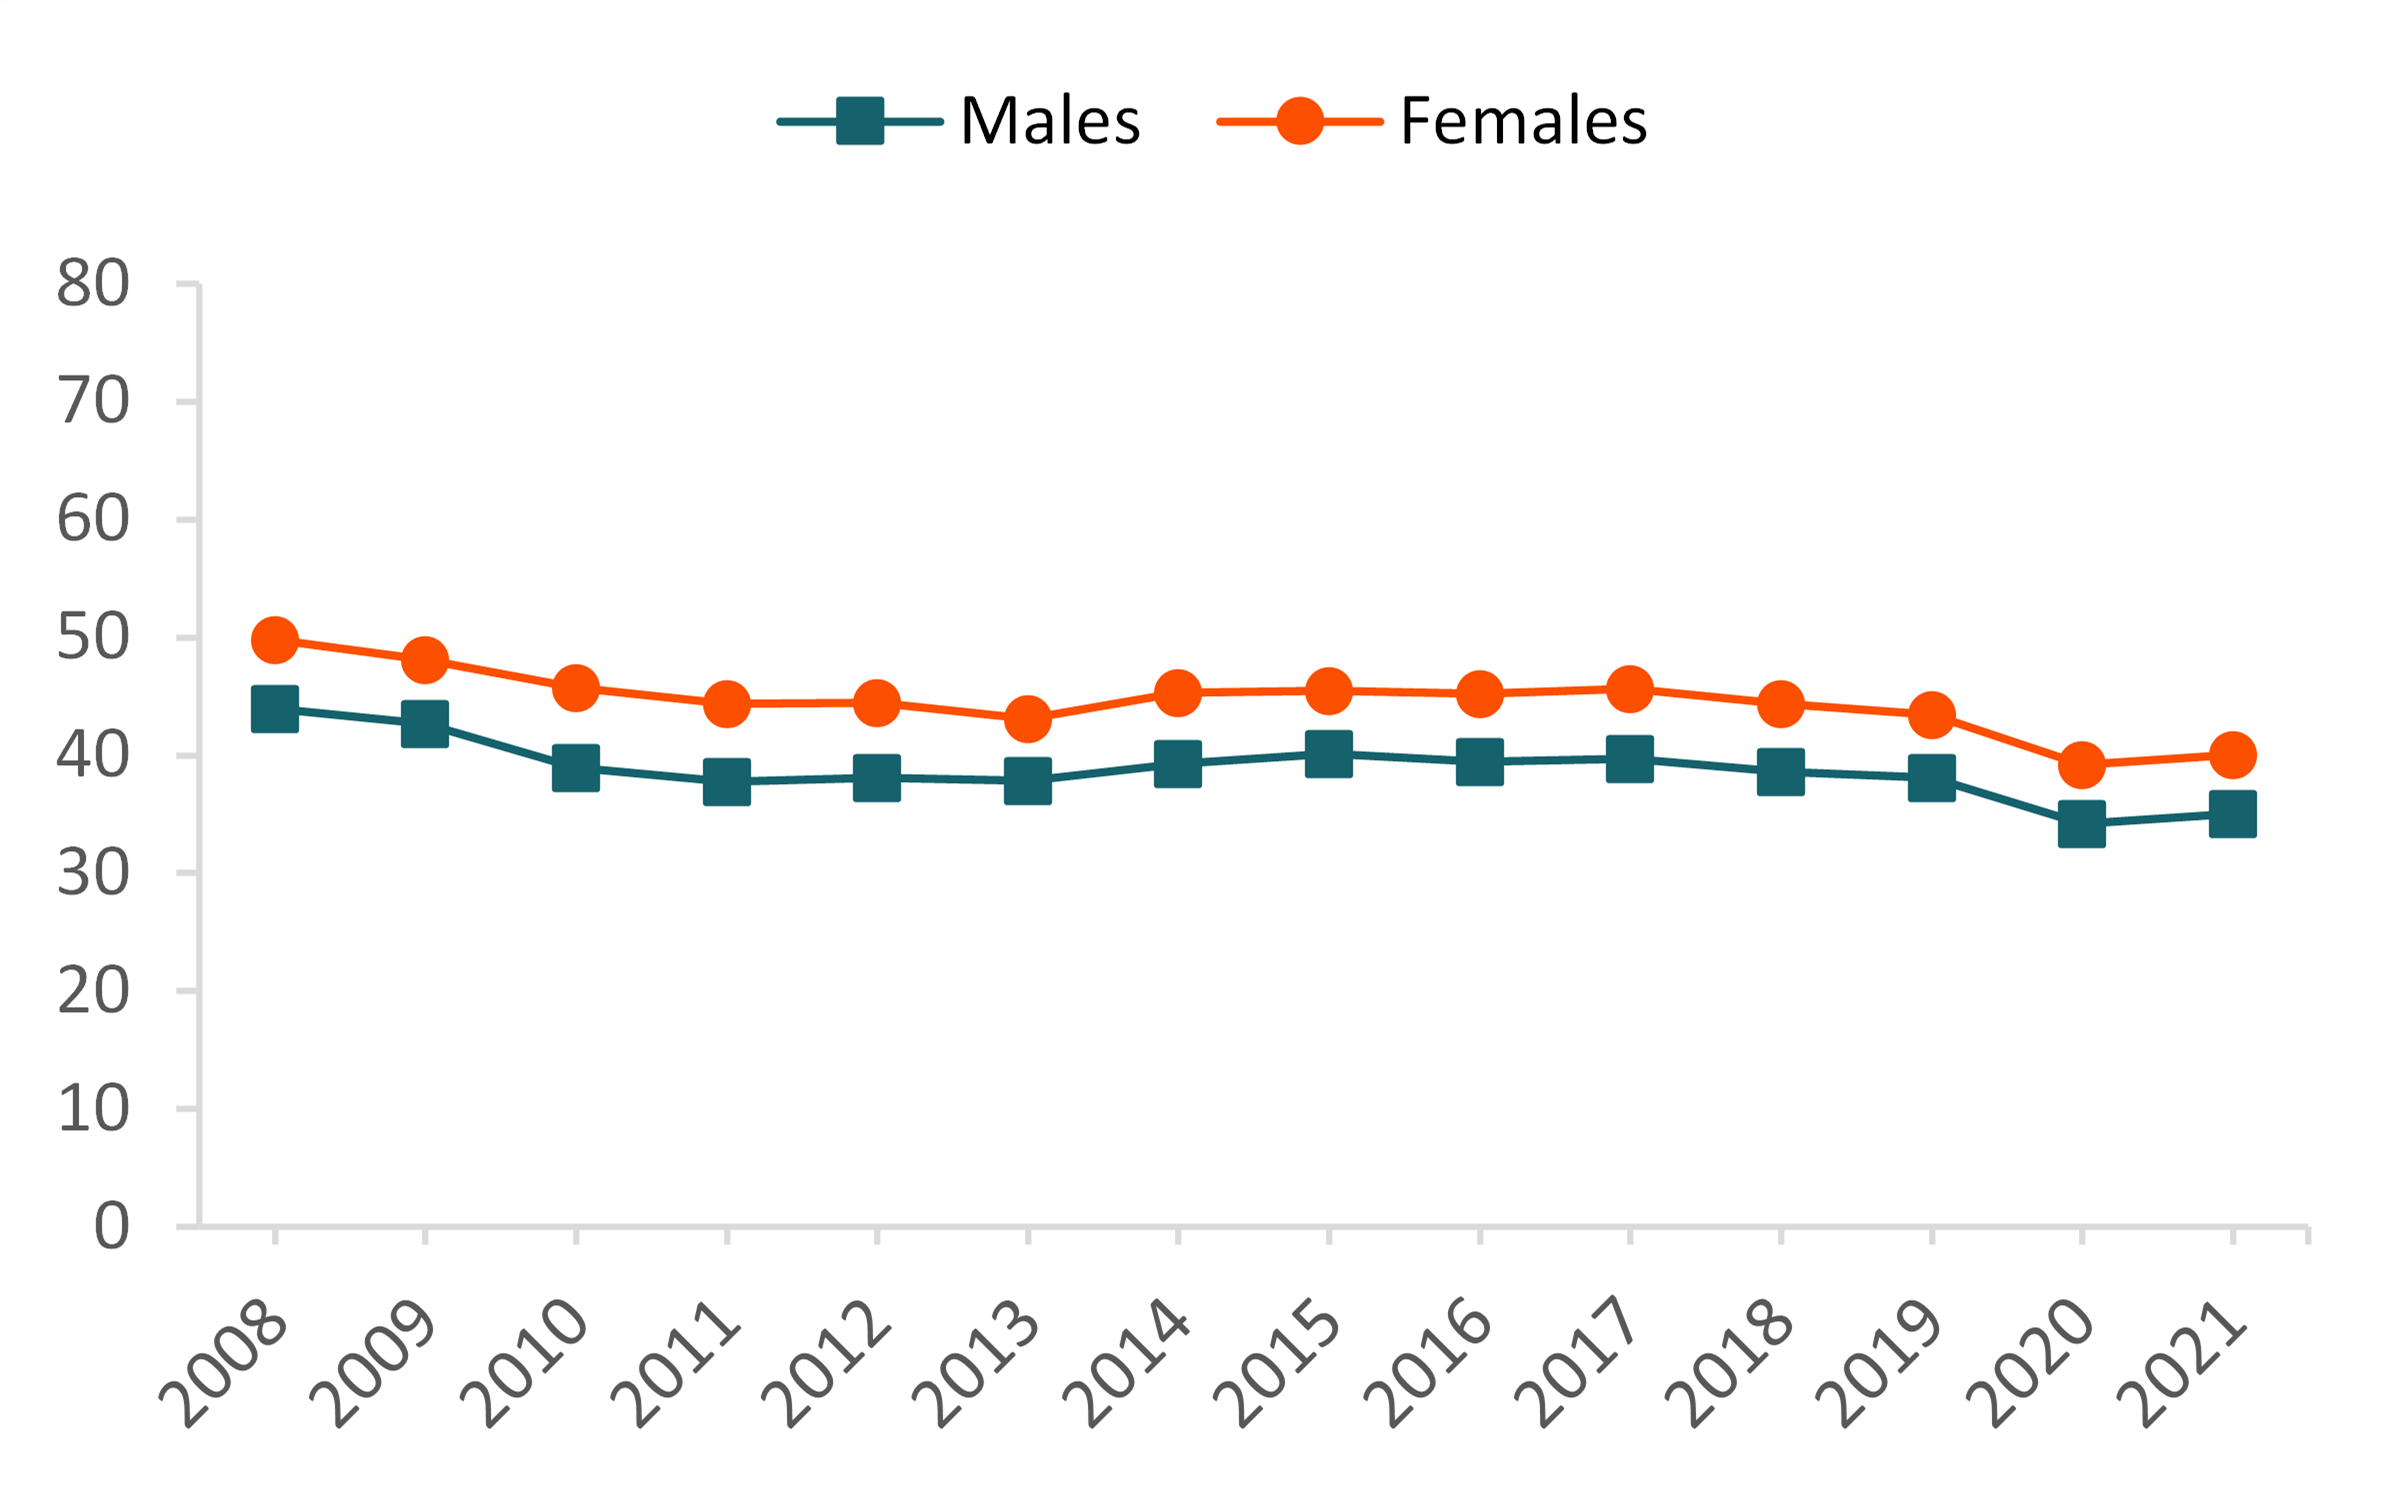
- The first marriage rate has decreased overall since 2008 from 43.9 marriages per 1,000 never married males to 35.1 marriages per 1,000 never married males in 2021. Among females, it decreased from 49.8 in 2008 to 40.0 in 2021.
- An estimated 1.56 million males and 1.54 million females experienced a first marriage in 2021.
Figure 1. First Marriage Rate for Males and Females, 2008–2021
First Marriage Rate by Age for Males and Females
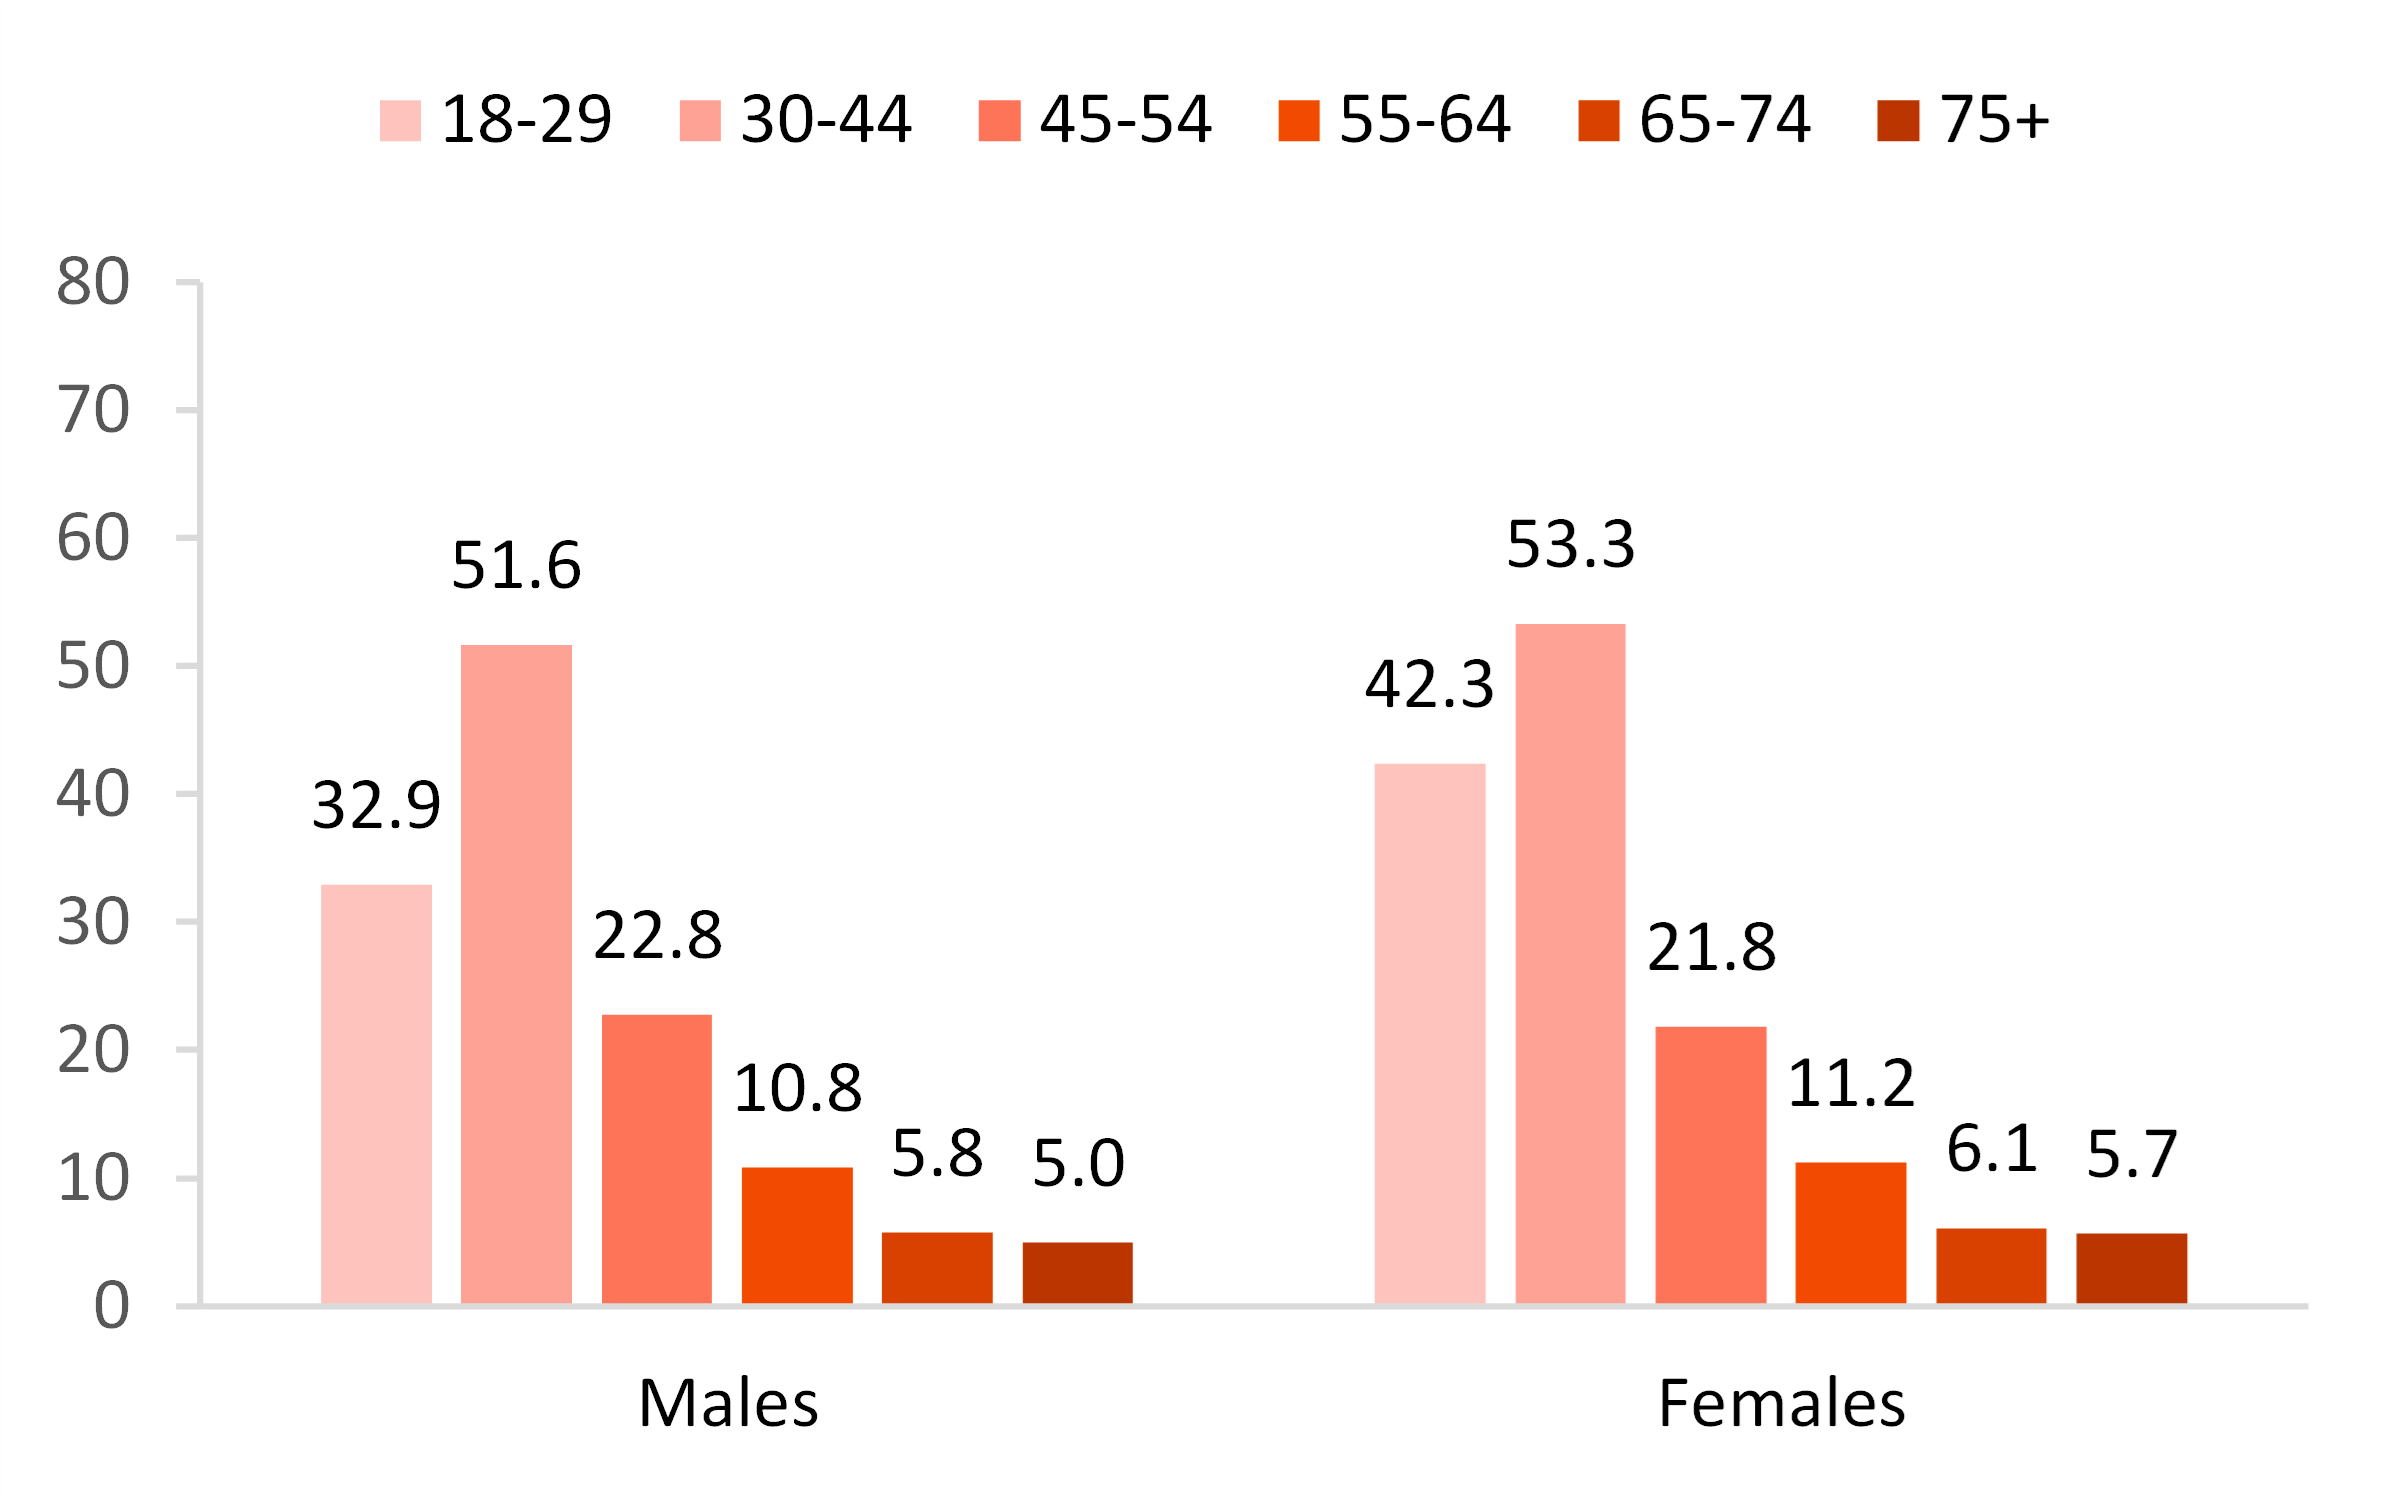
- The highest first marriage rates were among those aged 30 to 44 with 51.6 per 1,000 never married males and 53.3 per 1,000 never married females experiencing a first marriage in 2021.
- The lowest first marriage rates were observed among those aged 75 and older (5.0 males and 5.7 females per 1,000 married). An estimated 2,152 males and 3,597 females aged 75 and older in the United States experienced a first marriage in 2021.
Figure 2. First Marriage Rate for Males and Females 18 and Older by Age, 2021
First Marriage Rate by Race, Ethnicity, and Nativity for Males and Females
- In 2021, Asian males and females experienced the highest first marriage rates (41.7 and 50.7, respectively).
- Black males and females had the lowest first marriage rates (21.1 and 18.8, respectively).
- While most females had higher first marriage rates than their same race/ethnic male counterparts, this was not the case among Blacks for whom the first marriage rate of males exceeded that of females.
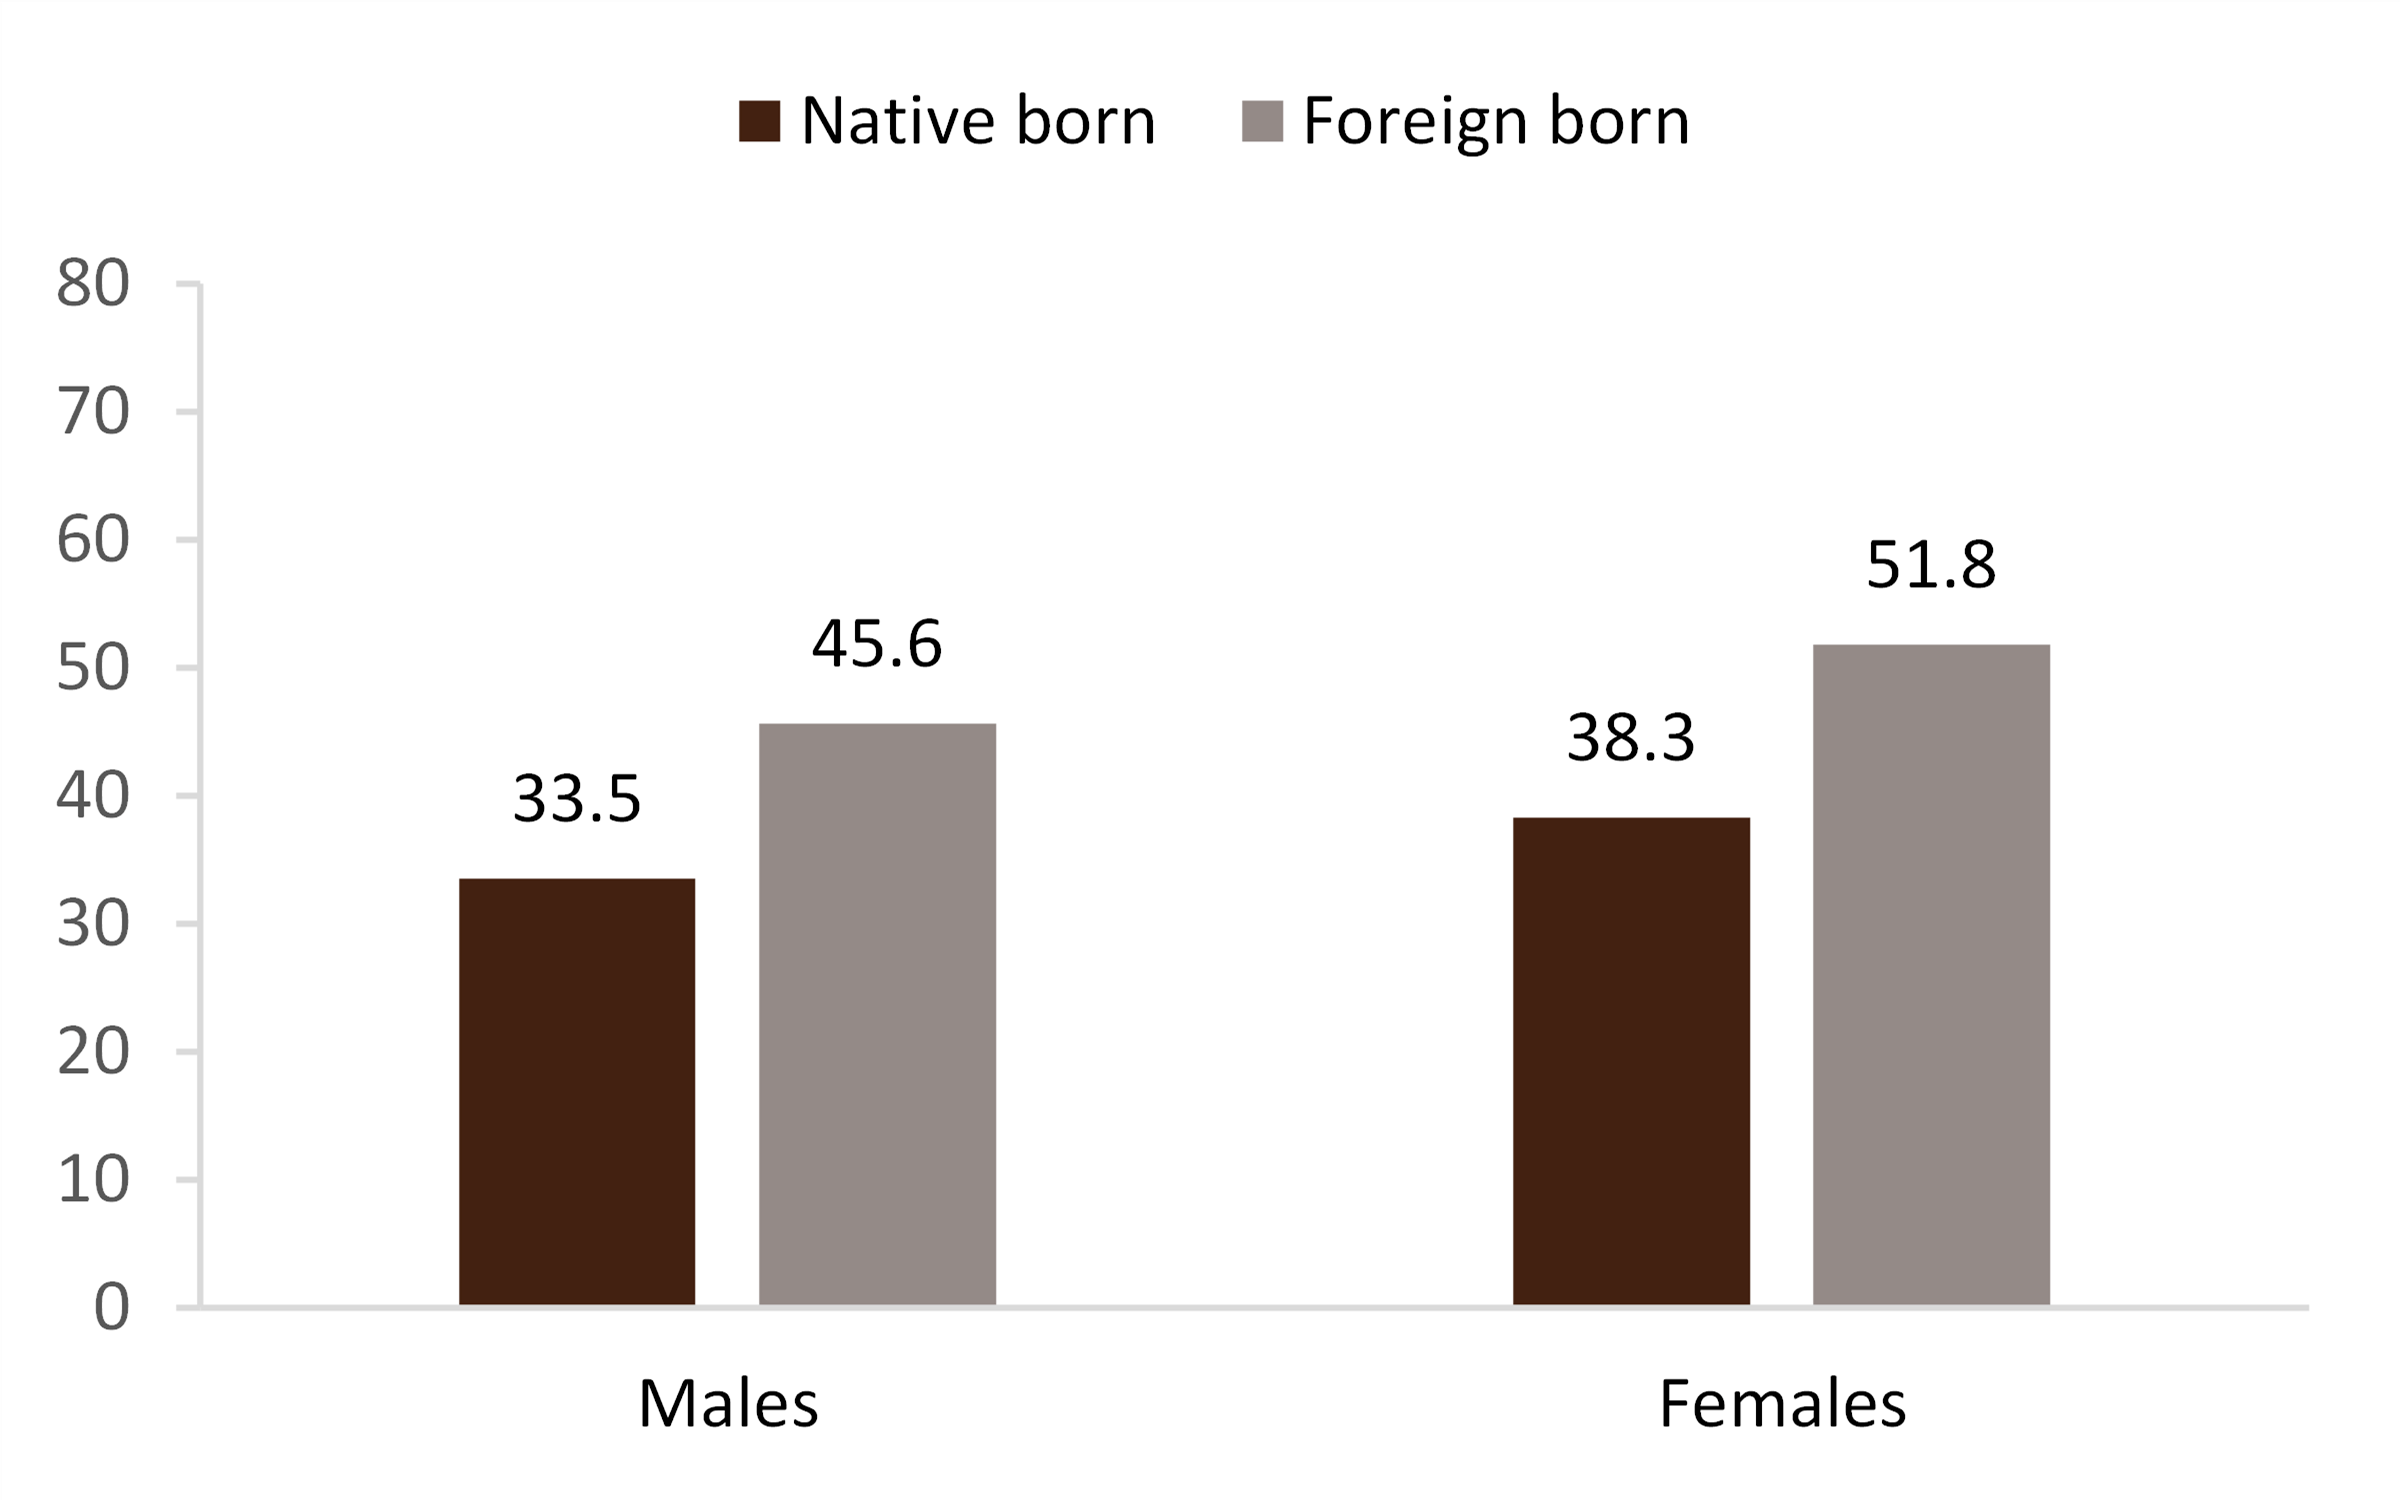
- Foreign-born males and females had higher first marriage rates than their native-born counterparts (see Figure 4). This was the case for each racial/ethnic group examined, except among “Other” males for whom the first marriage rate of foreign-born males was lower than native-born “Other” males (21.5 versus 31.6, not shown).
Figure 3. First Marriage Rate for Males and Females 18 and Older by Race and Ethnicity, 2021
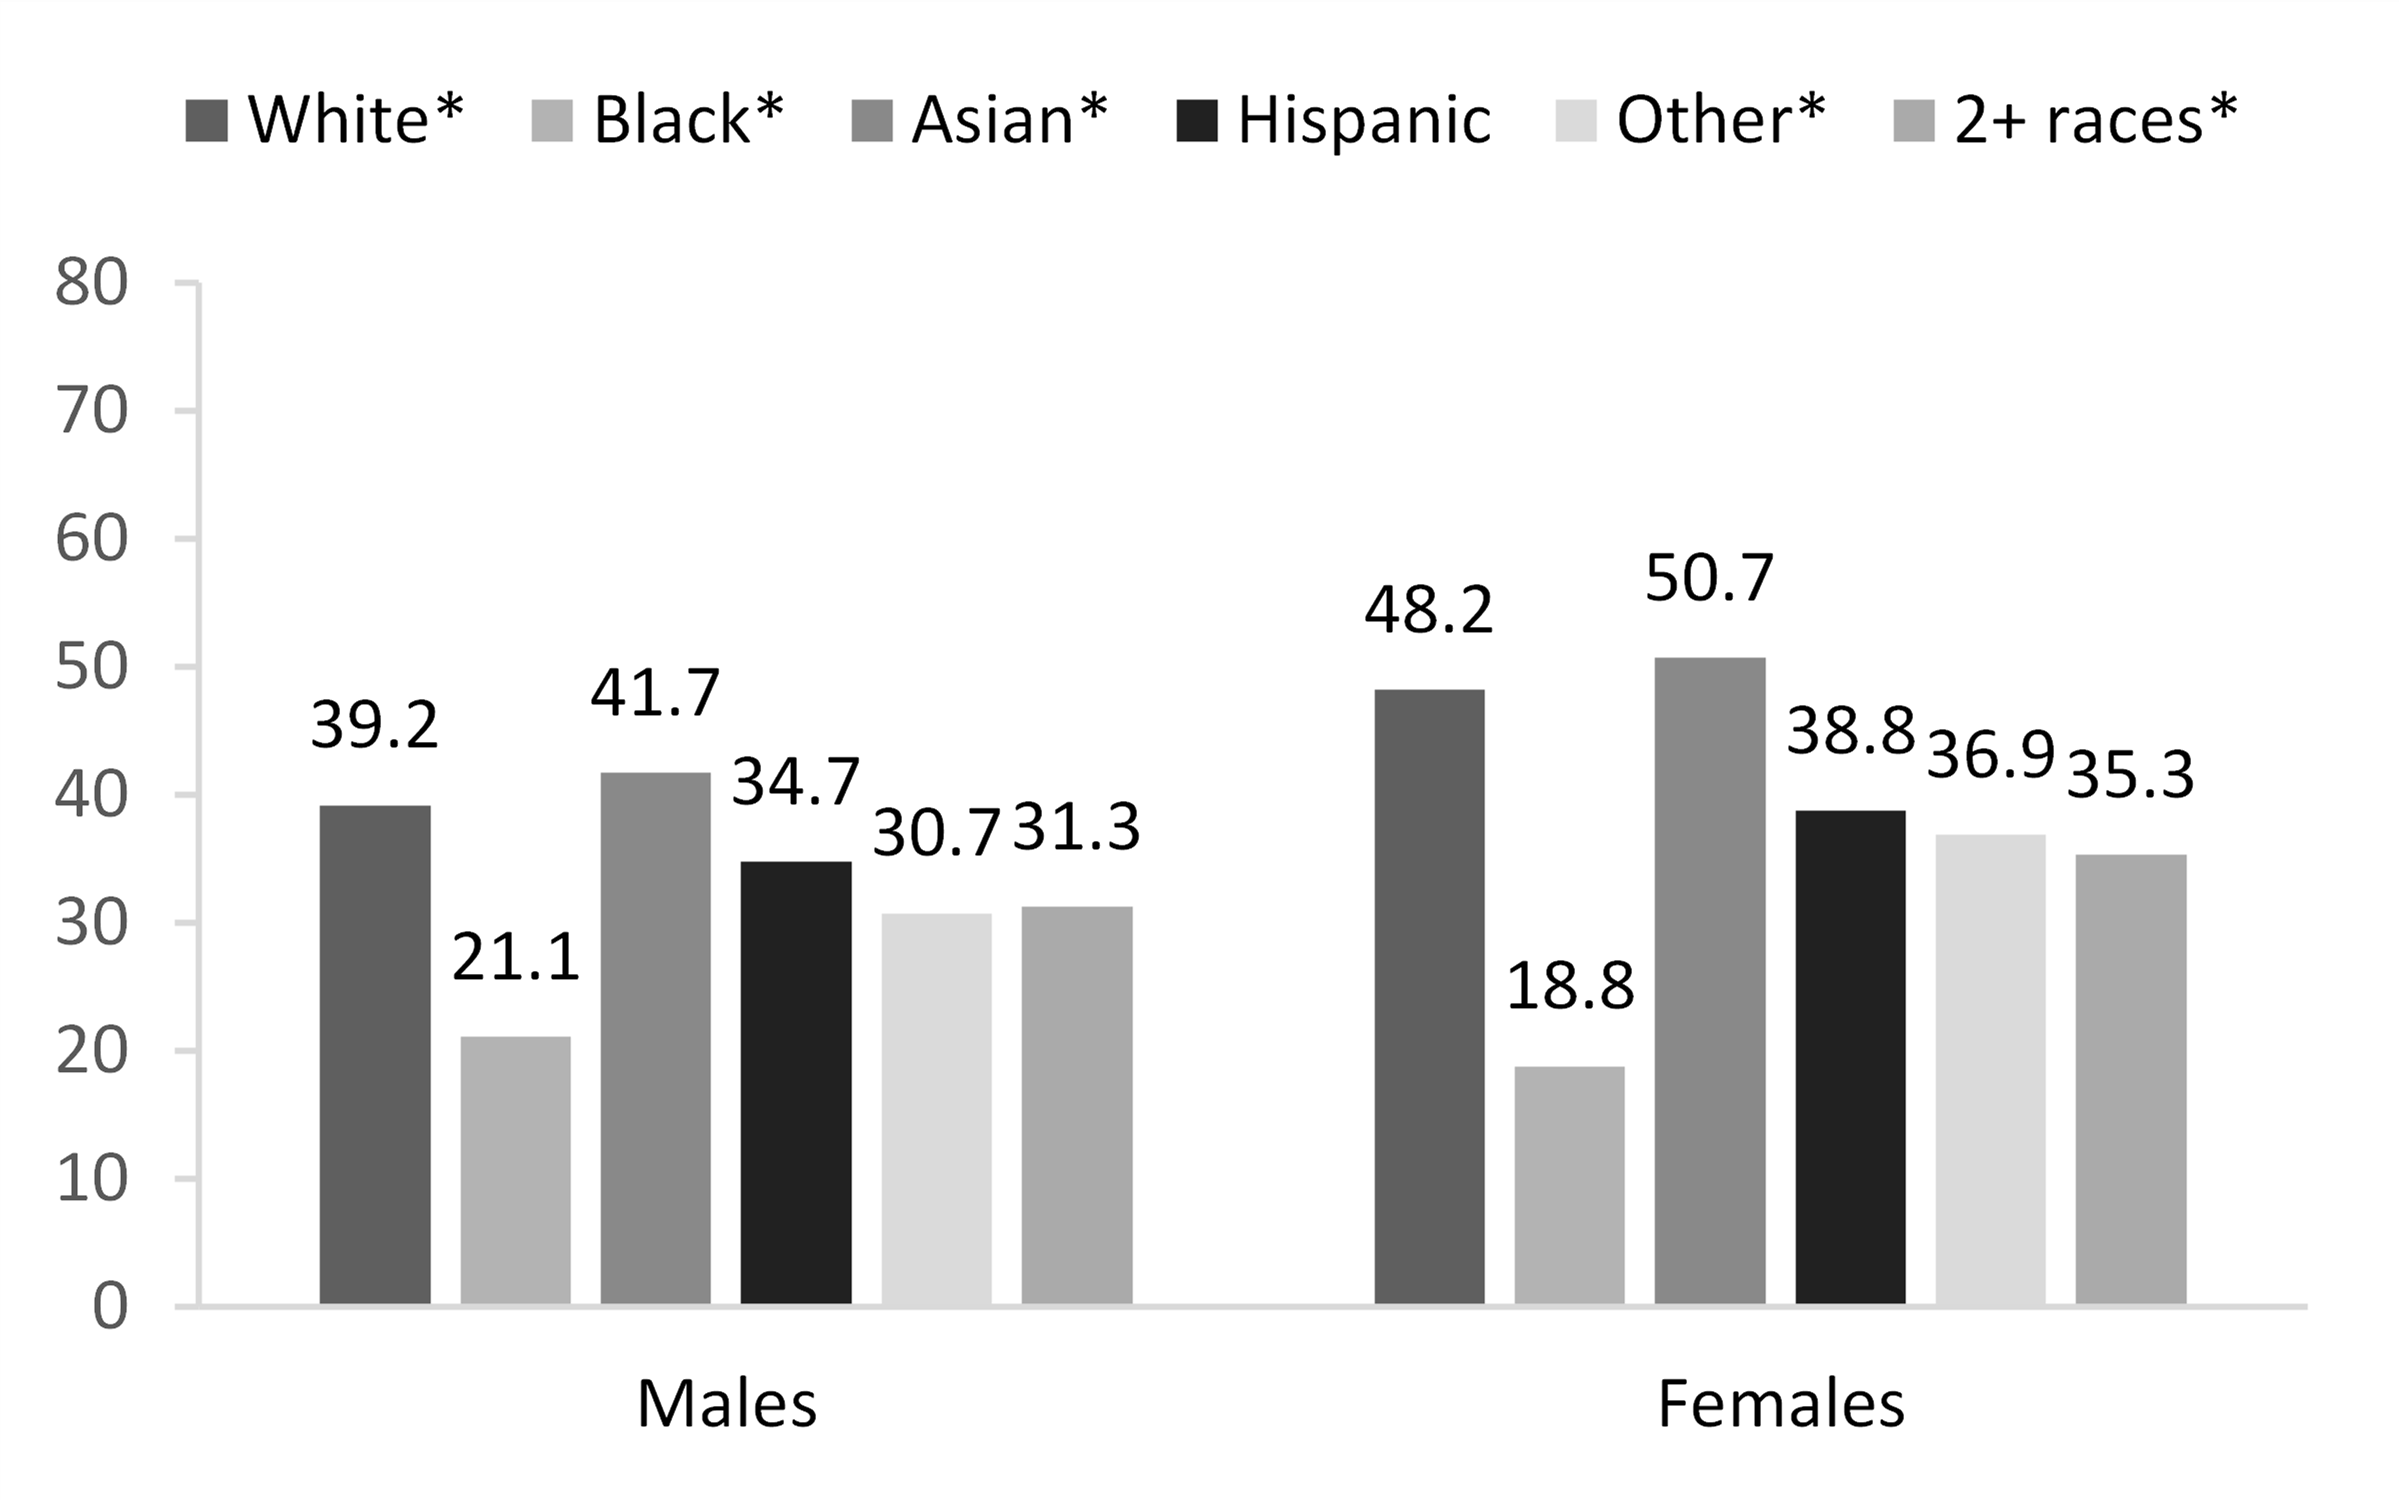
Figure 4. First Marriage Rate for Males and Females 18 and Older by Nativity, 2021
First Marriage Rate by Educational Attainment for Males and Females
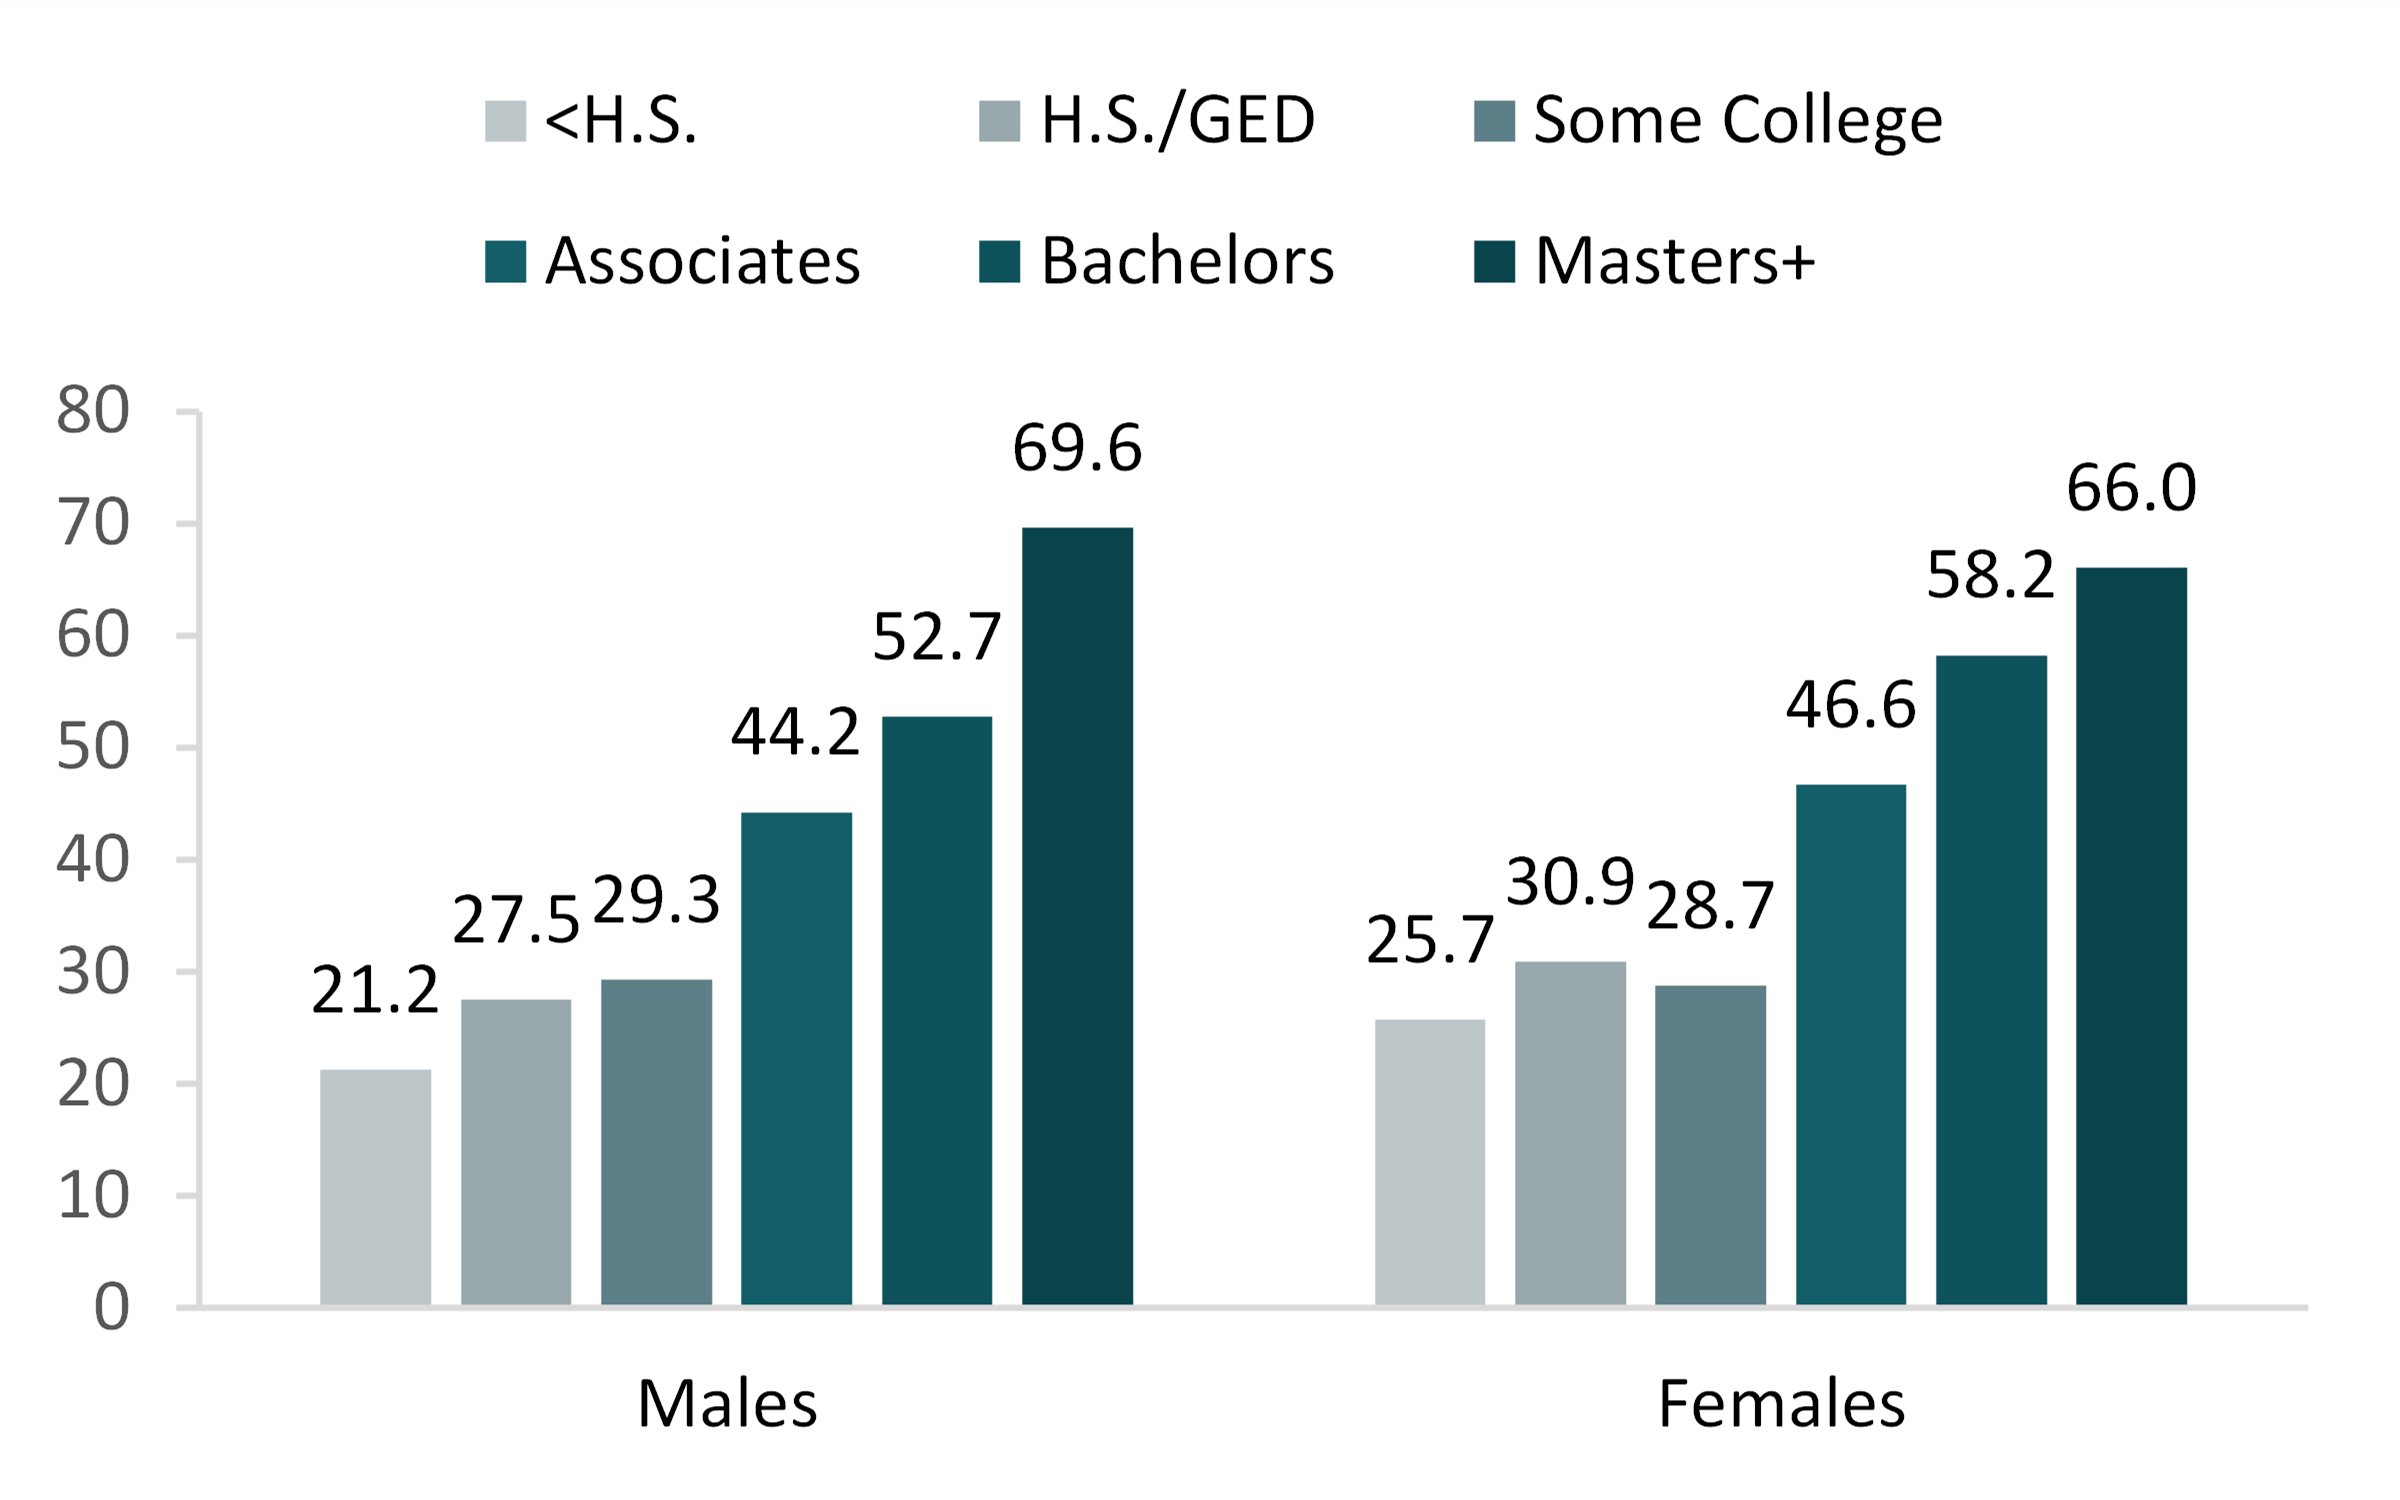
- Patterns of first marriage by educational attainment were very similar among males and females in 2021.
- The lowest first marriage rates were among those with the lowest educational attainment regardless of sex; 21.2 per 1,000 never married males with less than a H.S. level of education and 25.7 per 1,000 never married females with less than a H.S. level of education married for the first time in 2021.
- The highest first marriage rate among both males and females was among those with at least a master’s degree. Among males 69.6 per 1,000 never married males and 66.0 per 1,000 females experienced a first marriage in 2021.
Figure 5. First Marriage Rate for Males and Females 18 and Older by Educational Attainment, 2021
Data Source:
Ruggles, S., Flood, S., Sobek, M., Brockman D., Cooper, G., Richards, S., Schouweiler, M. (2023). IPUMS USA: Version 13.0 [dataset]. Minneapolis, MN: IPUMS. https://doi.org/10.18128/D010.V12.0
References:
Allred, C. (2019). Marriage rate in the U.S.: Geographic variation, 2018. Family Profiles, FP-19-22. Bowling Green, OH: National Center for Family & Marriage Research. https://doi.org/10.25035/ncfmr/fp-19-22
Anderson, L. R. (2016). First marriage rate in the U.S., 2014. Family Profiles, FP-16-18. Bowling Green, OH: National Center for Family & Marriage Research. https://www.bgsu.edu/ncfmr/resources/data/family-profiles/anderson-first-marriage-rate-2014-fp-16-18.html
Cohen, P. N. (2016). Multiple-decrement life tables from 2010-2012 American Community Survey data marital events. Retrieved from https://familyinequality.wordpress.com/2016/06/08/life-table-says-divorce-rate-is-52-7/
Juteau, G. (2022). Marriage rate in the U.S.: Geographic variation, 2021. Family Profiles, FP-22-25. Bowling Green, OH: National Center for Family & Marriage Research. https://doi.org/10.25035/ncfmr/fp-22-25
Manning, W. D. & Payne, K. K. (2019). Marriage by the numbers. Family Profiles, FP-19-14. Bowling Green, OH: National Center for Family & Marriage Research. https://doi.org/10.25035/ncfmr/fp-19-14
Payne, K. K. (2018). First marriage rate in the U.S., 2016. Family Profiles, FP-18-14. Bowling Green, OH: National Center for Family & Marriage Research. https://doi.org/10.25035/ncfmr/fp-18-14
Payne, K. K. & Gibbs, L. (2011). First marriage rate in the U.S., 2010. Family Profiles, FP-11-12. Bowling Green, OH: National Center for Family & Marriage Research. http://www.bgsu.edu/content/dam/BGSU/college-of-arts-and-sciences/NCFMR/documents/FP/FP-11-12.pdf
Payne, K. K. (2010). Rate of first marriage in the U.S., 2008. Family Profiles, FP-10-05. Bowling Green, OH: National Center for Family & Marriage Research. http://www.bgsu.edu/content/dam/BGSU/college-of-arts-and-sciences/NCFMR/documents/FP/Fp-10-05.pdf
Reynolds, L. (2020). Marriage rate in the U.S.: Geographic variation, 2019. Family Profiles, FP-20-24. Bowling Green, OH: National Center for Family & Marriage Research. https://doi.org/10.25035/ncfmr/fp-20-24
Schweizer, V. (2020). First marriage rate in the U.S., 2018. Family Profiles, FP-20-01. Bowling Green, OH: National Center for Family & Marriage Research. https://doi.org/10.25035/ncfmr/fp-20-01
Reynolds, L. (2021). First marriage rate in the U.S., 2019. Family Profiles, FP-21-09. Bowling Green, OH: National Center for Family & Marriage Research. https://doi.org/10.25035/ncfmr/fp-21-09
Stykes, B., Payne, K. K., & Gibbs, L. (2014). First marriage rate in the U.S., 2012. Family Profiles, FP-14-08. Bowling Green, OH: National Center for Family & Marriage Research. http://www.bgsu.edu/content/dam/BGSU/college-of-arts-and-sciences/NCFMR/documents/FP/FP-14-08-marriage-rate2012.pdf
Suggested Citation:
Westrick-Payne, K. K. (2023). First marriage rate, 2021. Family Profiles, FP-23-17. National Center for Family & Marriage Research. https://doi.org/10.25035/ncfmr/fp-23-17
Updated: 11/12/2025 09:57AM

