Change in the U.S. Remarriage Rate, 2008 and 2016
Family Profile No. 16, 2018
Author: Krista K. Payne
Nearly half of all marriages in the U.S. end in divorce (Amato, 2010; Cherlin, 2010). Although most divorced individuals repartner, data from the 1980s and 1990s indicate remarriage rates had been declining (Sweeney, 2010). More recent estimates had not been available until the release of the 2008 American Community Survey (ACS). Using the 2008 and the most recent ACS in 2016, we examine whether remarriage rates (defined as the number of marriages per 1,000 eligible individuals, see Note below) have continued to decline into the 21st century. Further, we differentiate between men and women and examine variation in change by educational attainment, race/ethnicity, and nativity. This profile is an update to previous profiles on the U.S. remarriage rate (FP-15-08, FP-14-10, FP-12-14). Marriage to Divorce Ratio in the U.S., 2017.
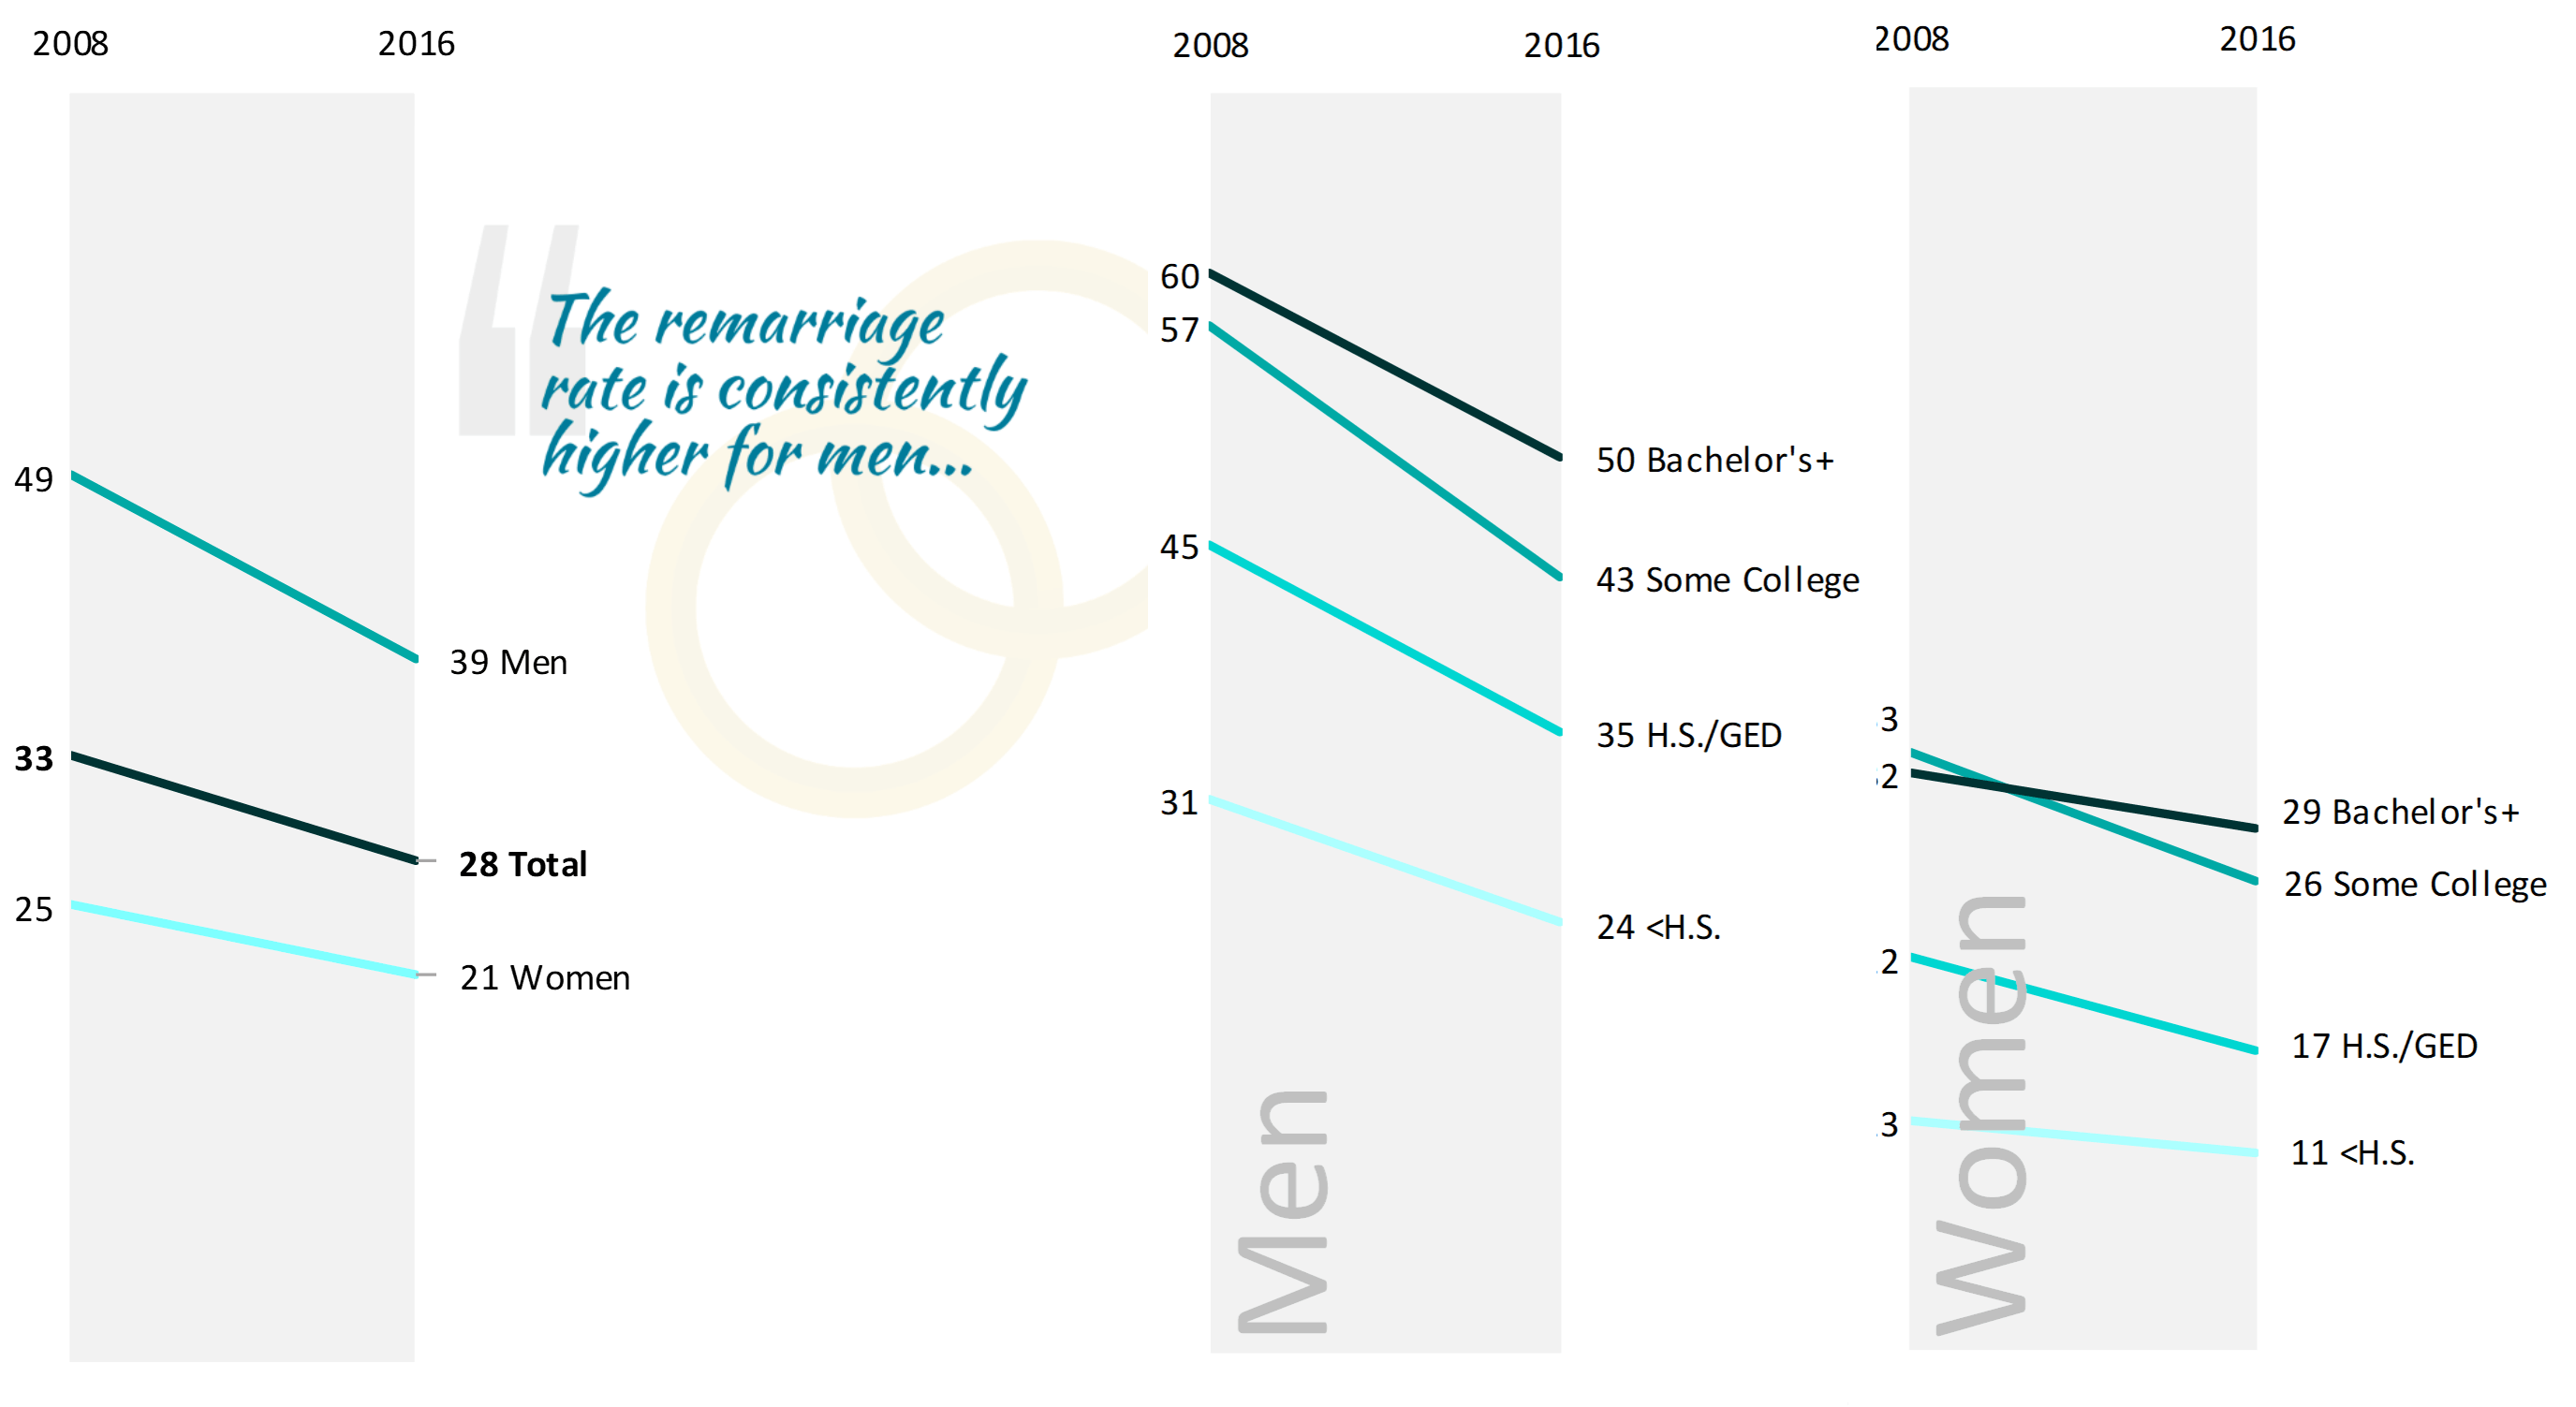
Change in the Remarriage Rate by Gender and Education
- An educational gradient in the remarriage rate continues such that remarriage is most common among those with at least some college education. This pattern holds true for both men and women.
- The rate of remarriage decreased among all educational attainment groups, but those with some college education experienced the greatest decline since 2008.
- The remarriage rate per 1,000 men with some college declined by 14 compared to a decline by 7 among women with some college.
Change in the Remarriage Rate by Gender
- Among all marriages in 2016, 27% were remarriages, down from 31% in 2008 (not shown).
- In 2016, there were 28 remarriages per 1,000 men and women aged 18 and older who were eligible for a remarriage, down from 33 remarriages in 2008 (a trend which mirrored overall marriage rates, FP-17-25).
- The remarriage rate is consistently higher for men than for women at 39 per 1,000 vs. 21 per 1,000 in 2016.
- The decline in remarriage from 2008 to 2016 was greater for men than women. The remarriage rate per 1,000 men declined by 10 compared to a decline by 4 among women.
Change in the Remarriage Rate by Gender and Education
- An educational gradient in the remarriage rate continues such that remarriage is most common among those with at least some college education. This pattern holds true for both men and women.
- The rate of remarriage decreased among all educational attainment groups, but those with some college education experienced the greatest decline since 2008.
- The remarriage rate per 1,000 men with some college declined by 14 compared to a decline by 7 among women with some college.
Figure 1. Remarriage Rate by Gender, 2008 & 2016
Figure 2. Remarriage Rate by Gender and Education, 2008 & 2016

Source: NCFMR analyses of U.S. Census Bureau, American Community Survey, 1-yr. est., 2008 & 2016
Note: This profile estimates remarriage rates based on adults (18 and older) at risk of remarriage in the past 12 months. Men and women at risk are divorced or widowed.
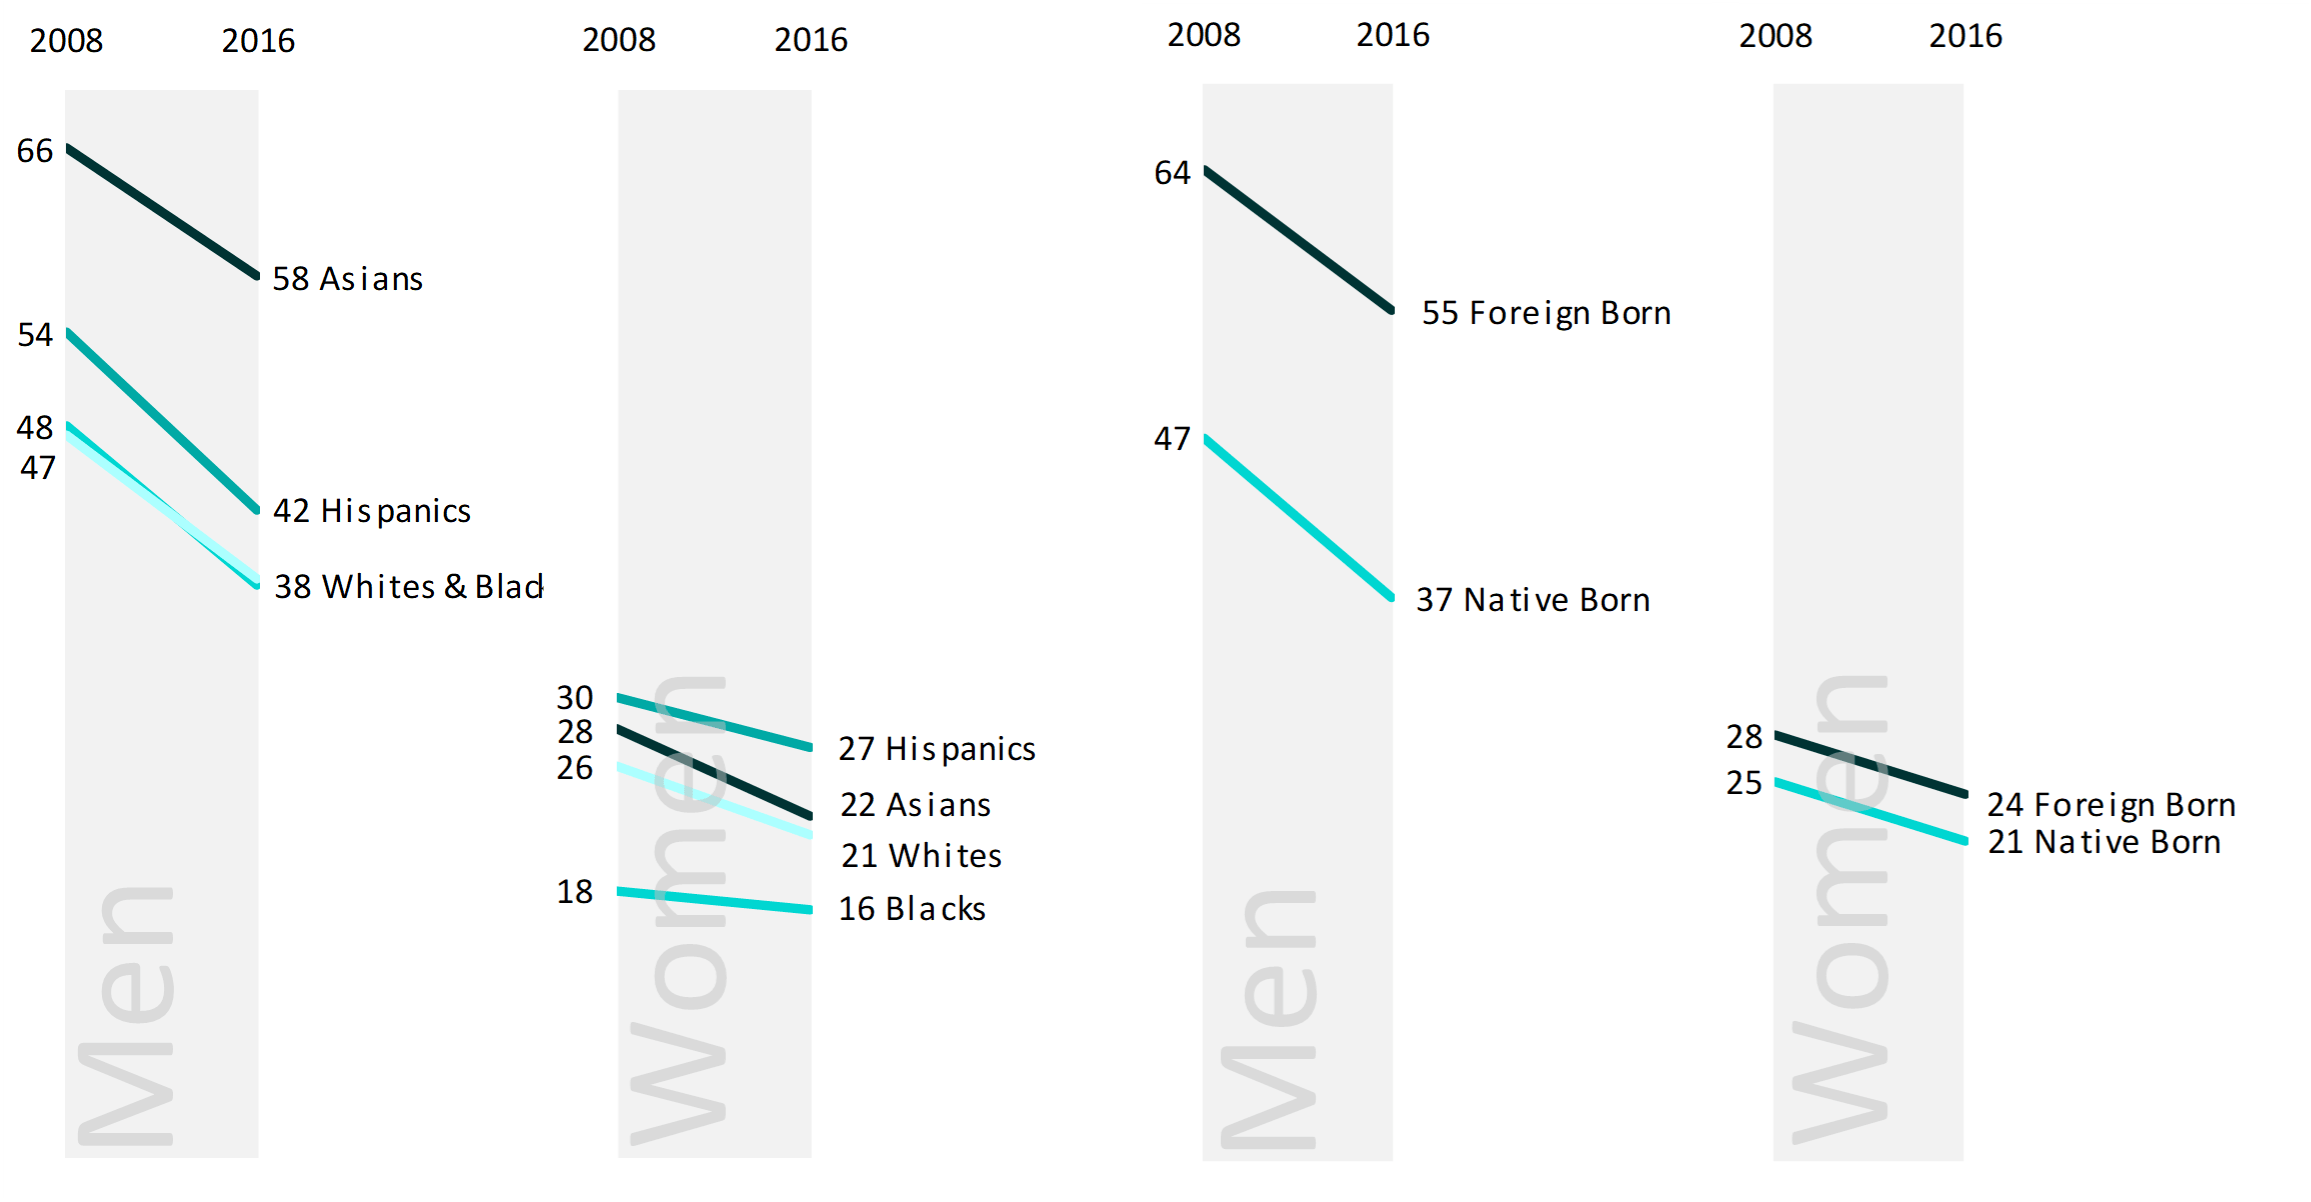
Change in the Remarriage Rate by Gender and Race/Ethnicity
- Remarriage rates among men and women have changed in different ways according to race/ethnicity.
- Between 2008 and 2016, Asian men had the highest rate of remarriage, whereas Black and White men tied with the lowest.
- Among men, the decline since 2008 was greatest for Hispanics–dropping by 12.
- Unlike their male counterparts, Hispanic women had the highest rate of remarriage (27 per 1,000), and Black women had the lowest (16 per 1,000).
- Since 2008, Asian women experienced the greatest absolute decline (remarriage rate of 28 versus 22).
Figure 3. Remarriage Rate by Gender and Race/Ethnicity, 2008 & 2016
Change in the Remarriage Rate by Gender and Nativity
- The remarriage rate is higher for foreign-born versus native-born men and women both in 2008 and 2016.
- Native-born and foreign-born men experienced similar drops in their respective remarriage rates. In 2016, men who were foreign-born had a remarriage rate of 55per1,000versus37amongnative-bornmen.
- The difference in the remarriage rate between those who are foreign-born and native-born was smaller among women than men. In 2016, the remarriage rate for foreign-born women was 24 versus 21 among native-born women.
Figure 4. Remarriage Rate by Gender and Nativity, 2008 & 2016

Source: NCFMR analyses of U.S. Census Bureau, American Community Survey, 1-yr. est., 2008 & 2016
References
- Amato, P . R. (2010). Research on divorce: Continuing trends and new developments. Journal of Marriage and Family, 72(3), 650-666. DOI: 10.1111/j.1741-3737.2010.00723.x
- Cherlin, A. (2010). Demographic trends in the United States: A review of research in the 2000s. Journal of Marriage and Family, 72(3), 403-419. DOI: 10.1111/j.1741-3737.2010.00710.x
- Cruz, J. (2012). Remarriage rate in the U.S., 2010. Family Profiles, FP-12-14. Bowling Green, OH: National Center for Family & Marriage Research. https://www.bgsu.edu/content/dam/BGSU/college-of-arts-and-sciences/NCFMR/documents/FP/FP-12-14.pdf
- Lamidi, E. & Cruz, J. (2014). Remarriage rate in the U.S., 2012. Family Profiles, FP-14-10. Bowling Green, OH: National Center for Family & Marriage Research. https://www.bgsu.edu/content/dam/BGSU/college-of-arts-and-sciences/NCFMR/documents/FP/FP-14-10-remarriage-rate-2012.pdf
- Payne, K. K. (2015). Remarriage rate: Geographic variation, 2013. Family Profiles, FP-15-08. Bowling Green, OH: National Center for Family & Marriage Research. https://www.bgsu.edu/ncfmr/resources/data/family-profiles/payne-remarriage-rate-fp-15-08.html
- Sweeney, M. (2010). Remarriage and stepfamilies: Strategic sites for family scholarship in the 21st century. Journal of Marriage & Family 72(3), 667-684. DOI: 10.1111/j.1741-3737.2010.00724.x
Suggested Citation
- Payne, K. K. (2018). Change in the U.S. remarriage rate, 2008 & 2016. Family Profiles, FP-18-16. Bowling Green, OH: National Center for Family & Marriage Research. https://doi.org/10.25035/ncfmr/fp-18-16


This project is supported with assistance from Bowling Green State University. From 2007 to 2013, support was also provided by the U.S. Department of Health and Human Services, Office of the Assistant Secretary for Planning and Evaluation. The opinions and conclusions expressed herein are solely those of the author(s) and should not be construed as representing the opinions or policy of any agency of the state or federal government.
Updated: 04/06/2021 02:09PM

