Age Variation in Unmarried Adults, 1900-2020
Family Profile No. 08, 2023
Author: Francesca A. Marino
Since 1900, the share of unmarried adults aged 18 and older in the U.S. has increased such that by 2020 they represented nearly half the adult population (Marino, 2023). As the U.S. marriage rate has decreased over the past few decades (Schweizer, 2020) and high levels of divorce persist (Reynolds, 2021), the share of adults who experience singlehood, particularly at later ages, has become more prevalent. Additionally, the median age at first marriage has increased for both women and men since the mid-1900s (Payne, 2021), underscoring the utility of examining changing patterns of age variation among unmarried adults. In this family profile, we use data from the 1900 to 1990 U.S. Decennial Censuses and the American Community Survey 1-year estimates from 2000, 2010, and 2020 to examine the age distribution of unmarried adults in the U.S. over a century. We also describe the median ages of all unmarried men and women and unpack the heterogeneity among unmarried adults by examining the median ages of divorced/separated, widowed, and never married adults. It is important to note that some of these changes are simply a function of increased life expectancy, which rose from 47.3 in 1900 to 77.0 in 2020 (Arias & Xu, 2022).
Age Distribution of Unmarried Adults from 1900 to 2020
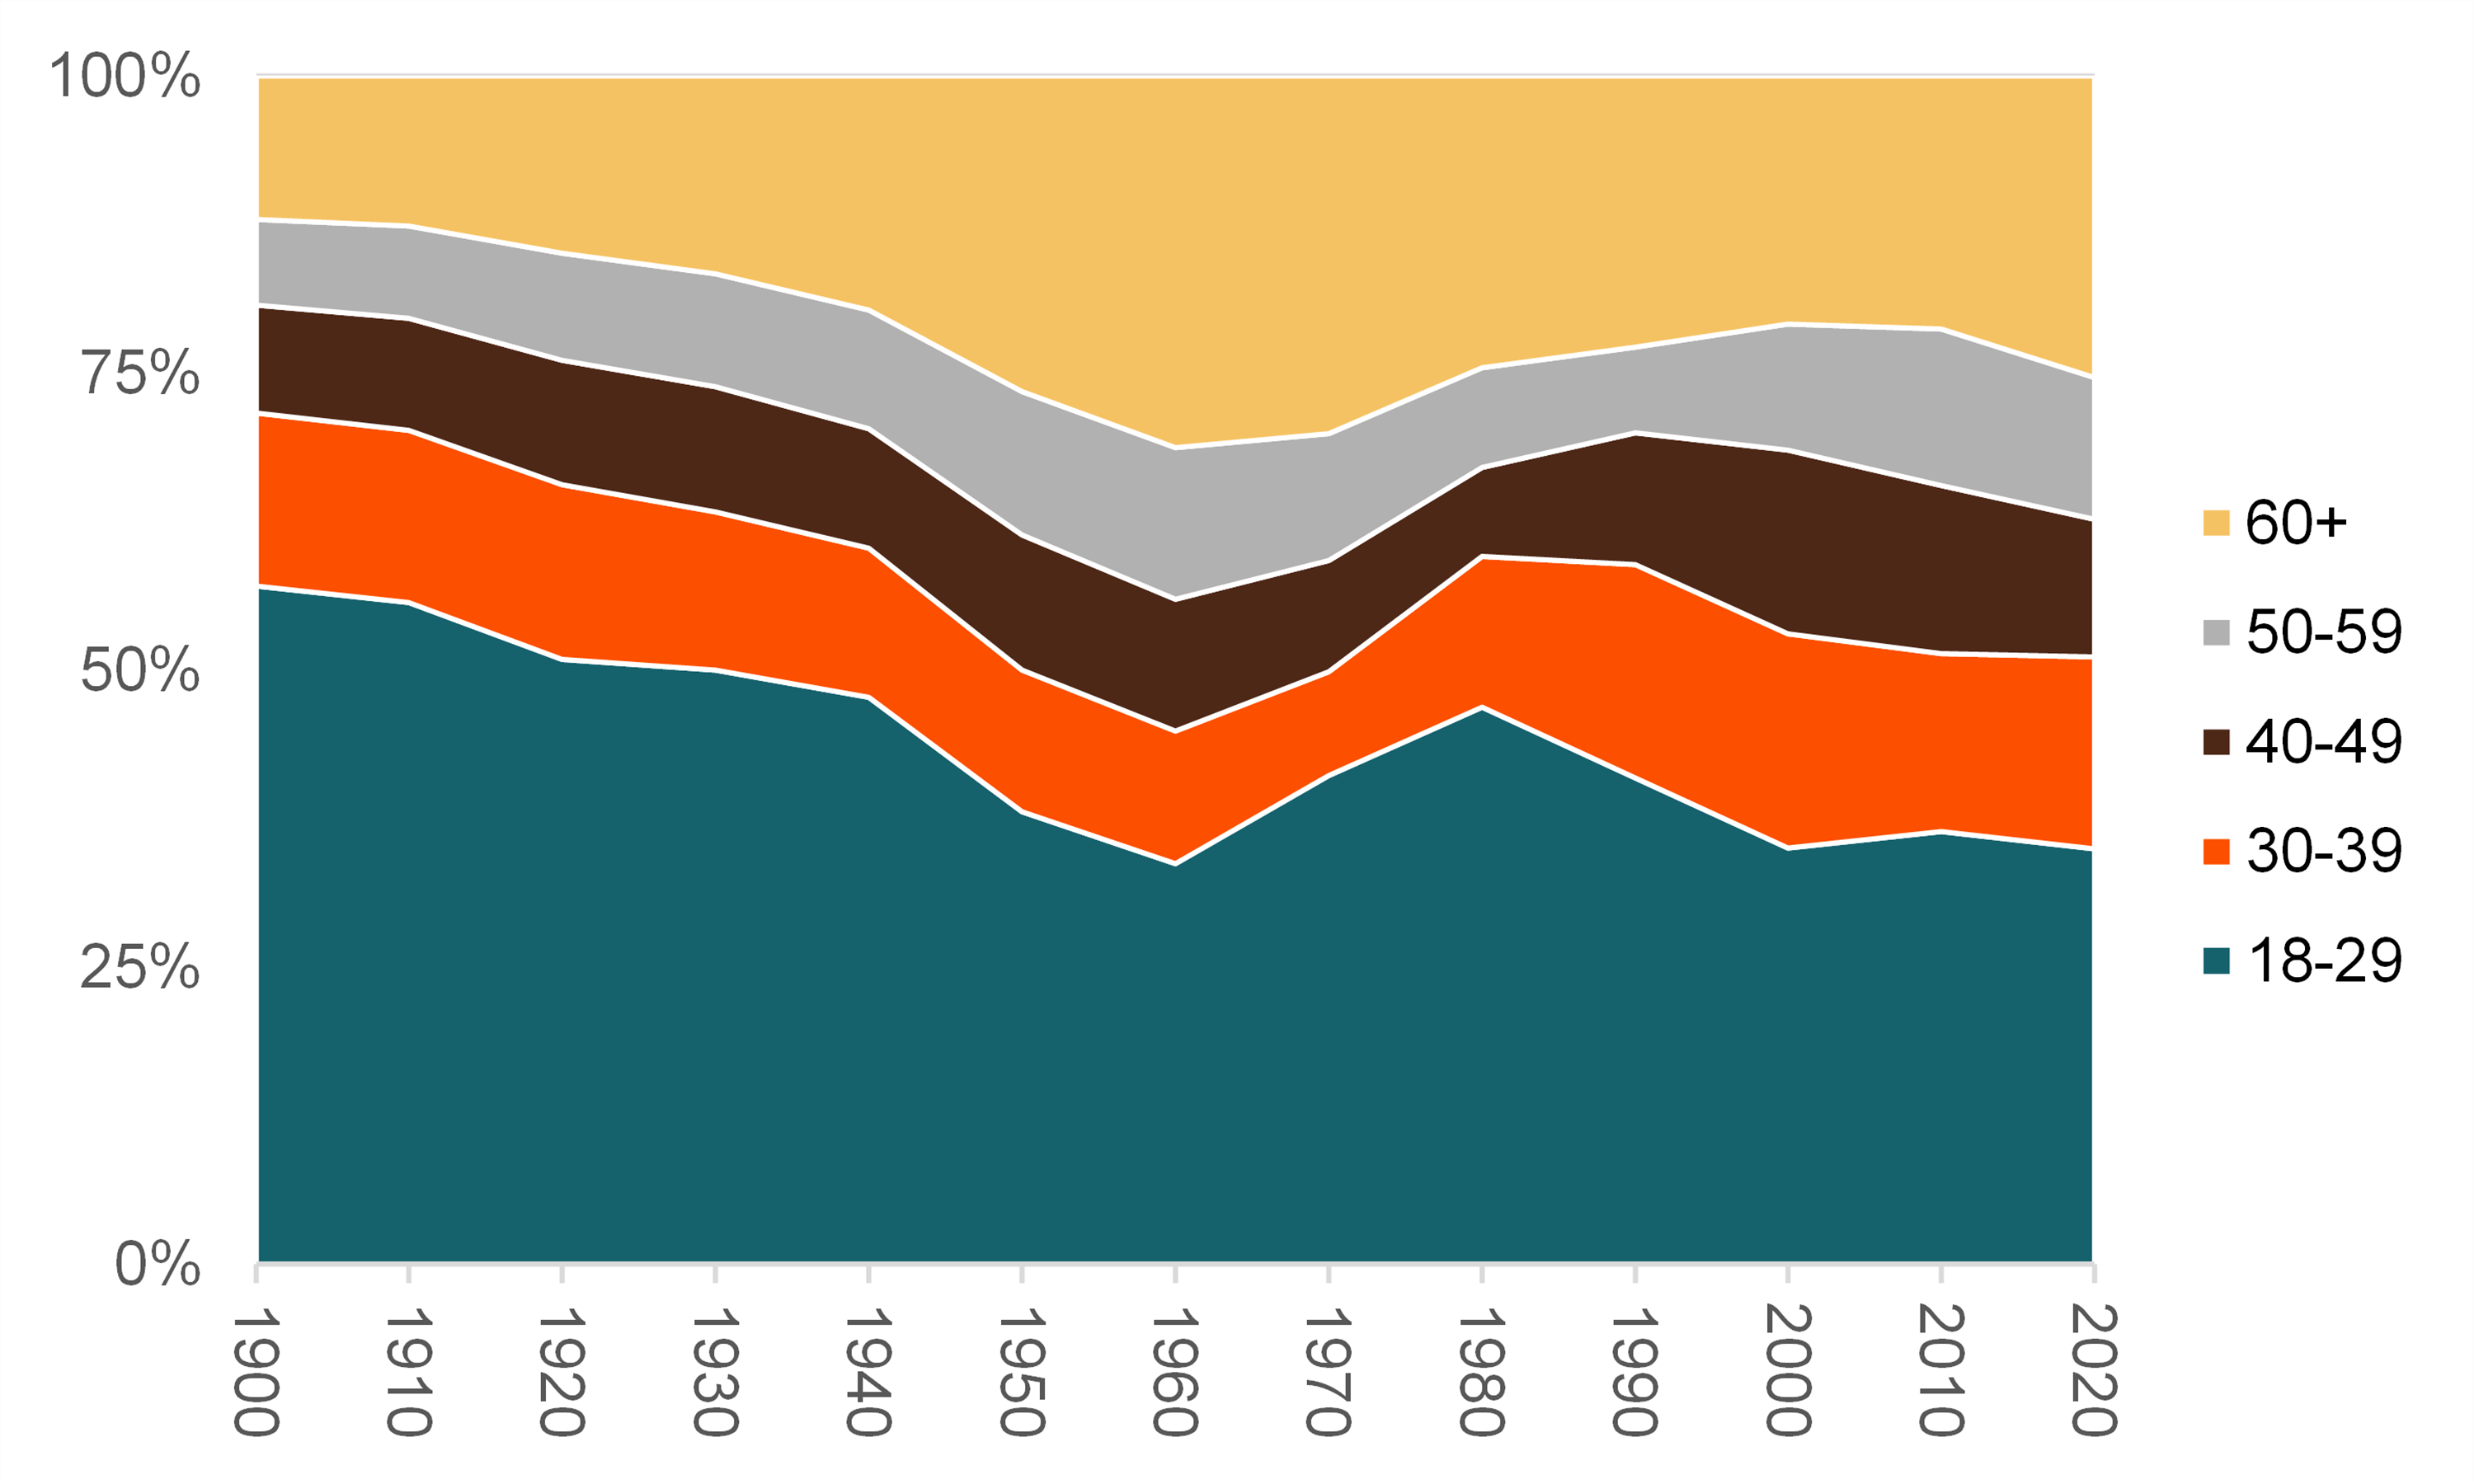
- In 1900, the age group representing the largest share of unmarried adults was those aged 18 to 29 (57%) followed by those aged 30 to 39 at 15%.
- Over the next sixty years these two age groups would compose a decreasing share of the unmarried population. The largest decrease was the share aged 18 to 29 dipping to 34% of the unmarried population in 1960.
- As the share of the unmarried population under the age of 39 decreased through 1960, the share aged 40 to 49, 50 to 59, and 60 years and older increased.
- The greatest increase was the population aged 60 and older—in 1900 they accounted for 13% of the unmarried population and had more than doubled sixty years later when they accounted for 31% due in part to later life expectancy.
- By 1980 the abovementioned trends reversed with the share aged 39 and younger increasing and the share over age 40 decreasing.
- Since 1980, the share of the unmarried population aged 18 to 29 first declined before leveling out to just above one-third in 2020 (35%). The share aged 30 to 39 continued to increase through the year 2000 nearly reaching one-fifth (18%) of the unmarried population, before declining to 16% in 2020. The share aged 40 to 49 reached its peak (15%) in 2000 and then dropped to 12% in 2020. The share aged 50 to 59 also reached a peak, but in 2010 at 13%. The share aged 60 and older hovered between one-quarter and one-fifth of the unmarried population. These trends suggest a growing population of older unmarried adults.
Figure 1. Age Distribution of Unmarried Adults, 1900-2020

Change in the Median Age of Unmarried Men from 1900 to 2020
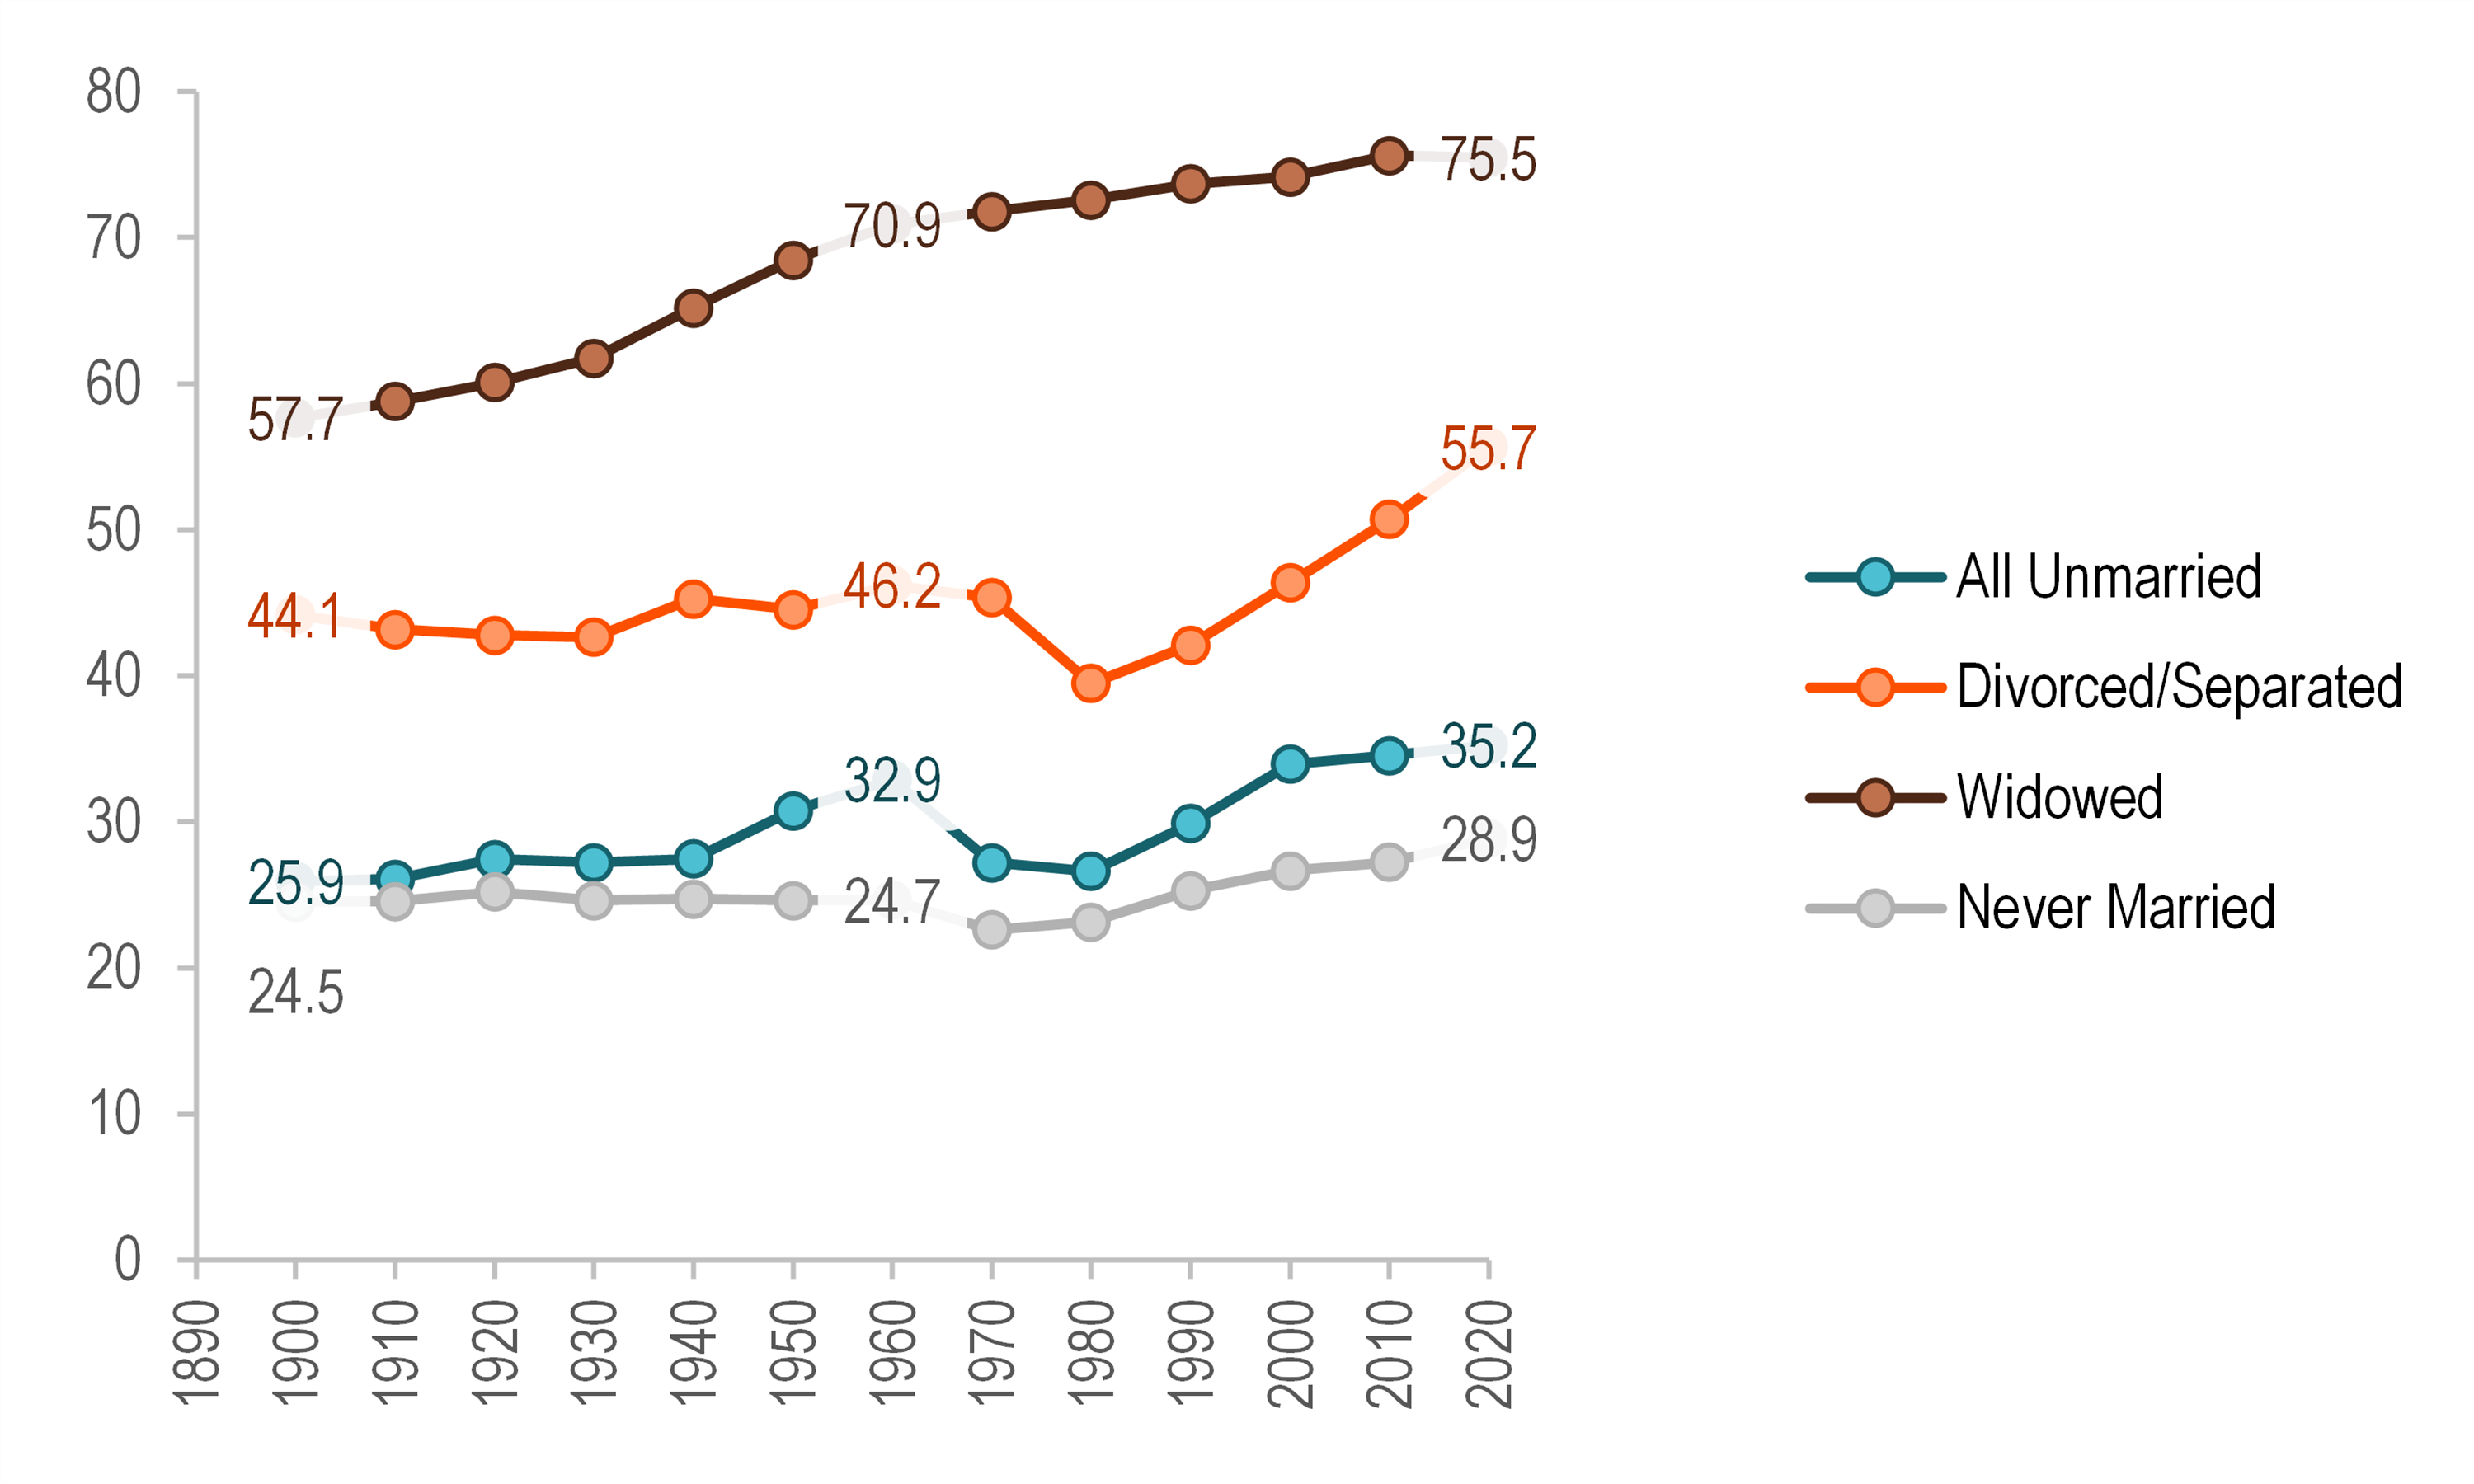
- The median age of all currently unmarried men increased from 1900 to 1960, followed by a decrease in 1980 (26.6). Since 1980, the median age of unmarried men has increased, reaching 35.3 in 2020, nearly a 10-year increase since 1900.
- From 1900 to 1960, the median age of men who had never married remained stable but decreased by about two years in 1970 (22.6). Since this time, the median age has increased reaching 28.9 in 2020.
- The median age for men who were currently divorced increased slightly from 1900 to 1960, followed by a seven-year decrease until 1980 (39.5). In 2020, the median age of currently divorced men increased to 55.7, a near 15-year increase since 1980.
- For currently widowed men, the median age has exhibited a large increase from 57.7 in 1900 to 75.5 in 2020.
Figure 2. Median Age of Unmarried Men, 1900-2020

Change in the Median Age of Unmarried Women from 1900 to 2020
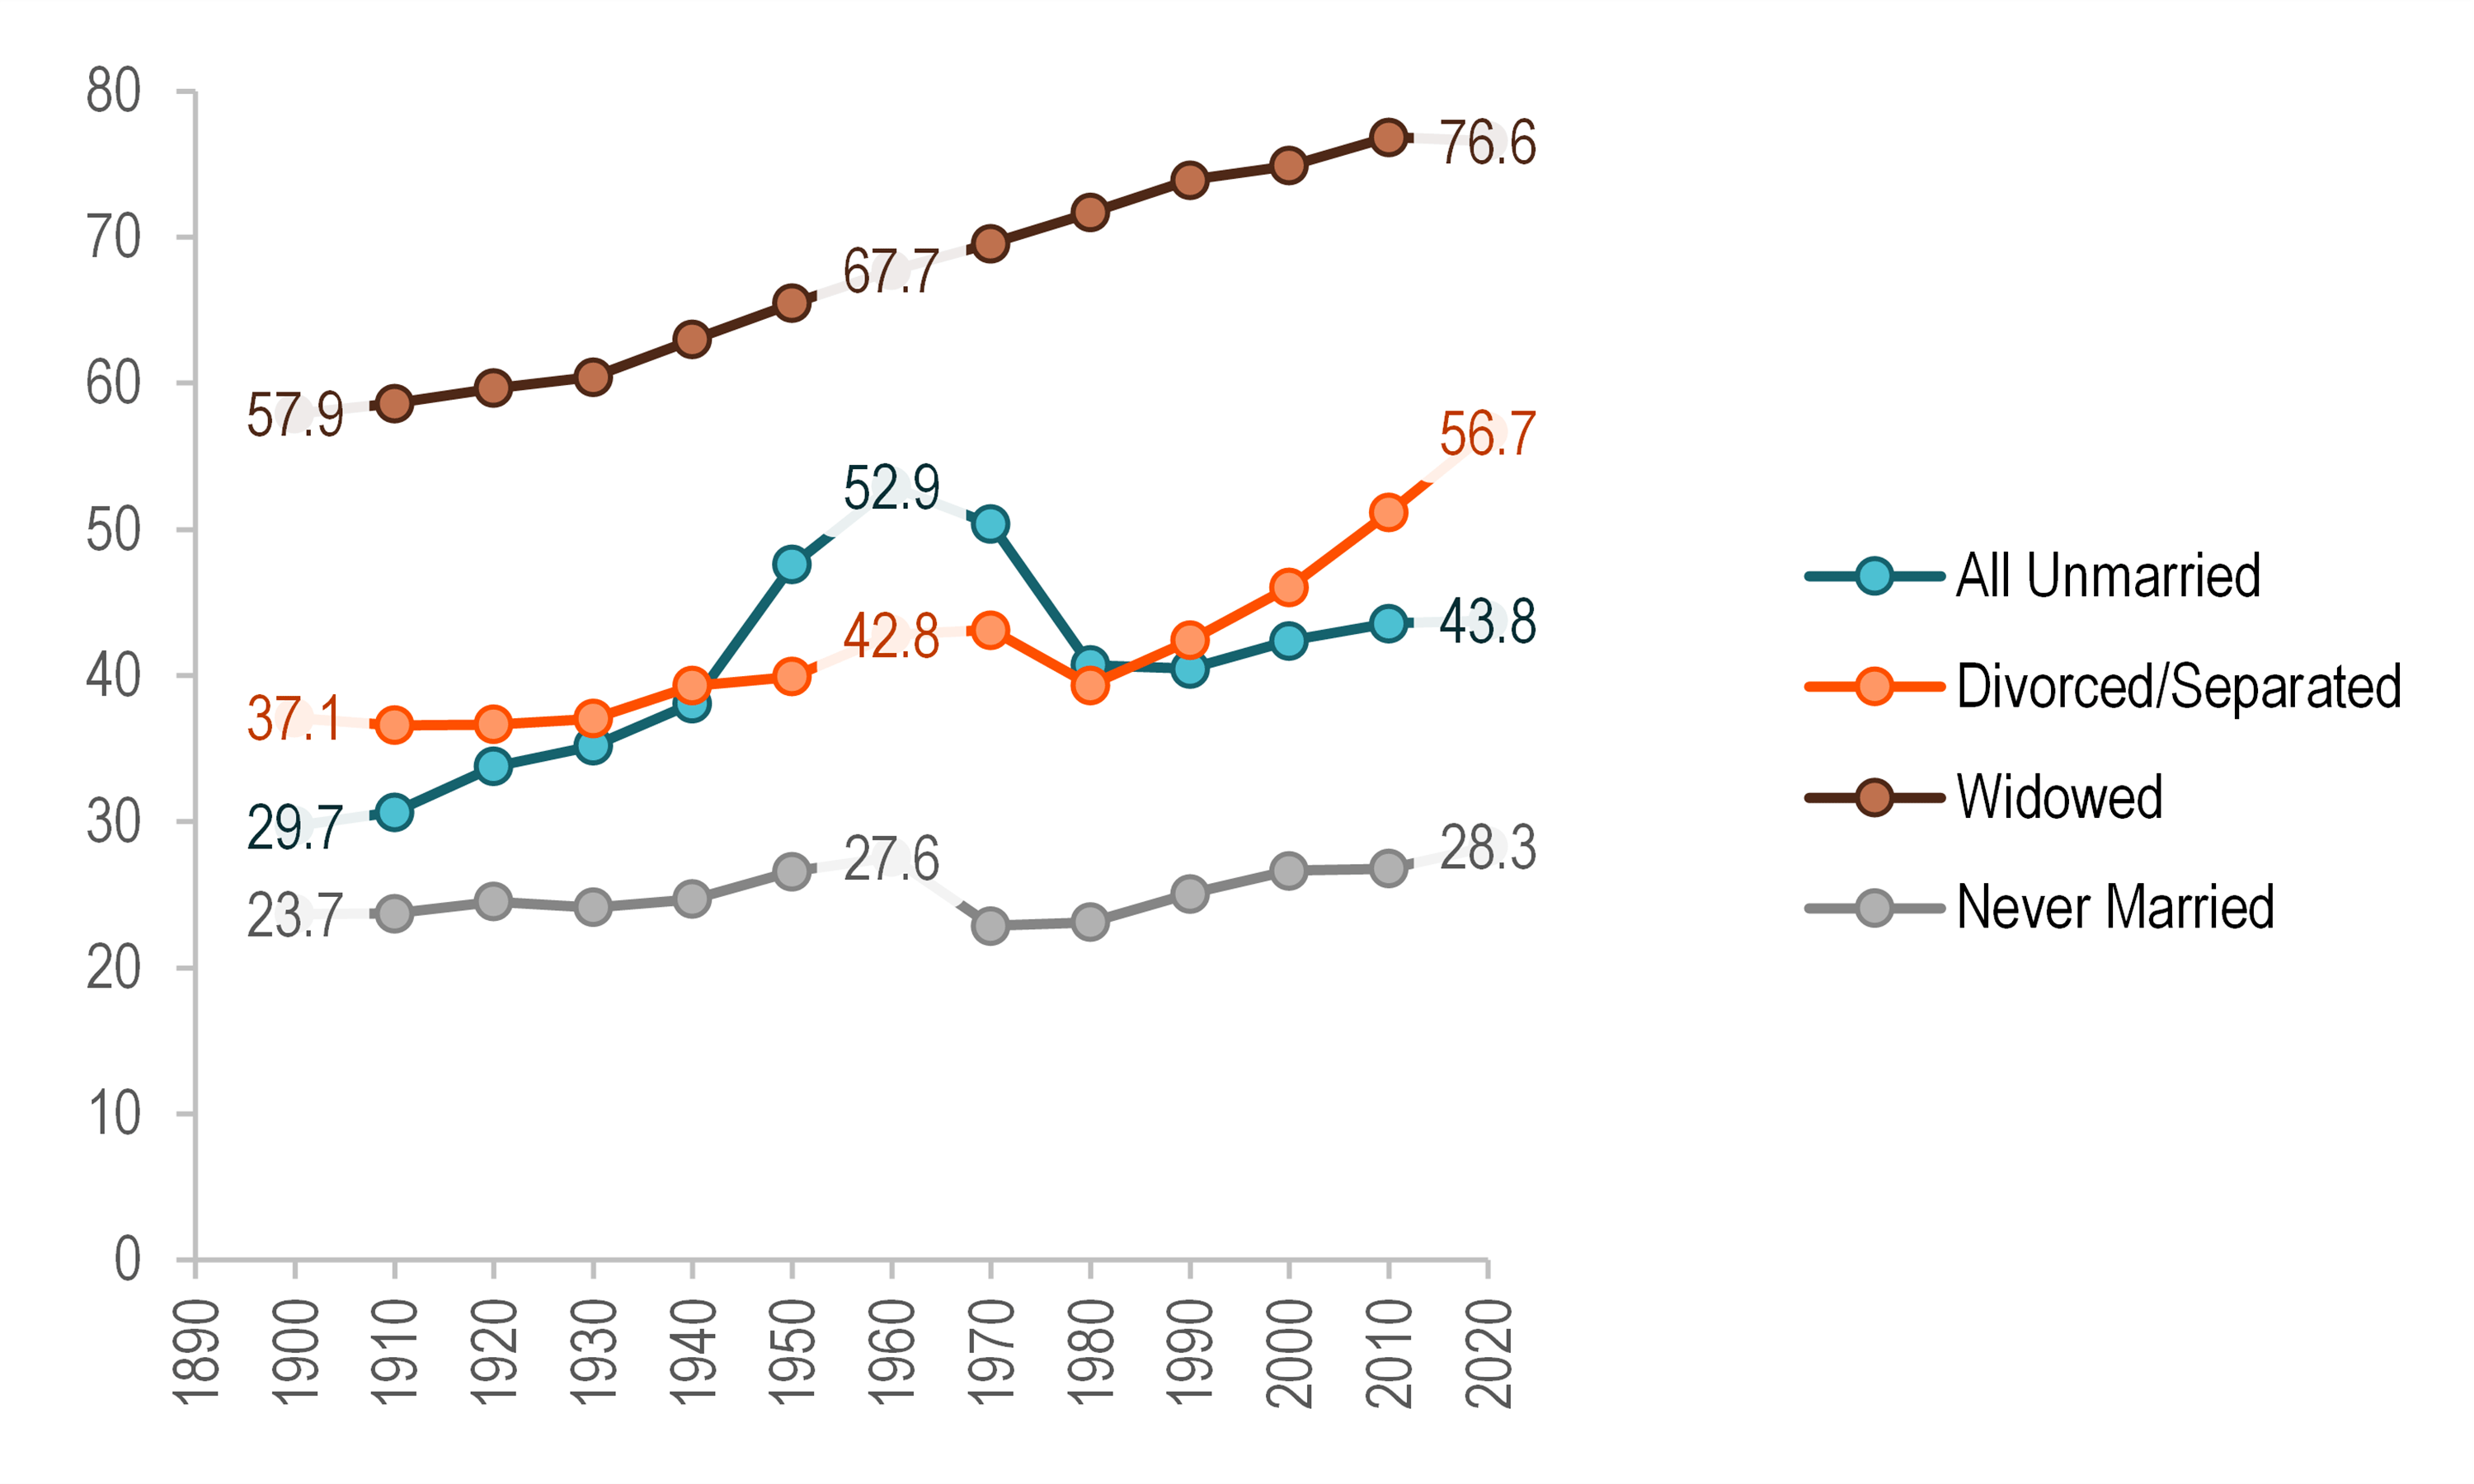
- The median age of all currently unmarried women, including divorced/separated, widowed, and never married adults aged 18 and older, increased from age 29.7 in 1900 to age 52.9 in 1960, the highest median age of unmarried women across the century. Since 1960, the median age declined to 40.5 in 1990. After 1990, the median age of currently unmarried women increased to 43.8 in 2020.
- Women who were currently never married exhibited an increase in age through 1960 (27.6), followed by a decline to 22.9 in 1970. By 2020 it had increased again reaching 28.3. These trends indicate an increasing older share of never married women within the past few decades.
- The median age of women who were currently divorced followed a pattern of increase until 1970 (43.1), decreasing to 39.3 in 1980. Since 1980, the median age of divorced women had increased by about 17 years to 56.7 in 2020.
- Like currently widowed men, the median age of currently widowed women gradually increased from 57.9 in 1900 to 76.7 in 2020, nearly a twenty-year increase.
Figure 3. Median Age of Unmarried Women, 1900-2020

Data Source:
Ruggles, S., Flood, S., Goeken, R., Schouweiler, M., and Sobek, M. (2020). IPUMS USA: Version 12.0 [dataset]. Minneapolis, MN: IPUMS. https://doi.org/10.18128/D010.V12.0
References:
Arias, E., & Xu, J. (2022). United states life tables, 2020. National Vital Statistics Reports, 71(1), 1-64. https://dx.doi.org/10.15620/cdc:118055
Marino, F. A. (2023). Unmarried adulthood: More than a century of change, 1900-2020. Family Profiles, FP-23-04. National Center for Family & Marriage Research. https://doi.org/10.25035/ncfmr/fp-23-04
Payne, K. K. (2021). Median age at first marriage, 2020. Family Profiles, FP-21-12. Bowling Green, OH: National Center for Family & Marriage Research. https://doi.org/10.25035/ncfmr/fp-21-12
Reynolds, L. (2021). The U.S. remarriage rate, 2019: Trends and geographic variation by gender. Family Profiles, FP-21-18. Bowling Green, OH: National Center for Family & Marriage Research. https://doi.org/10.25035/ncfmr/fp-21-18
Schweizer, V. J. (2020). Marriage: More than a century of change. Family Profiles, FP-20-21. Bowling Green, OH: National Center for Family & Marriage Research. https://doi.org/10.25035/ncfmr/fp-20-21
Suggested Citation:
Marino, F. A. (2023). Age variation in unmarried adults, 1900-2020. Family Profiles, FP-23-08. National Center for Family & Marriage Research. https://doi.org/10.25035/ncfmr/fp-23-08
Updated: 11/10/2025 04:25PM

