Union and Childbearing Characteristics of Women 40-44, 2000-2018
Family Profile No. 03, 2020
Authors: Karen Benjamin Guzzo and Valerie Schweizer
Over the last few decades, marriage and childbearing have become less tightly linked (Hayford, Guzzo, & Smock, 2014), and cohabitation has contributed to high levels of non-marital childbearing (Lichter, Sassler, & Turner, 2014). Understanding the links between cohabitation, marriage, and childbearing behaviors is complicated given delays in the timing of both union formation and fertility. Consequently, focusing on union and childbearing characteristics of women at the end of the reproductive years may provide novel insights. In this profile, we use data from the Current Population Survey’s biennial June Fertility Supplement from 2000 (when cohabitation data were first collected) through 2018 to analyze current union status and the distribution of the number of children ever born (one, two, three, or four or more) for women aged 40-44. Information on trends in the number of children ever born by educational attainment and race-ethnicity is presented in a companion profile FP-20-04, and information on differentials in age at first birth in 2018 is discussed in FP-20-06.
Trends in Union Status Since 2000 Among Women Aged 40-44
Despite shifts in first union type and the timing of marriage (FP-19-16; Manning, Brown, & Payne, 2014), the proportion of women who are married, cohabiting, or single at ages 40-44 has stayed remarkably stable since 2000.
- Just under a third of women aged 40-44 were single.
- Across the three time points, the majority of single women aged 40-44 were previously married, but a growing proportion had never married (38% in 2000 to 47% in 2018).
- Although the percentage of women who were cohabiting doubled since 2000 (going from 2% to 4%), cohabiting women comprised a very small proportion of all women aged 40-44 across all time points.
- Since 2000, the mix of previously married and never married women among cohabitors aged 40-44 has been stable, at about two-thirds and one- third, respectively (not shown).
- Approximately two-thirds of women aged 40-44 were married in 2000, 2010, and 2018 with only a two-percentage point decline between 2000 and 2018.
Figure 1. Proportion of Women Aged 40-44 Cohabiting, Married, and Single, 2000-2018

Trends in the Distribution of Children Ever Born by Union Status Among Women 40-44
Although trends in union status have changed little since 2000, there were larger changes within each union status in the distribution of the number of children ever born by ages 40-44. Here, we display the distributions for 2000 and 2018 by union status.
- There was a substantial decrease in the proportion of single women who were childless from 2000 (34%) to 2018 (26%).
- The percentage of single women aged 40-44 with two or more children increased from 48% to 53%.
- Childlessness increased slightly among cohabiting women since 2000, as did the percentage of women with only one child.
- Forty percent of married women aged 40 to 44 in 2000 and in 2018 had 2 children.
- There was a slight decrease in the proportion of married women who were childless from 2000 (12%) to 2018 (9%).
- Regardless of union status at ages 40-44, in 2000 and 2018, the majority of women had at least one child.
Figure 2. Number of Children Ever Born to Women Aged 40-44 by Partnered Status, 2000 & 2018

Trends in the Distribution of Children Ever Born by Marital Status Among Single Women 40-44
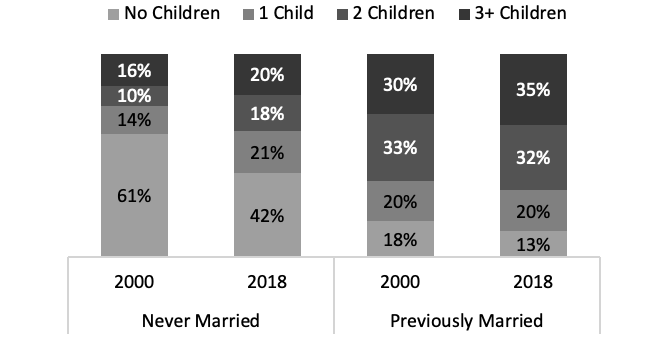
Shifts in nonmarital childbearing means many never married women may nonetheless be mothers. Here, we examine children ever born among previously married single women and never married single women aged 40-44.
- In 2000, the majority of never married single women were childless (61%). By 2018, however, the majority were mothers (58%).
- Most previously married single women aged 40 to 44 had at least one child, increasing from 82% in 2000 to 87% in 2018.
- The proportion who had three or more children also increased from 30% in 2000 to 35% in 2018.
- The proportion who were childless decreased from 18% in 2000 to 13% in 2018.
Figure 3. Number of Children Ever Born Among Single Women Aged 40-44, 2000 & 2018

Data Sources
- Flood, S., King, M., Rodgers, R., Ruggles, S., & Warren, J. R. (2019) Integrated Public Use Microdata Series, Current Population Survey: Version 7.0 [dataset]. Minneapolis, MN: IPUMS. https://doi.org/10.18128/D030.V7.0
References
- Hayford, S. R., Guzzo, K. B., & Smock, P. J. (2014). The decoupling of marriage and parenthood? Trends in the timing of marital first births, 1945–2002. Journal of Marriage and Family, 76(3), 520-538.
- Lichter, D. T., Sassler, S., & Turner, R. N. (2014). Cohabitation, post-conception unions, and the rise in nonmarital fertility. Social Science Research, 47, 134-147.
- Manning, W. D., Brown, S. L., & Payne, K. K. (2014). Two decades of stability and change in age at first union formation. Journal of Marriage and Family, 76(2), 247-260.
- Martin, J. A., Hamilton, B. E., Osterman, M. J. K., & Driscoll, A. K. (2019). Births: Final Data for 2018. National Vital Statistics Reports, 68(13). https://www.cdc.gov/nchs/data/nvsr/nvsr68/nvsr68_13-508.pdf
Suggested Citation
- Guzzo, K. B. & Schweizer, V. (2020). Union and childbearing characteristics of women 40-44, 2000-2018. Family Profiles, FP-20-03. National Center for Family & Marriage Research. https://doi.org/10.25035/ncfmr/fp-20-03
This project is supported with assistance from Bowling Green State University. From 2007 to 2013, support was also provided by the U.S. Department of Health and Human Services, Office of the Assistant Secretary for Planning and Evaluation. The opinions and conclusions expressed herein are solely those of the author(s) and should not be construed as representing the opinions or policy of any agency of the state or federal government.
Updated: 04/06/2021 01:32PM


