Childbearing Desires, Intentions, and Attitudes Among Women 40-44
Family Profile No. 09, 2018
Author: Karen Benjamin Guzzo
The delay in parenthood over the past few decades has led to a small but steady increase in childbearing to women over age 40, with childlessness among those 40-44 declining since 2006 (Pew Research Center, 2018). The shifting age profile of first-time childbearing suggests that women at the end of their childbearing years may still be considering having children in the future. This profile documents trends in desired and intended childbearing among women 40-44 as well as attitudes about childlessness, drawing from several cycles of the National Survey of Family Growth (NSFG) representing the years 2002, 2008, and 2013.
Desires to Have a Child in the Future
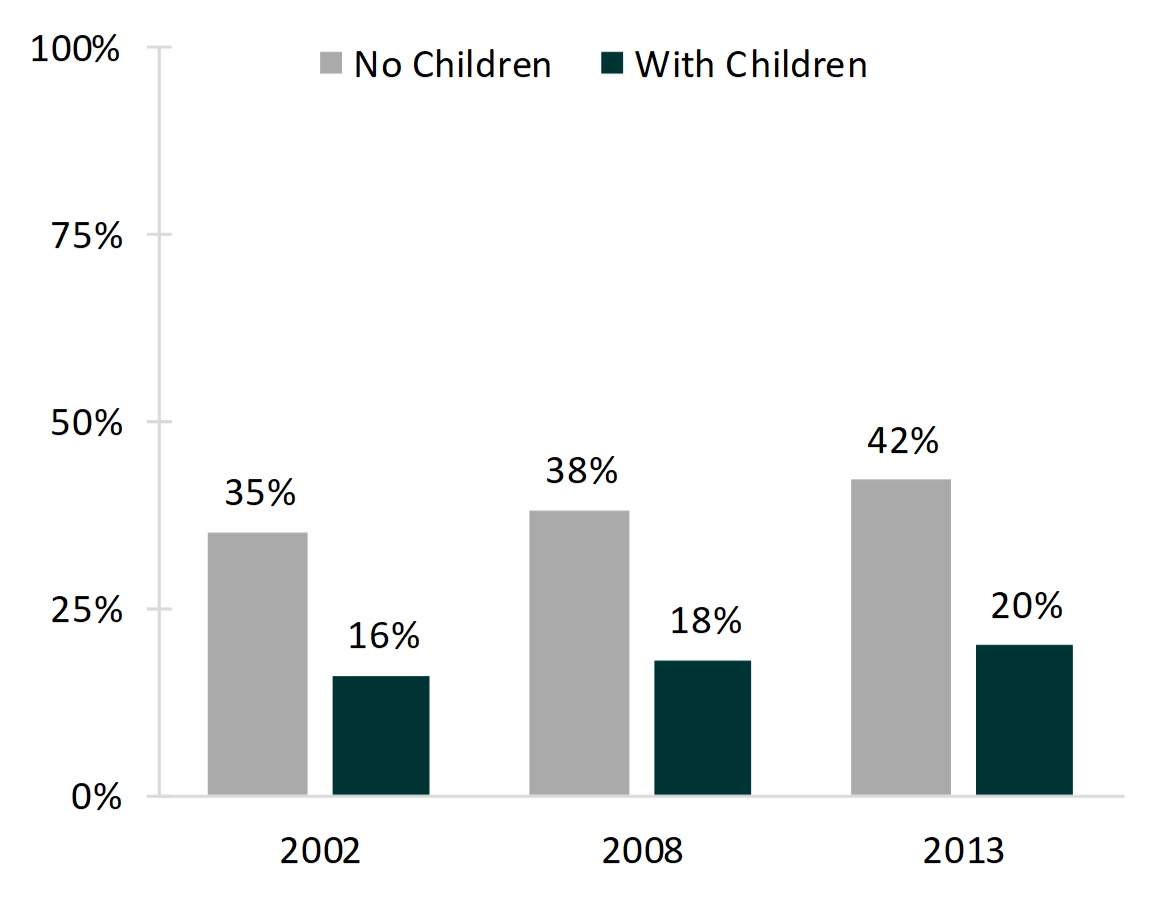
The first section examines the proportion of women aged 40-44 who want to have children, having responded affirmatively to the question “Looking to the future, do you, yourself, want to have a(nother) baby at some time in the future?” The figure compares those who already have children to those who do not have children.
- Between 2002 and 2013, the proportion of 40-44-year-old women who wanted to have a child in the future increased among those with and without children.
- More than twice as many childless women reported wanting to have a child in the future than women who already had children.
- In 2002, slightly more than one in three childless women aged 40-44 wanted to have a child compared to one in six mothers.
- In 2013, 42% of childless women wanted to have a baby in the future compared to only 20% of their peers who already had children.
Figure 1. Desires to Have Children Among Women 40-44, by Childlessness

Intentions to Have a Child in the Future
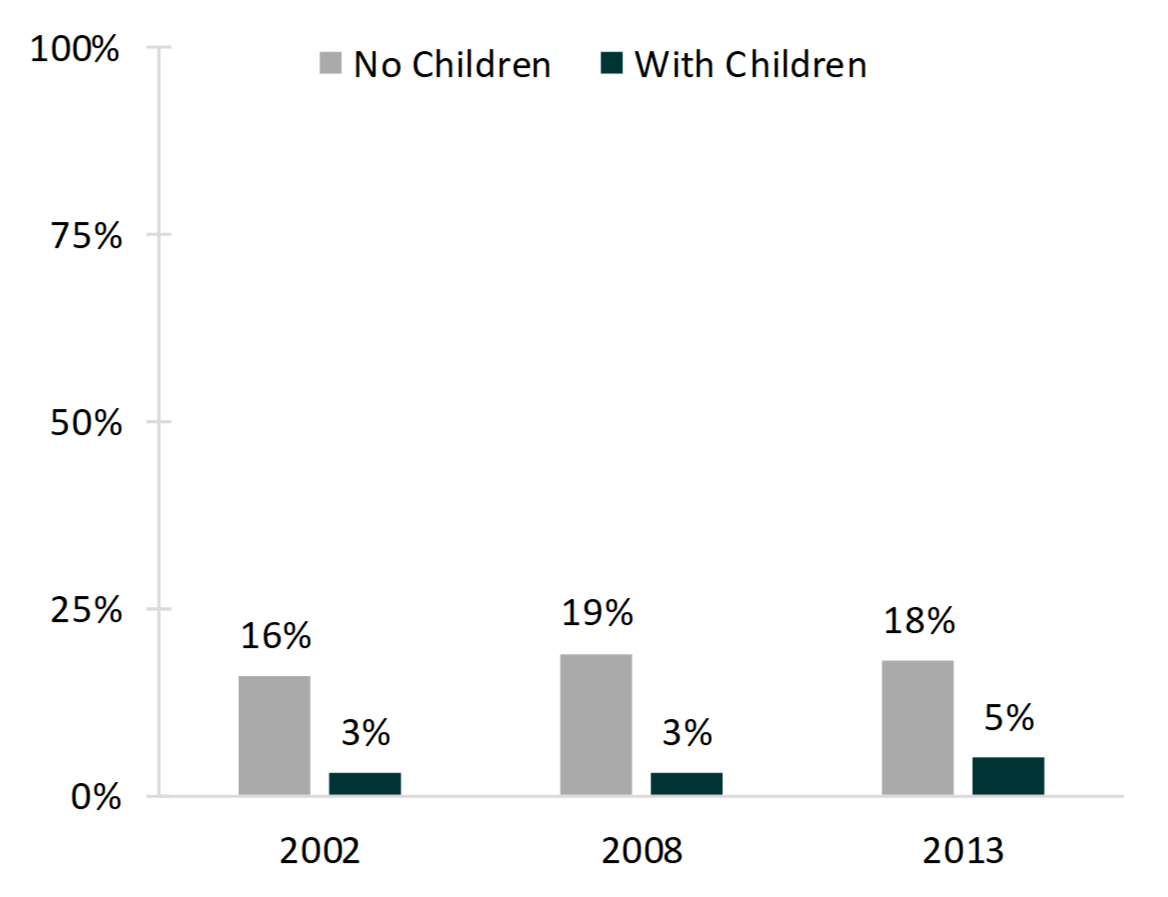
Wanting to have a child does not necessarily mean a woman actually intends or expects to do so. This section examines the proportion of women who responded affirmatively to the question “Looking to the future, do you intend to have a(another) baby at some time?” Again, mothers aged 40-44 are compared to childless women 40-44.
- As with desires to have a child, the proportion of women aged 40-44 who intended to have a child in the future was always higher among childless women than among mothers.
- In 2002, 16% of childless women intended to have a baby in the future, rising to around 18-19% in the later years.
- Among women with children, only 3% intended to have another child in 2002 and 2008, but the percentage rose to 5% in 2013.
- Comparing the percentage of women who want a child (Figure 1) with the percentage of women who actually intend to have a child (Figure 2), it is apparent that far fewer women aged 40-44 expect to fulfill their childbearing desires.
- In 2016, less than half of childless women aged 40-44 who wanted to have a baby intended to have a baby.
- The proportion was even lower among mothers aged 40-44, with roughly one-fourth of those who wanted another child intending to have another child.
- In 2016, less than half of childless women aged 40-44 who wanted to have a baby intended to have a baby.
Figure 2. Intentions to Have Children Among Women 40-44, by Childlessness

Feelings About Not Having Children Among Childless Women
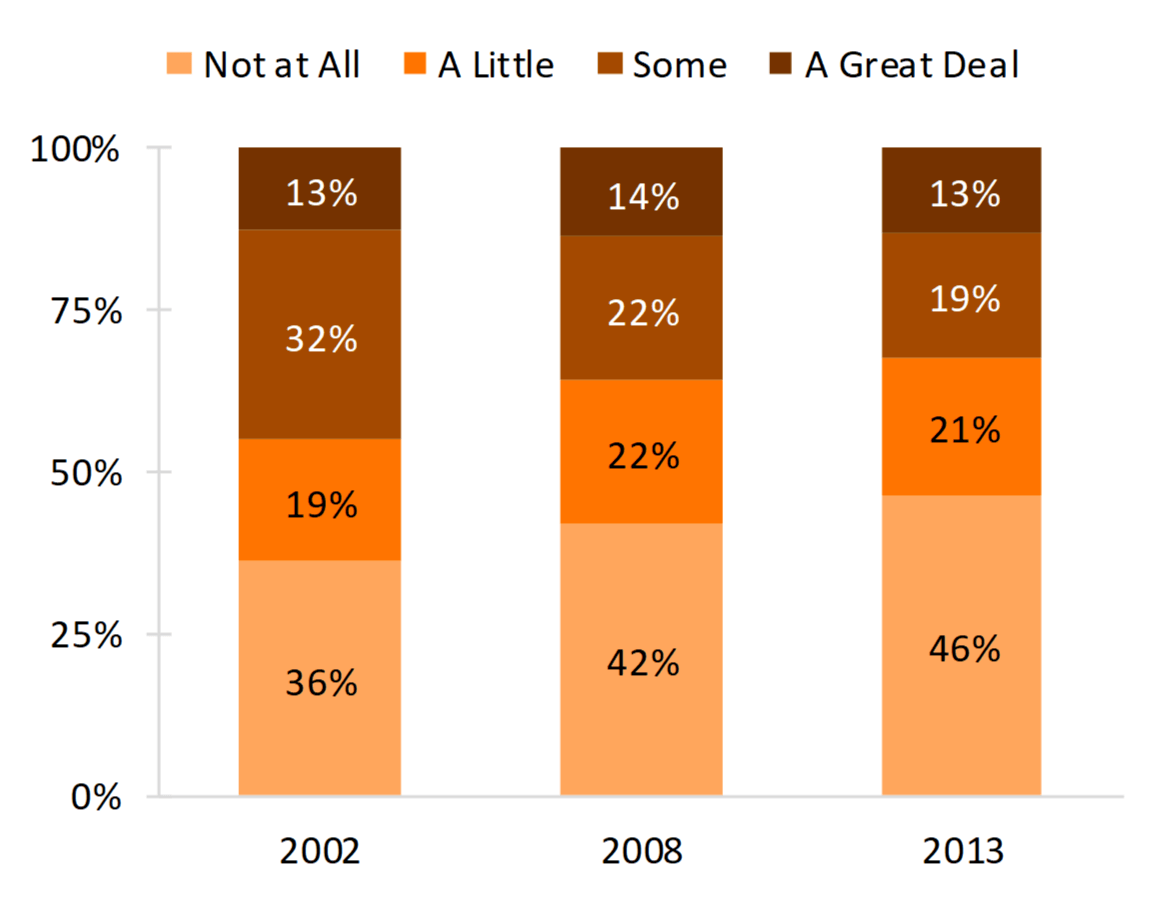
Finally, this section examines trends from 2002 to 2013 in how childless women would feel about not having children based on responses to the question “If it turns out that you do not have any children, would that bother you a great deal, some, a little, or not at all?”
- The percentage of childless women who reported they would be bothered “a great deal” stayed fairly constant between 2002 and 2013, at 13-14%.
- The proportion who would be bothered “some” declined from about a third in 2002 to about a fifth in 2013.
- There was an increase of ten percentage points among childless women aged 40-44 who reported they would be bothered “not at all” if they did not have children, from 36% in 2002 to 46% in 2013.
Figure 3. How Bothered One Would Be If Never Had Children Among Childless Women 40-44

Data Source
- National Center for Health Statistics (NCHS), (2016). 2002, 2011-2010, 2011-2013, 2013-2015 National Survey of Family Growth Public Use Data and Documentation. Hyattsville, MD: CDC National Center for Health Statistics. Retrieved from https://www.cdc.gov/nchs/nsfg/index.htm
References
- Pew Research Center. 2018. “They’re Waiting Longer, but U.S. Women Today More Likely to Have Children than a Decade Ago.” http://assets.pewresearch.org/wp-content/uploads/sites/3/2018/01/18092036/Pew-Motherhood-report-FINAL.pdf
Suggested Citation
- Guzzo, K. B. (2018). Childbearing Desires, Intentions, and Attitudes among Women 40-44. Family Profiles, FP-18-09. Bowling Green, OH: National Center for Family & Marriage Research. https://doi.org/10.25035/ncfmr/fp-18-09
Updated: 11/07/2025 03:35PM

