30 Years of Change in Men’s Entry into Fatherhood, 1987-2017
Family Profile No. 28, 2019
Author: Valerie Schweizer
30 Years of Change in Men's Entry into Fatherhood, 1987-2017
As part of the lengthening transition to adulthood, men and women have been steadily postponing parenthood. In this profile, we use data from the National Survey of Family Growth (2002, 2006-2010, 2011-2013, and 2015-2017) to examine the average age at fatherhood among men aged 40 to 44, which is near the end of the childbearing years. First, we examine the 30-year trend in men’s (and women’s) age at first birth. Then, with a focus on 2015-2017 data, we investigate fathers’ age at first birth across relationship status, race/ethnicity, and educational attainment.
Average Age at Fatherhood & Motherhood
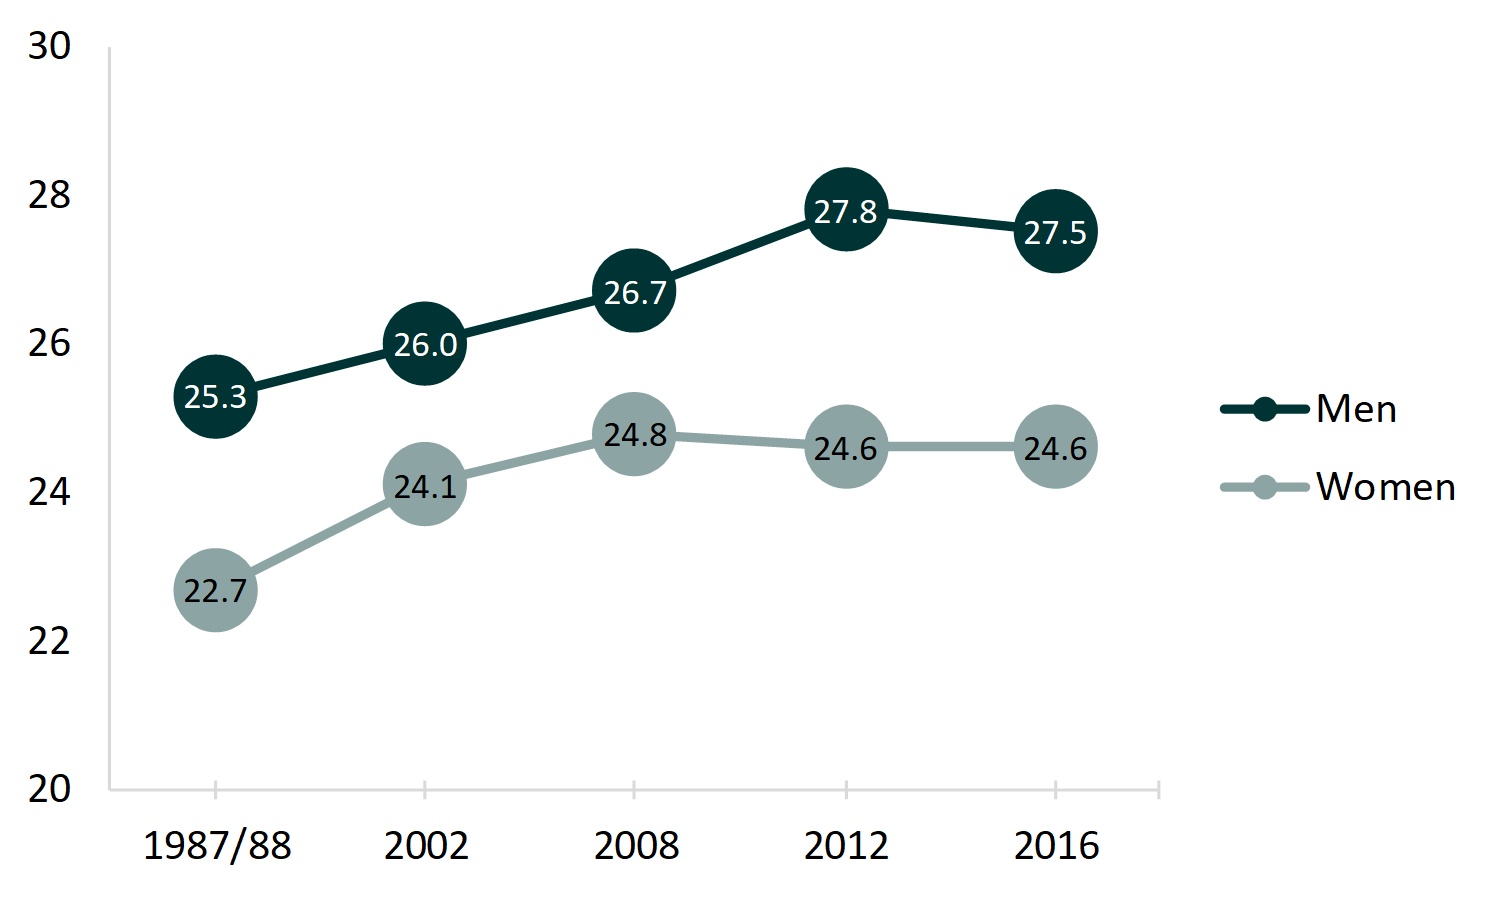
- Among parents aged 40-44 in 2016, the average age at first birth was 27.5 for men and 24.6 for women.
- On average, men were about three years older than women when their first child was born. The gap in age at first birth widened in 2012, but has remained relatively stable since then.
- Three decades ago, men aged 40 to 44 became fathers at 25.3 years old on average. Among the more recent cohort, men’s first births occurred at an average age of 27.5, 2.3 years later than in the late 1980s.
- Trends in mothers’ age at first birth have been similar, rising two years between the late 1980s and today.
Figure 1. Mean Age at First Birth Among U.S. Parents Aged 40-44, 1987-2017

Relationship Status
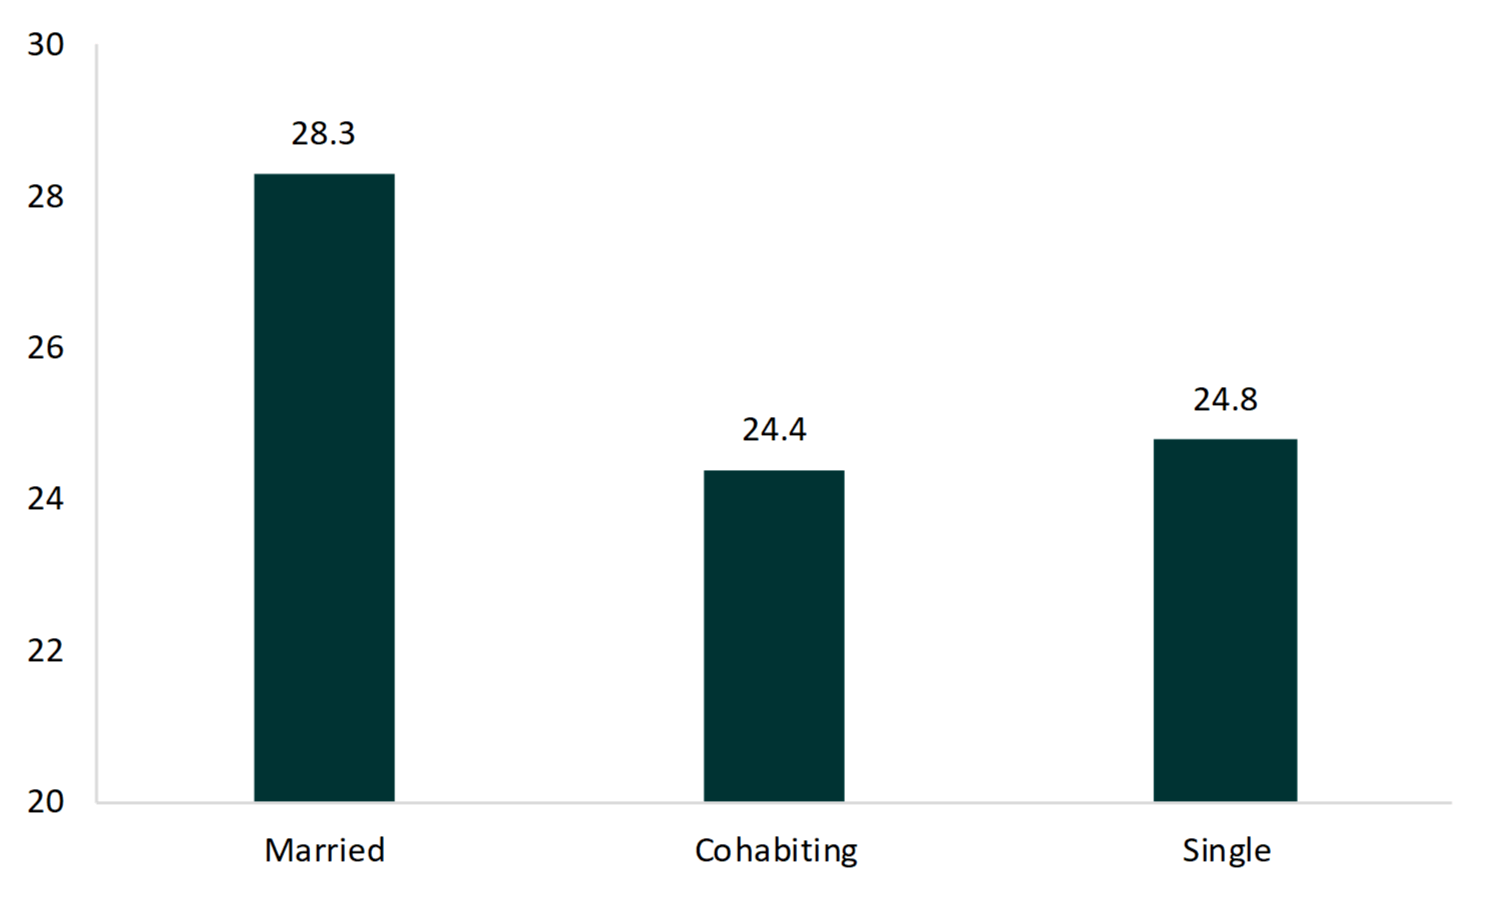
- Among fathers aged 40-44 in 2016, those who were married when their first child was born had the highest average age (28.3) followed by single fathers (24.8) and then cohabiting fathers (24.4).
- Mean ages at fatherhood for married and cohabiting men have decreased since 2012, from 29.4 to 28.3 and from 26.7 to 24.4, respectively (FP-16-10). The mean age for single fathers has risen from 21.5 in 2012 to 24.8 in 2016 (FP-16-20).
- Married fathers experience fatherhood about 4 years later than cohabiting fathers and about 3.3 years later than single fathers.
Figure 2. Mean Age at First Birth by Relationship Status among Fathers Aged 40-44, 2015-2017

Race/Ethnicity
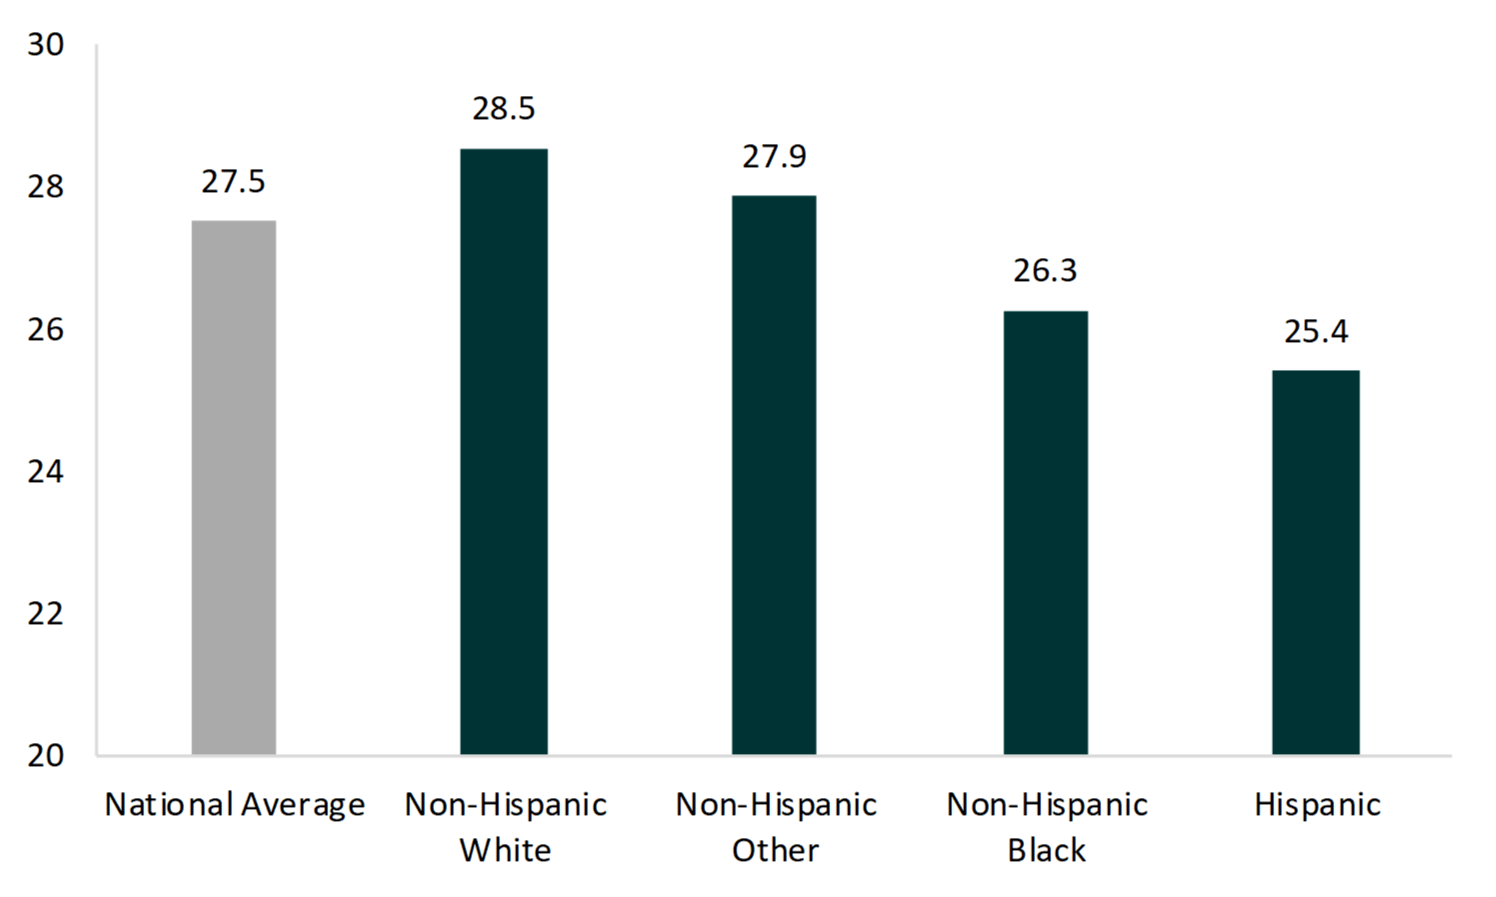
- The mean age at first birth among 40 to 44 year-old fathers was highest among White men (28.5) and lowest among Hispanic men (25.4).
- Men of Other races had the second highest mean age at fatherhood (27.9).
- There is less than a year difference (0.9) between average age at fatherhood for Hispanic men and Black men.
Figure 3. Mean Age at First Birth by Race/Ethnicity Among Fathers Aged 40- 44, 2015-2017

Education
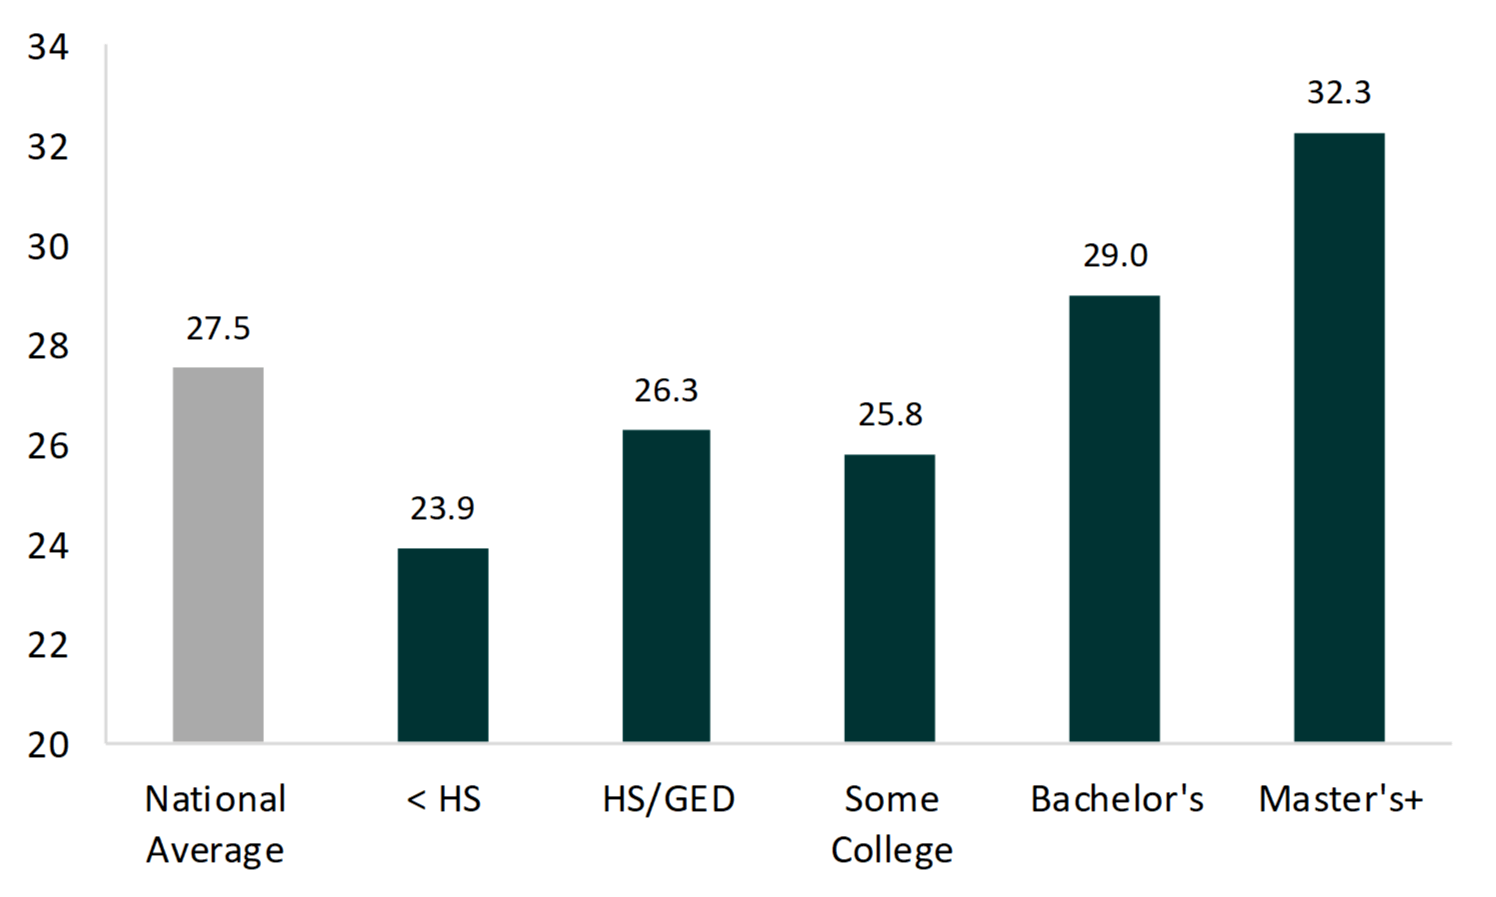
- There is an education gradient in the average age at fatherhood among men aged 40-44.
- The highest average age at fatherhood was among men with a master’s degree or higher, at 32.3 years old. Those with a bachelor’s degree had an average age at fatherhood of 29.0, over three years younger than those with a master’s or higher.
- The lowest average age at parenthood was among those with less than a high school diploma, at 23.9 years old. Fathers aged 40-44 with a high school diploma/GED had children at age 26.3, on average, whereas those with some college had a first birth earlier (25.8).
- The highest average age at fatherhood was among men with a master’s degree or higher, at 32.3 years old. Those with a bachelor’s degree had an average age at fatherhood of 29.0, over three years younger than those with a master’s or higher.
Figure 4. Mean Age at First Birth by Education Among Men aged 40-44, 2015-2017

References
- Augustine, J. M. (2016). Exploring new life course patterns of mother’s continuing secondary and college education. Population Research and Policy Review, 35(6), 727-755.
- Eggebeen, D. J. (2002). The changing course of fatherhood: Men's experiences with children in demographic perspective. Journal of Family Issues, 23(4), 486-506.
- Eickmeyer, K. J. (2016). Over 25 years of change in men’s entry into fatherhood, 1987-2013. Family Profiles, FP-16-10. Bowling Green, OH: National Center for Family & Marriage Research. https://www.bgsu.edu/ncfmr/resources/data/family-profiles/eickmeyer-fatherhood-25years-change-entry-fp-16-10.html
Suggested Citation
- Schweizer, V. J. (2019). 30 Years of Change in Men’s Entry into Fatherhood, 1987-2017. Family Profiles, FP-19-28. Bowling Green, OH: National Center for Family & Marriage Research. https://doi.org/10.25035/ncfmr/fp-19-28
Updated: 11/12/2025 09:51AM

