The Retreat from Remarriage, 1950-2017
Family Profile No. 17, 2019
Author: Valerie Schweizer
The precipitous decline in remarriage since the 1980s is well documented (Sweeney, 2010; Payne, 2018). Less is known about the “retreat from remarriage” prior to the 1980s. Using data from the Vital Statistics of the United States and the American Community Survey, we examine the remarriage rate for men and women aged 15 and older from 1950 to 2017. Review additional data on the recent change in the remarriage rate (FP-18-16).
Remarriage Rate, 1950-2017
- Over nearly six decades, the remarriage rate for both men and women has decreased.
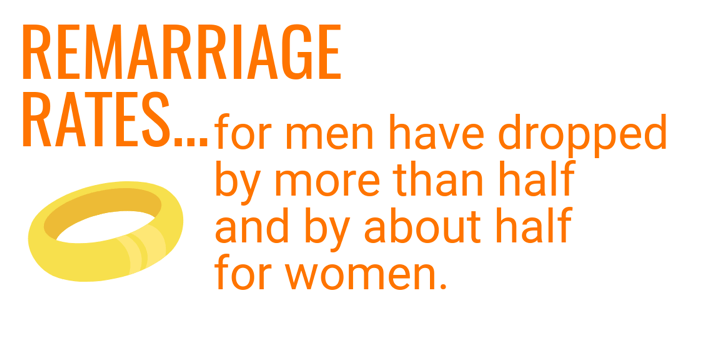
- Remarriage rates for men have dropped by more than half, from 90.9 remarriages in 1950 to 38.8 remarriages per 1,000 previously married men in 2017.
- Men’s remarriage rate peaked at 116.5 remarriages per 1,000 previously married men in 1970.
- Remarriage rates for women have fallen by about half, from 42.2 remarriages per 1,000 previously married women to 21.2 remarriages in 2017.
- In both 1950 and 2017, the remarriage rate for men was about twice that of the rate for women.
Figure 1. The Remarriage Rates of Men and Women Aged 15 and Older, 1950-2017

Source: NCFMR analyses of Vital Statistics of the United States, 1950; Monthly Vital Statistics Reports 1960, 1970, 1980, 1990; US Census Bureau, American Community Survey, 2008-2017
Median Age at Remarriage, 1950-2017
- Decreasing remarriage rates for men and women coincide with rising ages at remarriage.
- Women’s median age at remarriage has increased by 9 years since 1950, from 34 to 43 years old. Men’s median age at remarriage has risen by 6 years, from 40 to 46 years old.
- At both time points, women’s median age at remarriage was younger than men’s.
- The age gap between women and men has decreased over time from a difference of 6 years in 1950 to only 3 years in 2017.
- Women’s median age at remarriage has increased by 9 years since 1950, from 34 to 43 years old. Men’s median age at remarriage has risen by 6 years, from 40 to 46 years old.
Figure 2. The Remarriage Rate and Median Age at Remarriage by Gender, 1950-2017

Source: NCFMR analyses of Vital Statistics of the United States, 1950; Monthly Vital Statistics Reports 1960, 1970, 1980, 1990; US Census Bureau, American Community Survey, 2008-2017
Remarriage Rate by Age Distribution, 1950-2017
- Women’s remarriage rate steadily declined for every age group.
- A consistent age gradient in remarriage rates exists. Women aged 15 to 24 had the highest remarriage rates, and those aged 45 and older had the lowest.
Figure 3. Women's Remarriage Rate by Age Group, 1950-2017

Source: NCFMR analyses of Vital Statistics of the United States, 1950; Monthly Vital Statistics Report, 1980; US Census Bureau, American Community Survey, 2008-2017
Remarriage Rate and At-Risk Population, 1950-2017
- Although the population eligible for remarriage (divorced or widowed) has increased from 1950 to 2017, remarriage rates for both men and women have continued to decline.
- Since 1950, the share of men eligible to remarry doubled from 6% to 12%.
- A growing share of women were eligible to remarry, rising from 15% to 21%.
- Since 1950, the share of men eligible to remarry doubled from 6% to 12%.
- Although a larger share of women than men are eligible to remarry, the rate of remarriage among men continues to outpace that of women.
Figure 4. The Remarriage Rate and At-Risk Population by Gender, 1950-2017

Source: NCFMR analyses of Vital Statistics of the United States, 1950; Monthly Vital Statistics Reports 1960, 1970, 1980, 1990; US Census Bureau, American Community Survey, 2008-2017
Data Sources
- Clarke, S. C. Advance Report of Final Marriage Statistics, 1989 and 1990. Monthly Vital Statistics Report: Vol 43 No 12, suppl. Hyattsville, MD: National Center for Health Statistics. 1995.
- National Center for Health Statistics: Advance report, final marriage statistics, 1980. Monthly Vital Statistics Report. Vol. 32-No. 5, SUPP. DHHS Pub. No. (PHS) 83–1, 120. Public Health. This report may be reprinted without further Service, Hyattsville, MD., Aug. 1983.
- Ruggles, S., Genadek, K., Goeken, R., Grover, J., and Sobek, M. Integrated Public Use Microdata Series: Version 6.0. Minneapolis: University of Minnesota, 2015. http://doi.org/10.18128/D010.V6.0
- Vital Statistics of the United States, 1950. Volume 2. Hyattsville, MD: National Center for Health Statistics. 1954.
- Vital Statistics of the United States, 1960. Volume 3. Hyattsville, MD: National Center for Health Statistics. 1964.
References
- Payne, K. K. (2018). Change in the U.S. remarriage rate, 2008 & 2016. Family Profiles, FP-18-16. Bowling Green, OH: National Center for Family & Marriage Research. https://www.bgsu.edu/ncfmr/resources/data/family-profiles/payne-change-remarriage-rate-fp-18-16.html
- Sweeney, M. (2010). Remarriage and stepfamilies: Strategic sites for family scholarship in the 21st century. Journal of Marriage & Family 72(3), 667-684. DOI: 10.1111/j.1741-3737.2010.00724.x
Suggested Citation
- Schweizer, V. (2019). The retreat from remarriage, 1950-2017. Family Profiles, FP-19-17. Bowling Green, OH: National Center for Family & Marriage Research. https://doi.org/10.25035/ncfmr/fp-19-17

Updated: 07/08/2026 07:44PM