Number of Children to Women Aged 40-44, 1980-2022
Family Profile No. 29, 2023
Authors: Karen Benjamin Guzzo and Jaden Loo
Birth rates in the U.S. have steadily declined since the Great Recession. The Total Fertility Rate (TFR), which estimates the average number of births women will have if they experience current birth rates throughout their childbearing years, was at a record low of 1.73 births per woman in 2019 and dropped further to 1.64 births per woman in 2021 (Osterman, Hamilton, Martin, Driscoll, & Valenzuela, 2023). However, the TFR does not reflect changes in birth timing, and although birth rates have fallen at younger ages, they have risen for women 35 and older (Osterman et al., 2023). As such, looking at the number of children ever born provides another way of examining fertility trends. In this profile, we use data from the Current Population Survey’s (CPS) biennial June Fertility Supplement for the years 1980, 1990, 2000, 2010, and 2022 to analyze completed fertility at the end of the reproductive years. We present trends in the distribution of children ever born (one, two, three, or four or more) for women aged 40-44 for the overall population and by race-ethnicity and education. This is an update of a previous Family Profile (Guzzo & Schweizer, 2020).
Overall Trends in the Distribution of Children Ever Born
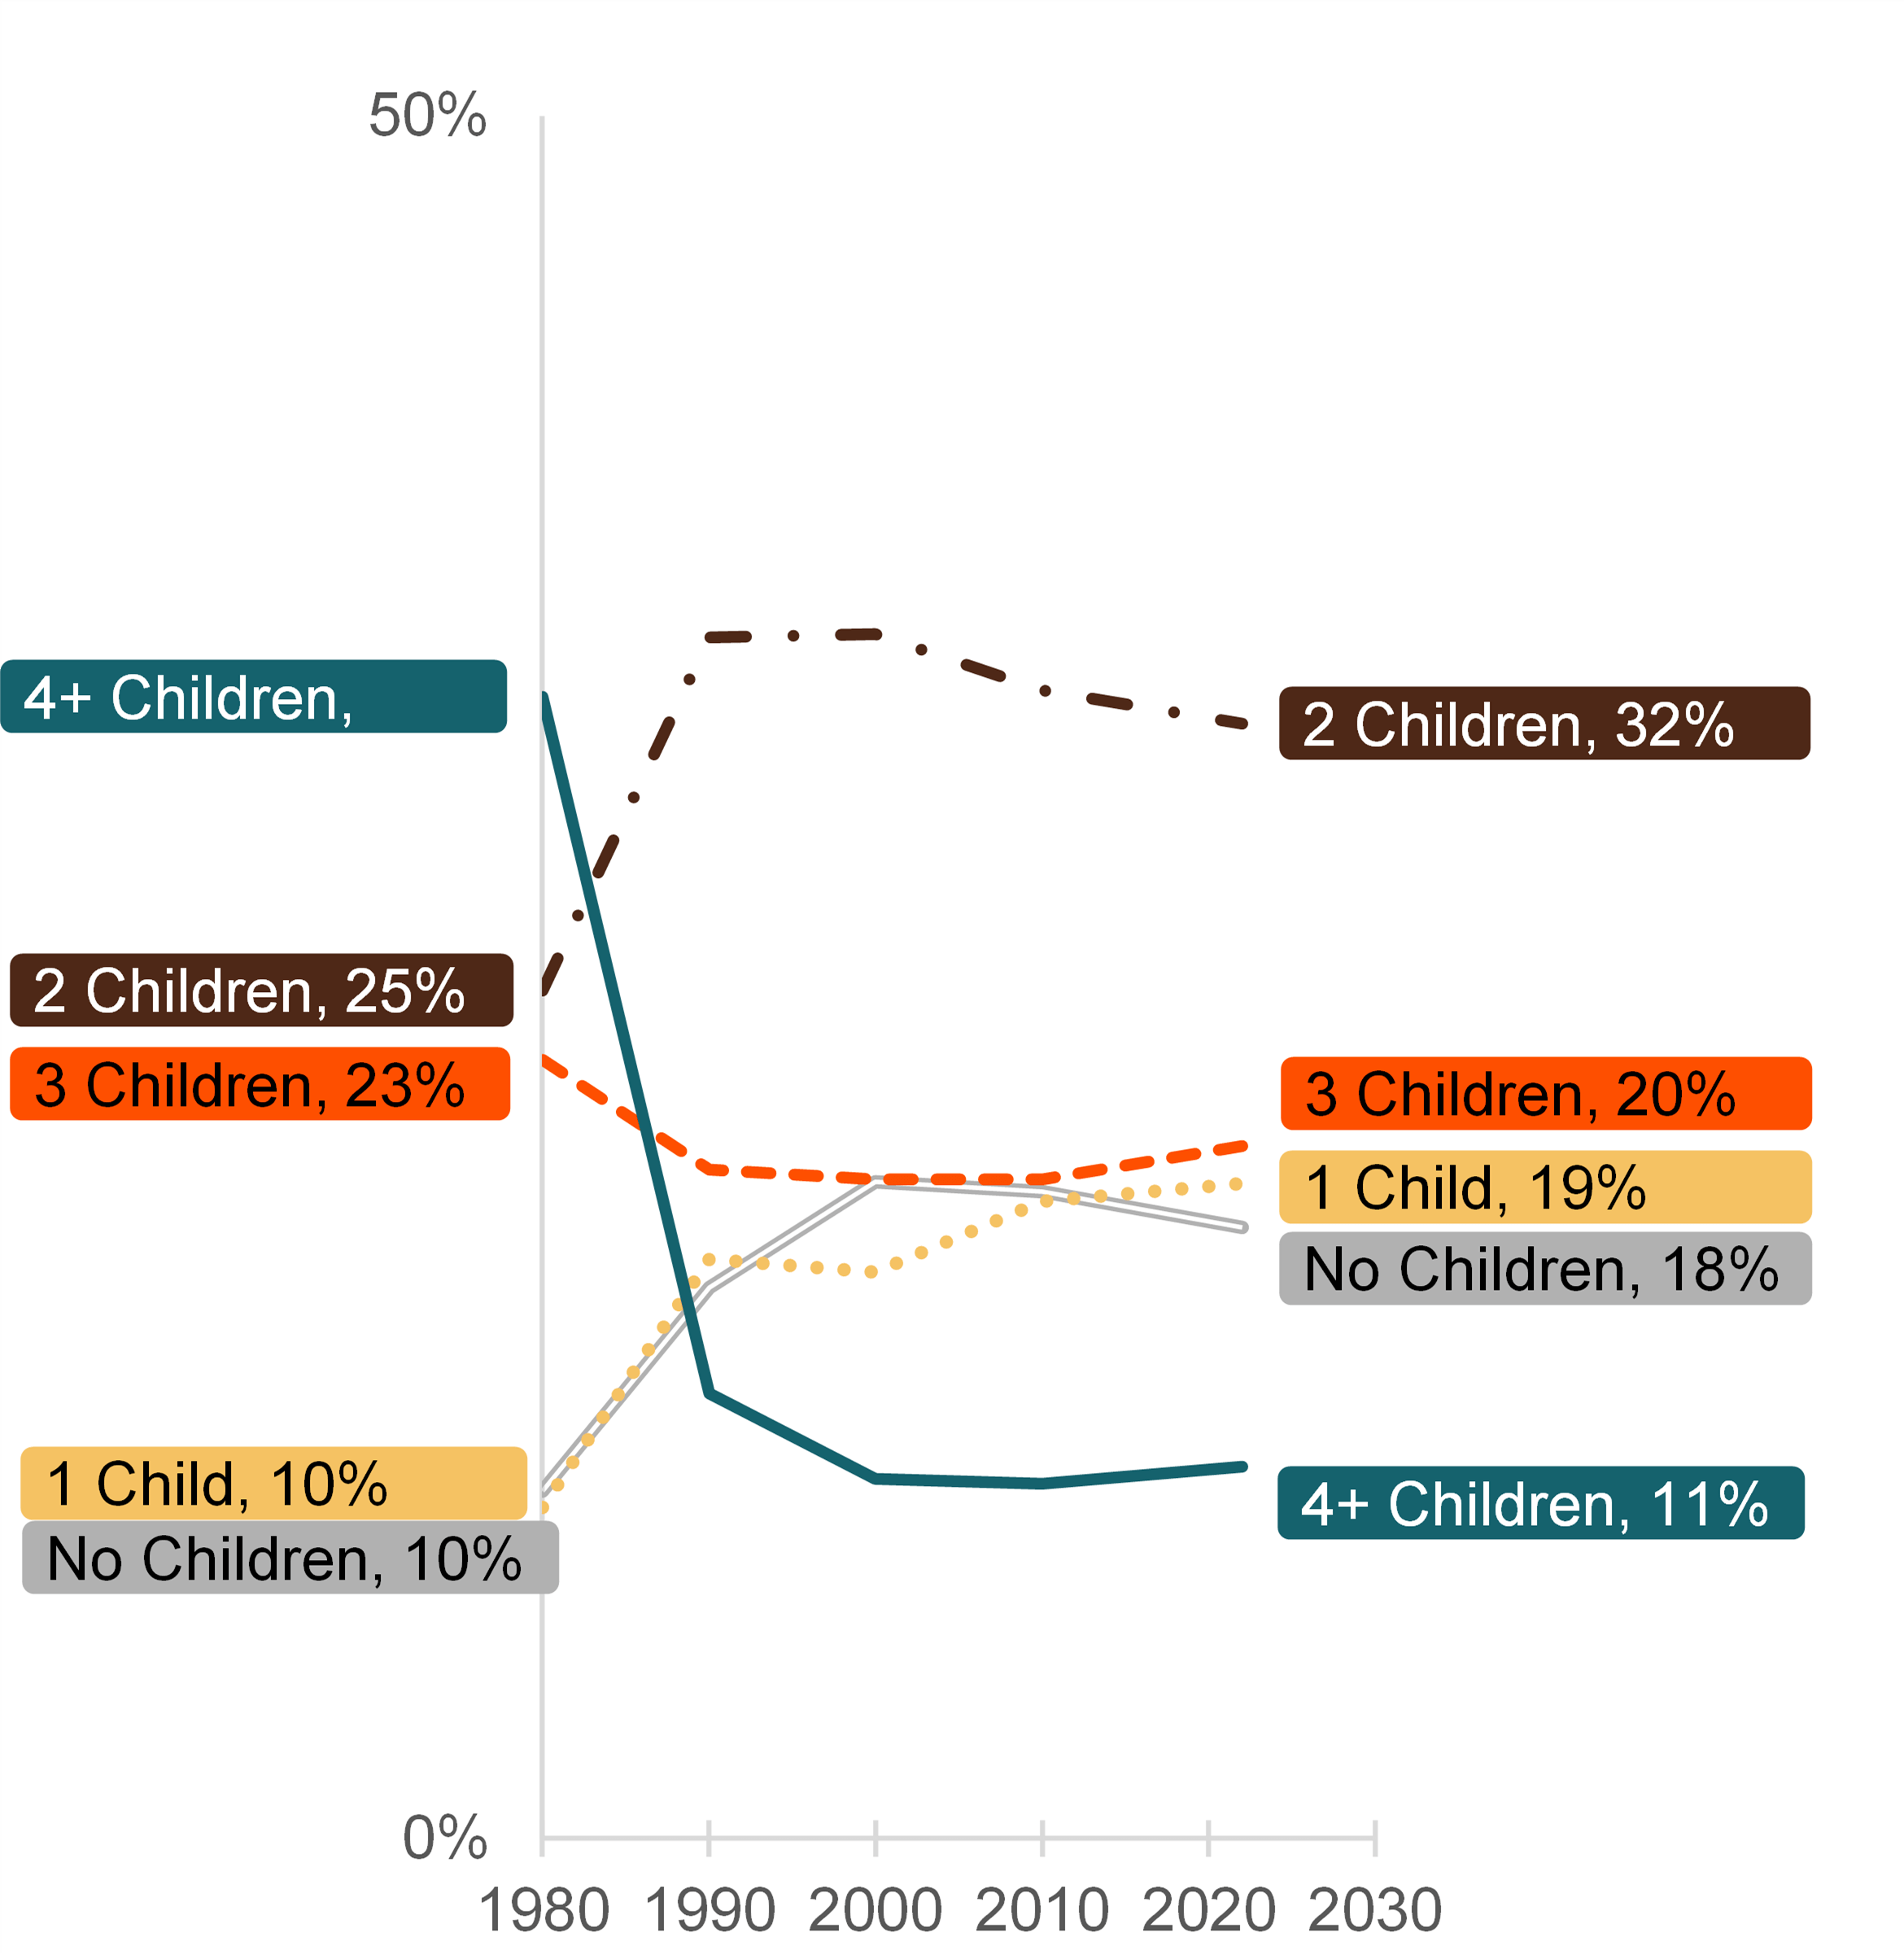
The longer-term trend has been toward smaller families. In 1980, the mean number of children ever born was 3.0. By 1990, it had fallen to 2.1, and, since 2000, it has hovered around 1.9 (not shown).
- The percentage of women aged 40 to 44 who did not have a child increased from 10% in 1980 to 19% in 2000 and has since remained roughly stable.
- Those who only have one child nearly doubled from 10% in 1980 to 19% in 2010 and has plateaued around level.
- Having two children has been the most common pattern since 1990, but the percentage has decreased slightly from 35% in 2000 to 32% in 2022.
- The proportion of women with three children has remained stable for nearly three decades, with about 19% of women in this category from 1990 to 2010 and 20% in 2022.
- Women with four or more children were the modal category in 1980 (33%) but represented the lowest percentage of women since 1990, and, in 2022, only 11% of women had four or more children.
Figure 1. Number of Children to Women Aged 40-44, 1980-2022

Trends in the Distribution of Children Ever Born by Race-Ethnicity
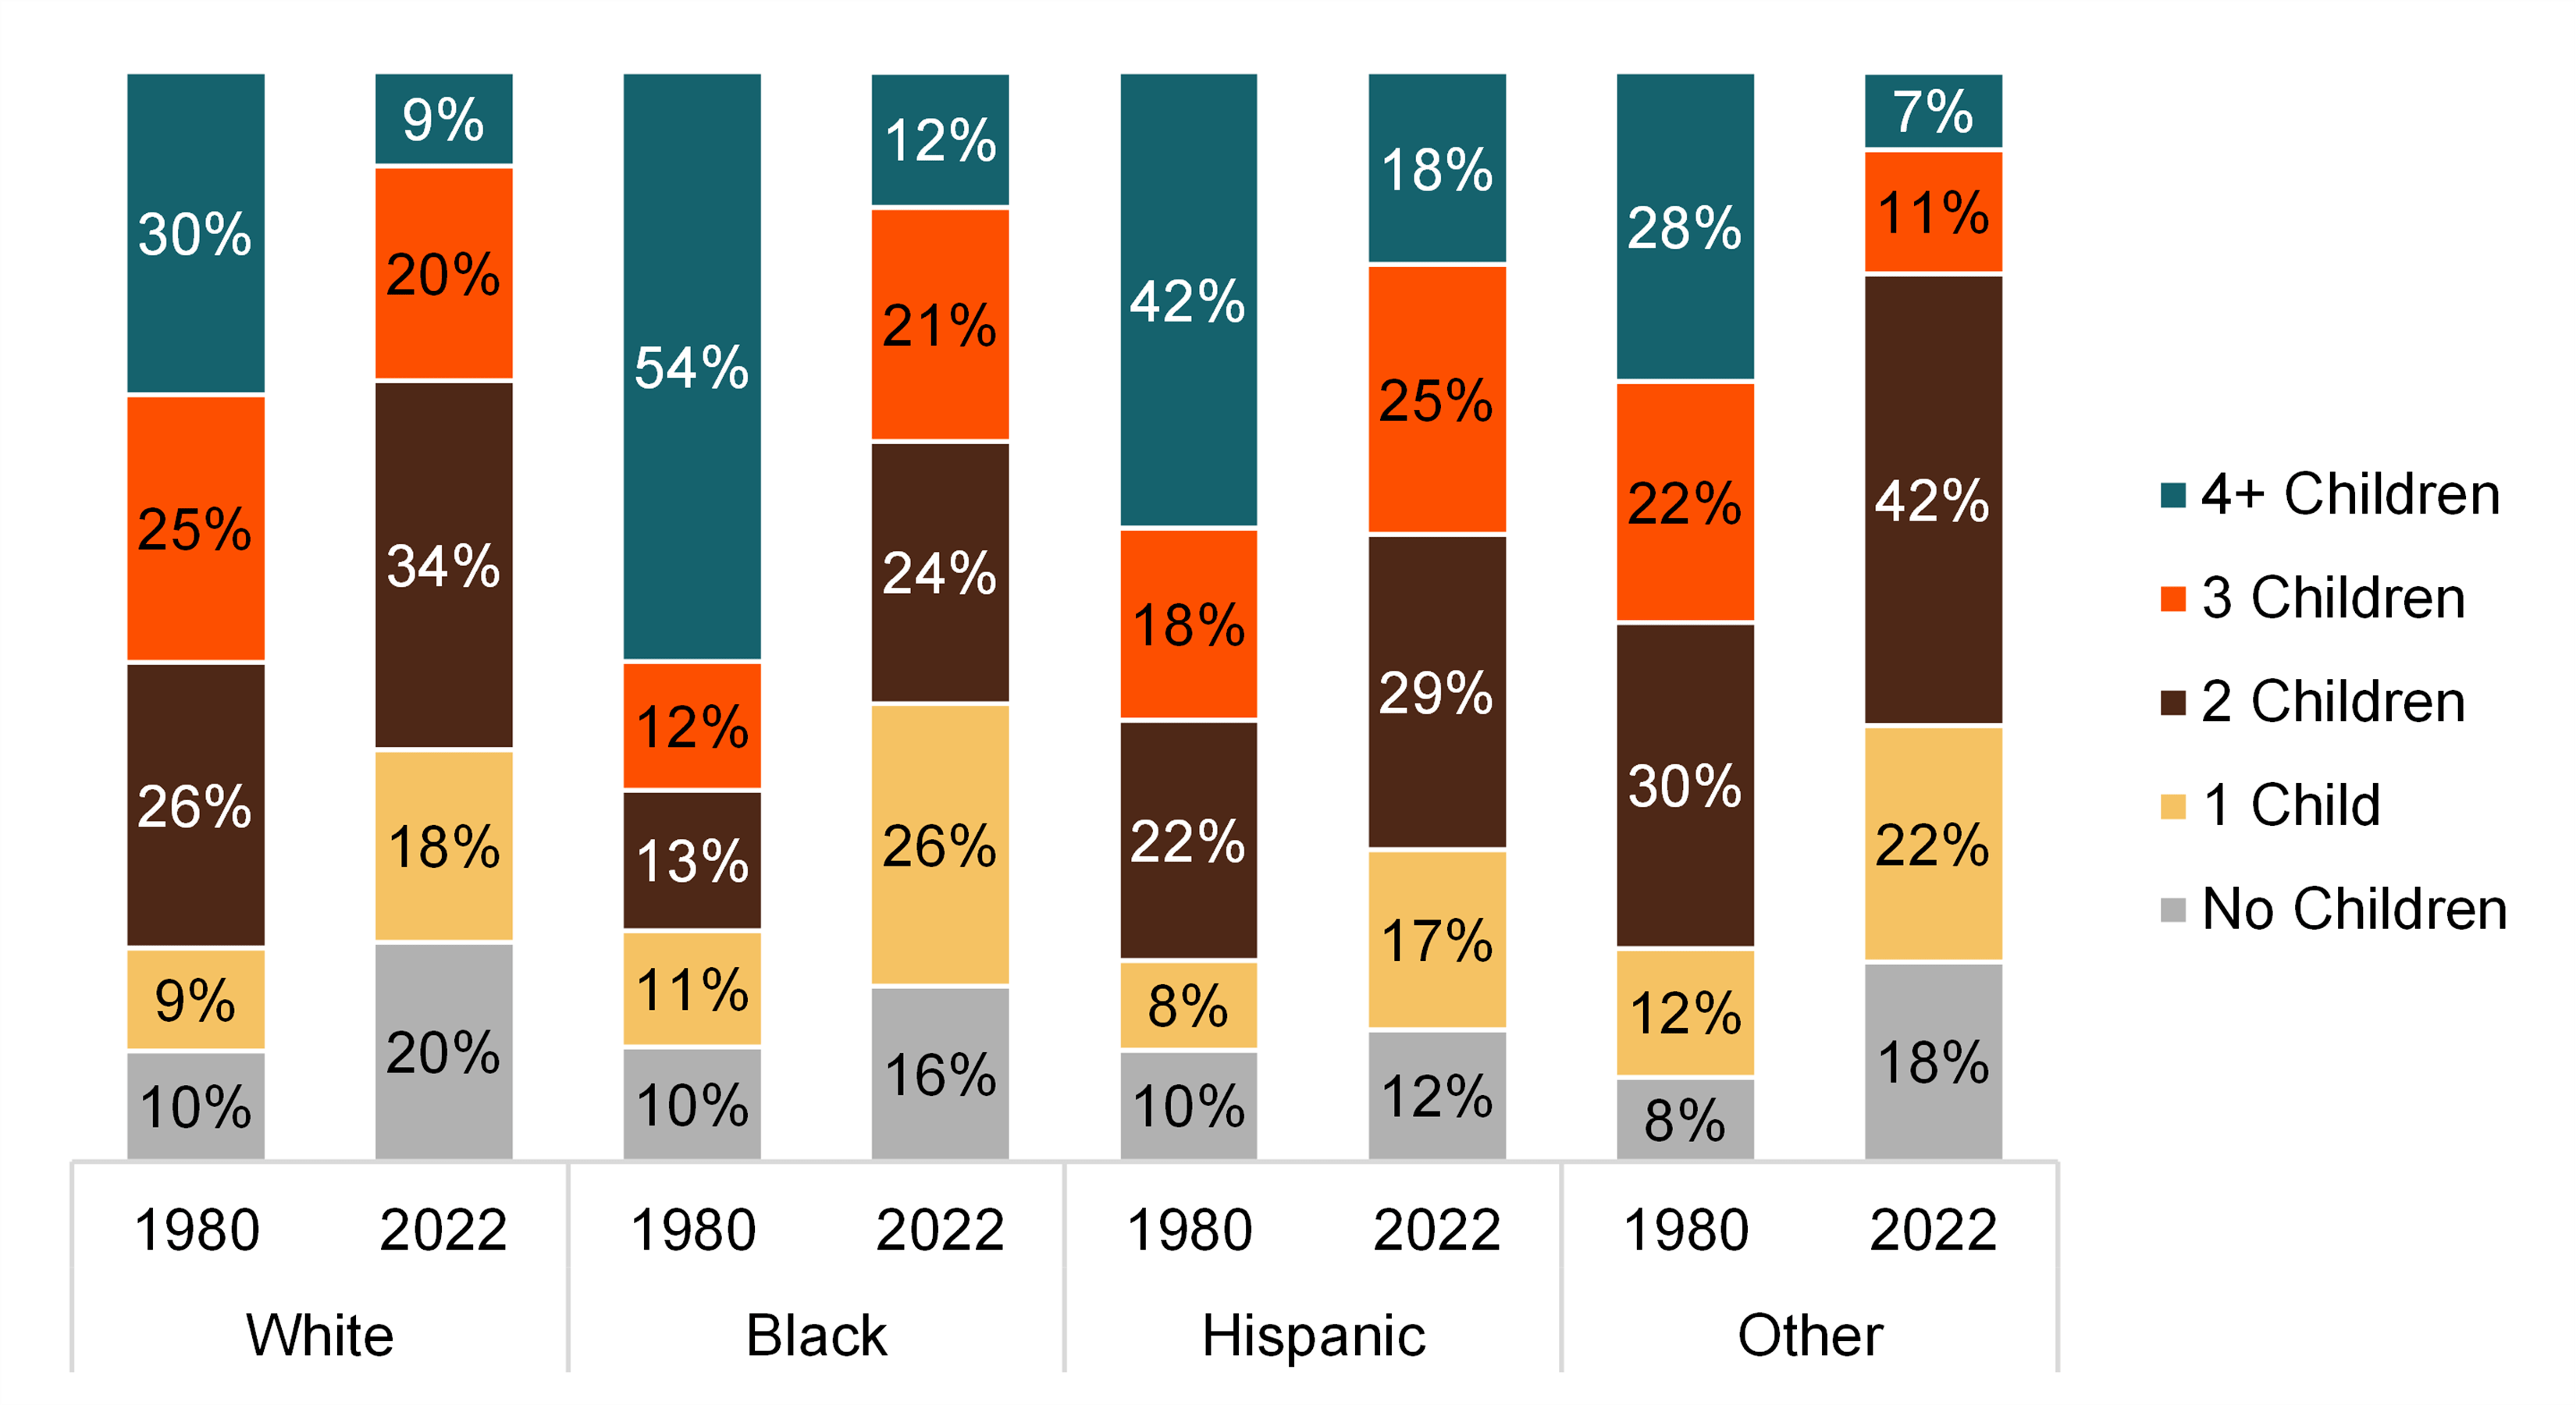
In general, all racial-ethnic groups considered here experienced declines in large families (4+ children) and growth in childlessness between 1980 and 2022. In 1980, the mean number of children was highest among Black women (4.07), followed by Hispanic women (3.18), women in the “Other” category (3.04), and White women (2.81), not shown. By 2022, the range had narrowed, with the highest mean number of children among Hispanic women (2.26), followed by Black (1.94), White (1.83), and women in the “Other” category (1.68).
- Childlessness increased substantially across most groups from 1980 to 2022. The growth in childlessness was smallest among Hispanic women, among whom only 12% were childless in 2022.
- Growing shares of women aged 4-44 had only one child from 1980 to 2022 across all groups. In 2022, the greatest share having one child occurred among Black women, for whom it was the most common completed family size.
- All groups experienced increases in the share having two children; in 2022, it was the modal category for all groups, except for Black women.
- The percentage with three children rose for Black and Hispanic women. Conversely, among White women, the level declined.
- Large families—those with four or more children—declined dramatically across all groups.
Figure 2. Number of Children to Women Aged 40-44 by Race/Ethnicity, 1980 & 2022

Trends in the Distribution of Children Ever Born by Educational Attainment
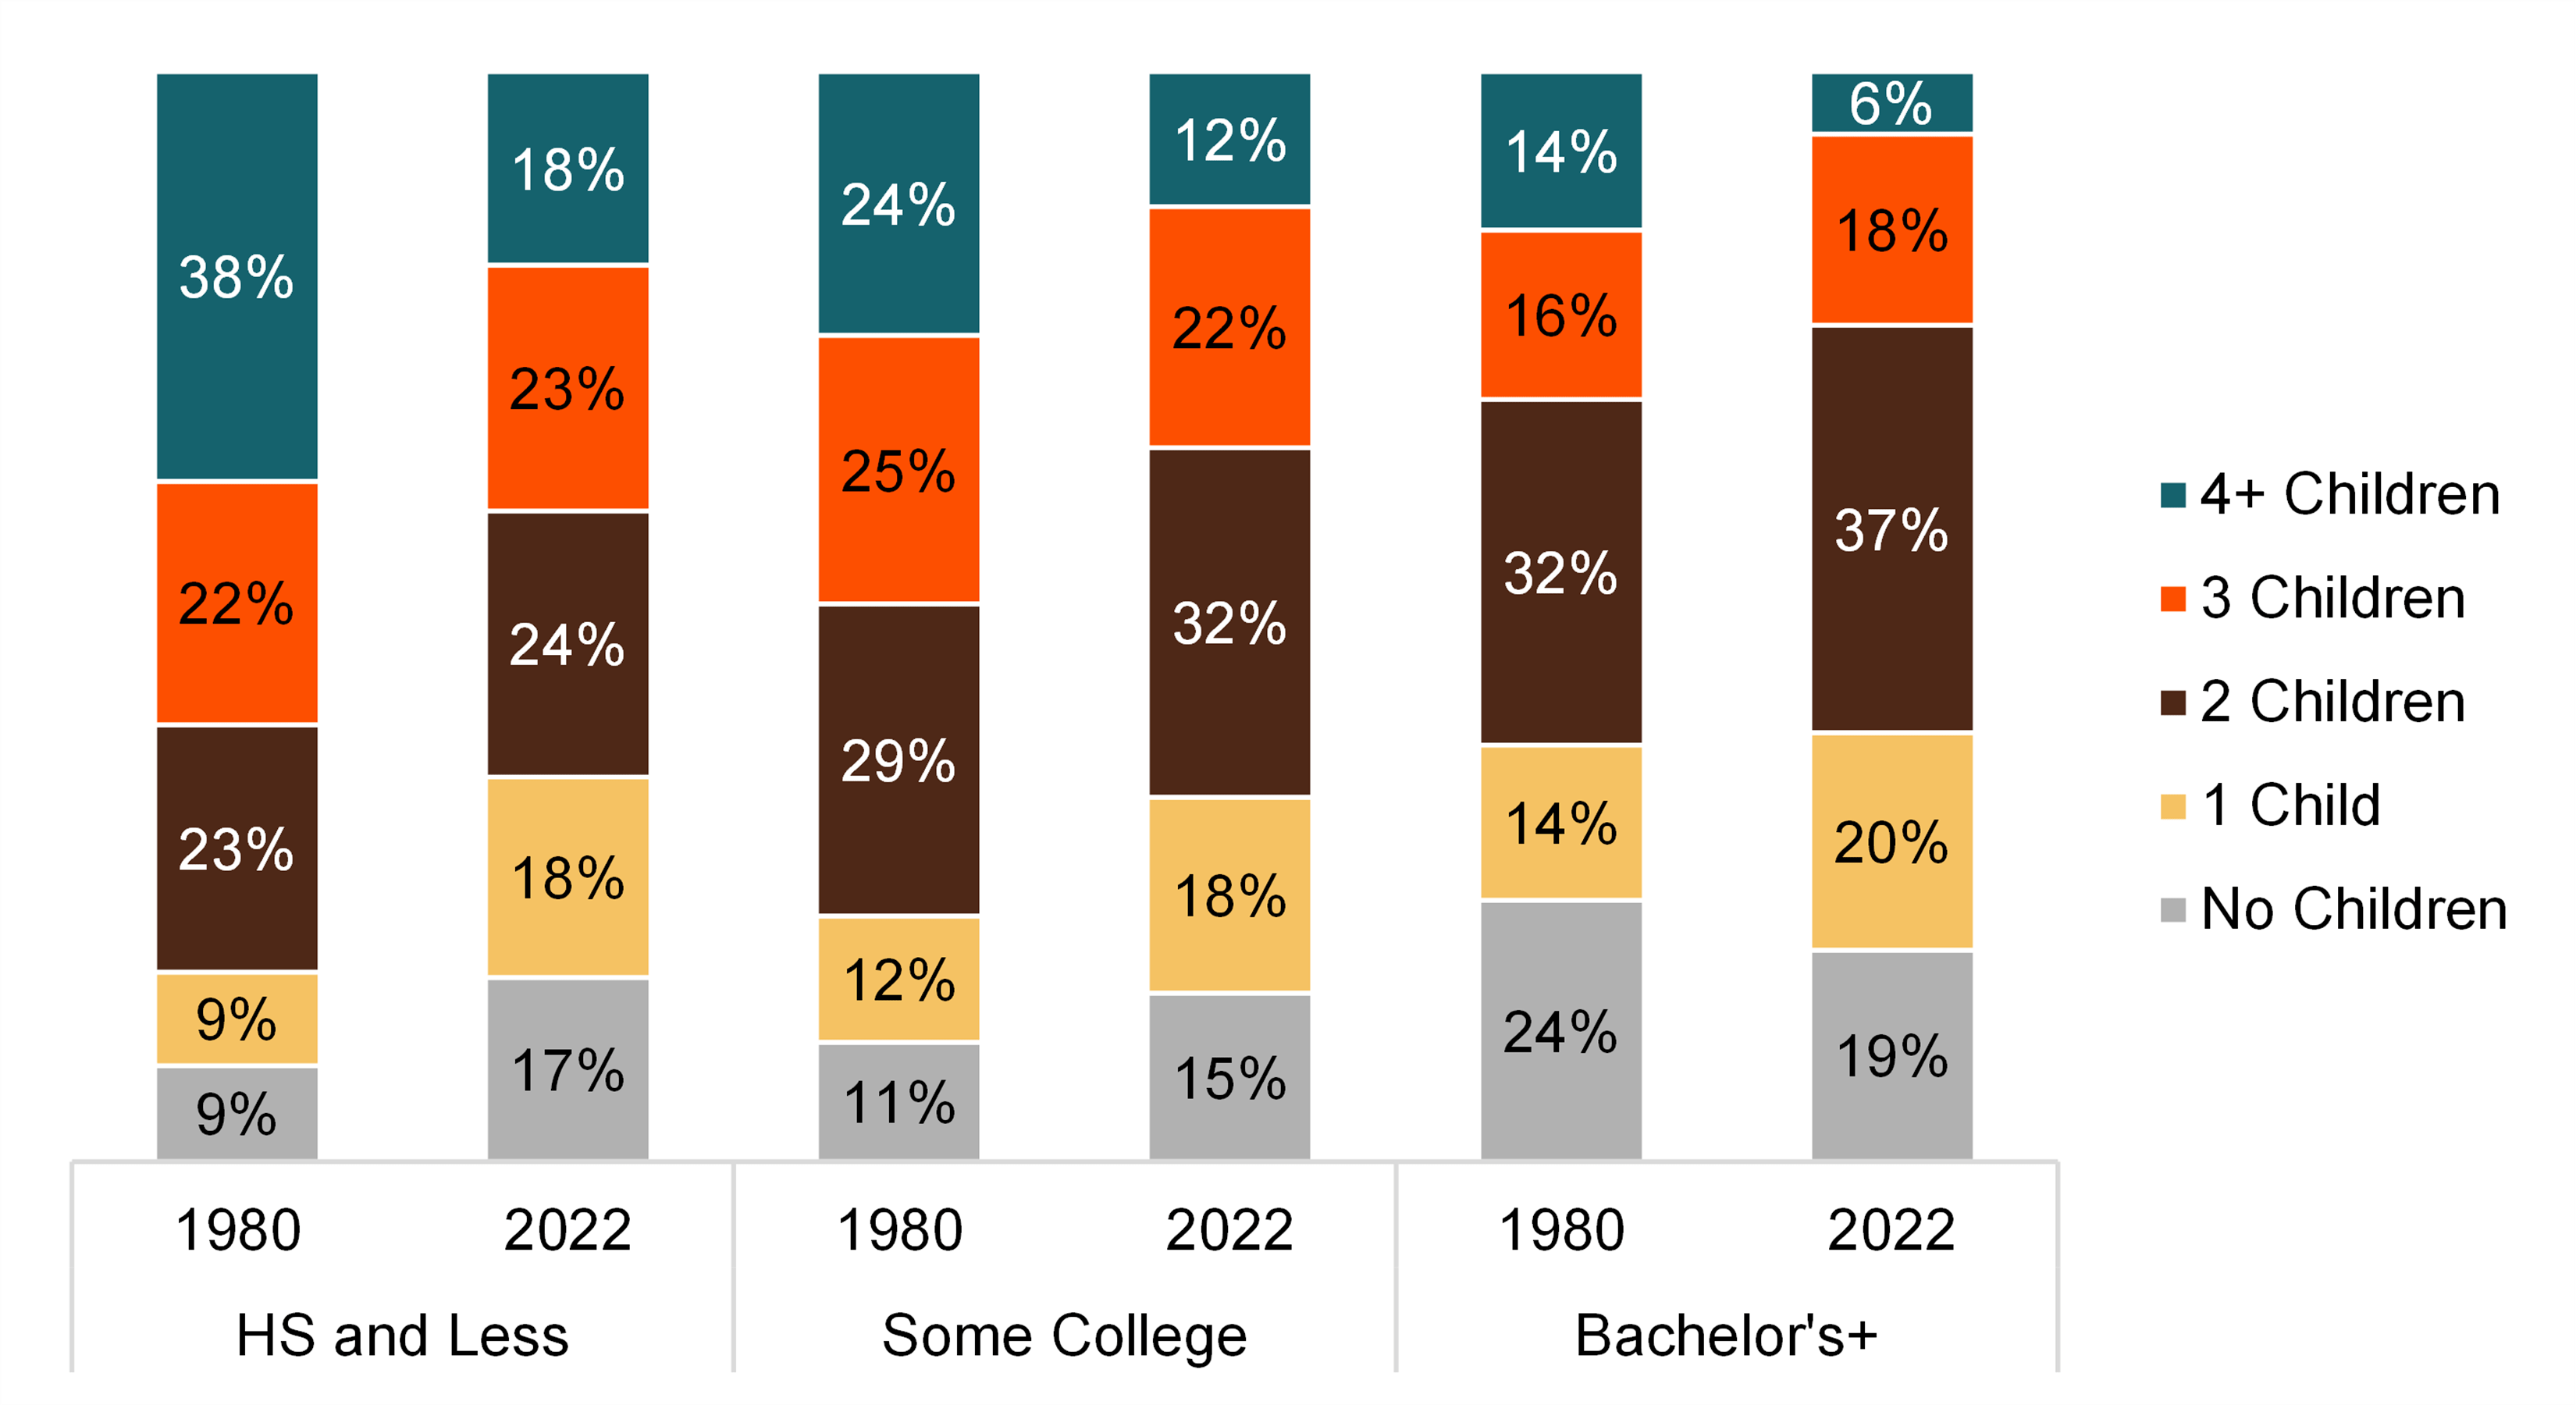
Trends in completed family size varied slightly by educational attainment. In 1980, women aged 40-44 with a bachelor’s degree or more had the lowest, at 2.20, and women with a high school degree or less had the highest, at 3.19 (not shown). The same order persisted in 2022 but in a narrower range, with those with a bachelor’s degree having a mean of 1.72 children and those with a high school degree or less having 2.14 children on average.
- Women with a bachelor’s degree or higher were the only group to experience a decrease in childlessness from 1980 (24%) to 2022 (19%).
- The percentage among those with a high school degree or less who had only one child doubled from 9% in 1980 to 18% in 2022. A much smaller increase in the share having one child among women aged 40-44 was experienced by those with some college and with bachelor’s degree.
- By 2022, the modal number of children ever born was two across all education categories.
- In 1980, women with a high school education or less most commonly had four or more children (38%), but this percentage was more than halved by 2022 (18%). A similar pattern is observed for women with some college and a bachelor’s degree.
Figure 3. Number of Children to Women Aged 40-44 by Education, 1980 & 2022

Data Source:
Flood, S., King, M., Rodgers, R., Ruggles, S., Warren, J. R., Backman, D., Chen A., Cooper, G., Richards, S., Schouweiler, M., & Westberry, M. (2023). Integrated Public Use Microdata Series, Current Population Survey: Version 11.0 [dataset]. Minneapolis, MN: IPUMS. https://doi.org/10.18128/D030.V11.0
References:
Guzzo, K. B. & Schweizer, V. (2020). Number of Children to Women Aged 40-44, 1980-2018. Family Profiles, FP-20-04. Bowling Green, OH: National Center for Family & Marriage Research. https://doi.org/10.25035/ncfmr/fp-20-04
Osterman, M. J. K., Hamilton, B. E., Martin, J. A., Driscoll, A. K., & Valenzuela, C. P. (2023). Births: Final data for 2021. National Vital Statistics Reports: From the Centers for Disease Control and Prevention, National Center for Health Statistics, National Vital Statistics System, 72(1), 1–53.
Suggested Citation:
Guzzo, K. B. & Loo, J. (2023). Number of Children Ever Born to Women Aged 40-44, 1980-2022. Family Profiles, FP-23-29. Bowling Green, OH: National Center for Family & Marriage Research. https://doi.org/10.25035/ncfmr/fp-23-29
Updated: 11/07/2025 03:53PM


