Fatherhood in the U.S.: Number of Children, 1987-2017
Family Profile No. 29, 2019
Author: Valerie Schweizer
On average, American adults generally have had around two children (Livingston, 2019) near the end of their childbearing years. This number varies, however, by both gender and other sociodemographic characteristics such as race and educational attainment (FP-11-10). In this profile, we use data from the National Survey of Family Growth (2002, 2006-2010, 2011-2013, and 2015-2017) to investigate the average number of children among men aged 40 to 44 near the end of the childbearing years. First, we examine the 30-year trend in men’s (and women’s) average number of children, then use the latest available data (2015-2017) to examine the average number of children across race/ethnicity and education.
Average Number of Children, Men & Women Aged 40-44
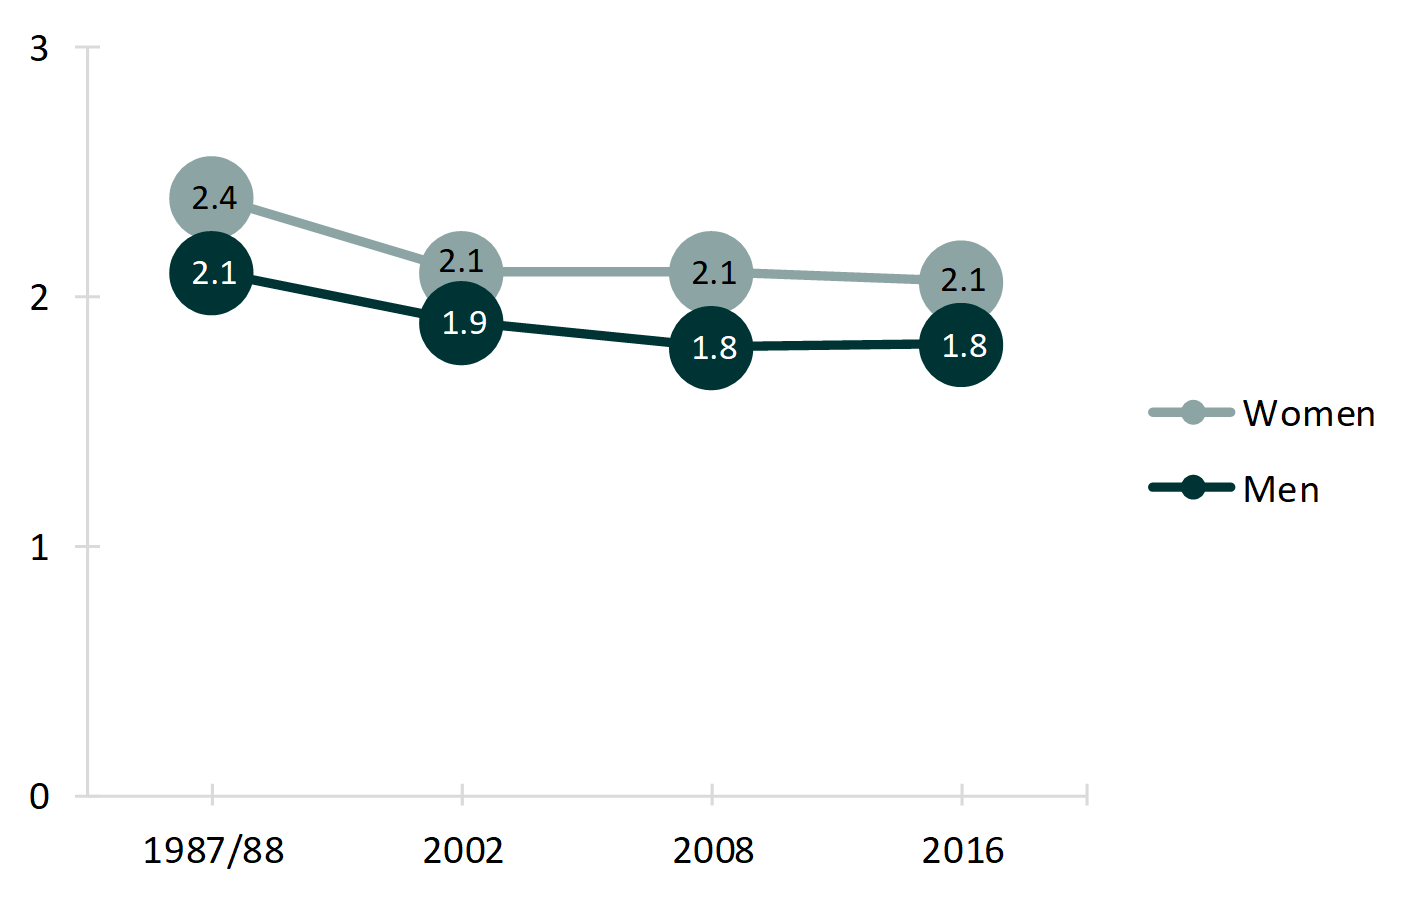
- Since 1987/1988 there has been a small decline in the average number of children for both men and women aged 40-44. In 2016, men reported having 1.8 children and women 2.1 children. Thus, among those aged 40-44, men and women are having about 0.3 fewer children now than in 1987/1988.
- On average, women aged 40-44 report slightly more children than men, likely because more men than women continue to have children in their late 40s or older.
- Men in their early-to-mid 40s are more often childless today than 30 years ago. In 1987/1988, 15% of men were childless. In 2016, almost one-quarter (23%) of men 40-44 reported having no children.
Figure 1. Mean Number of Children for Men and Women in the U.S. Aged 40-44, 1987-2016

Race/Ethnicity
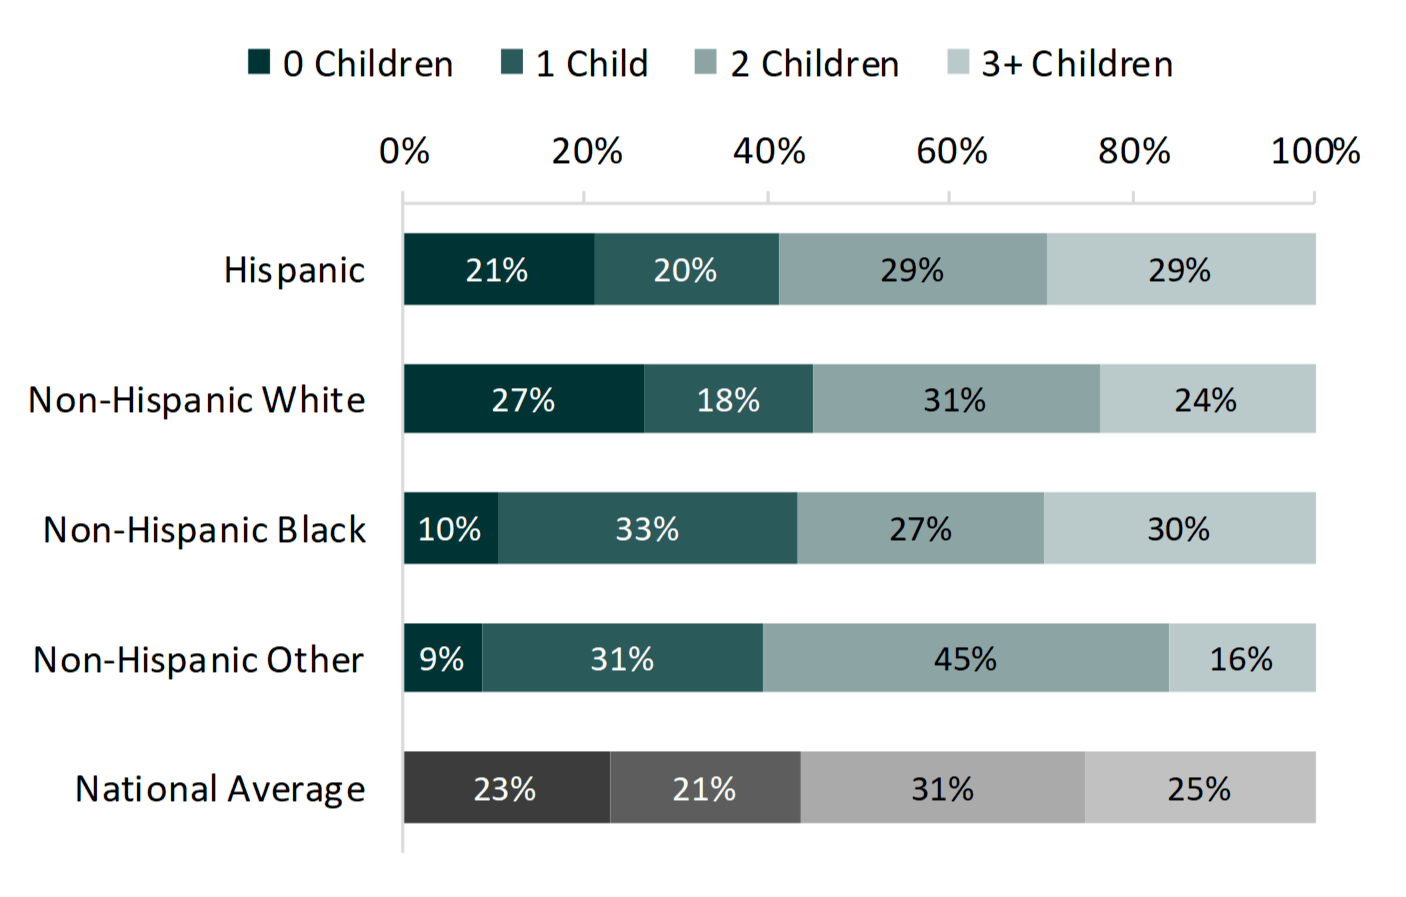
- On average, Black men aged 40-44 report having more children (2.2) than Hispanic (1.9), White (1.7), and Other (1.8) race men aged 40-44.
- Approximately 27% of White men in their early-to-mid 40s are childless compared to 10% of Black men, 21% of Hispanic men, and 9% of Other race men.
- By ages 40-44, other race men have the highest proportion of having two children (45%) followed by White men (31%).
- By ages 40-44, Black men have the highest proportion of having three or more children (30%), similar to Hispanic men (29%).
Figure 2. Number of Children by Race/Ethnicity Among Men Aged 40-44, 2016

Education
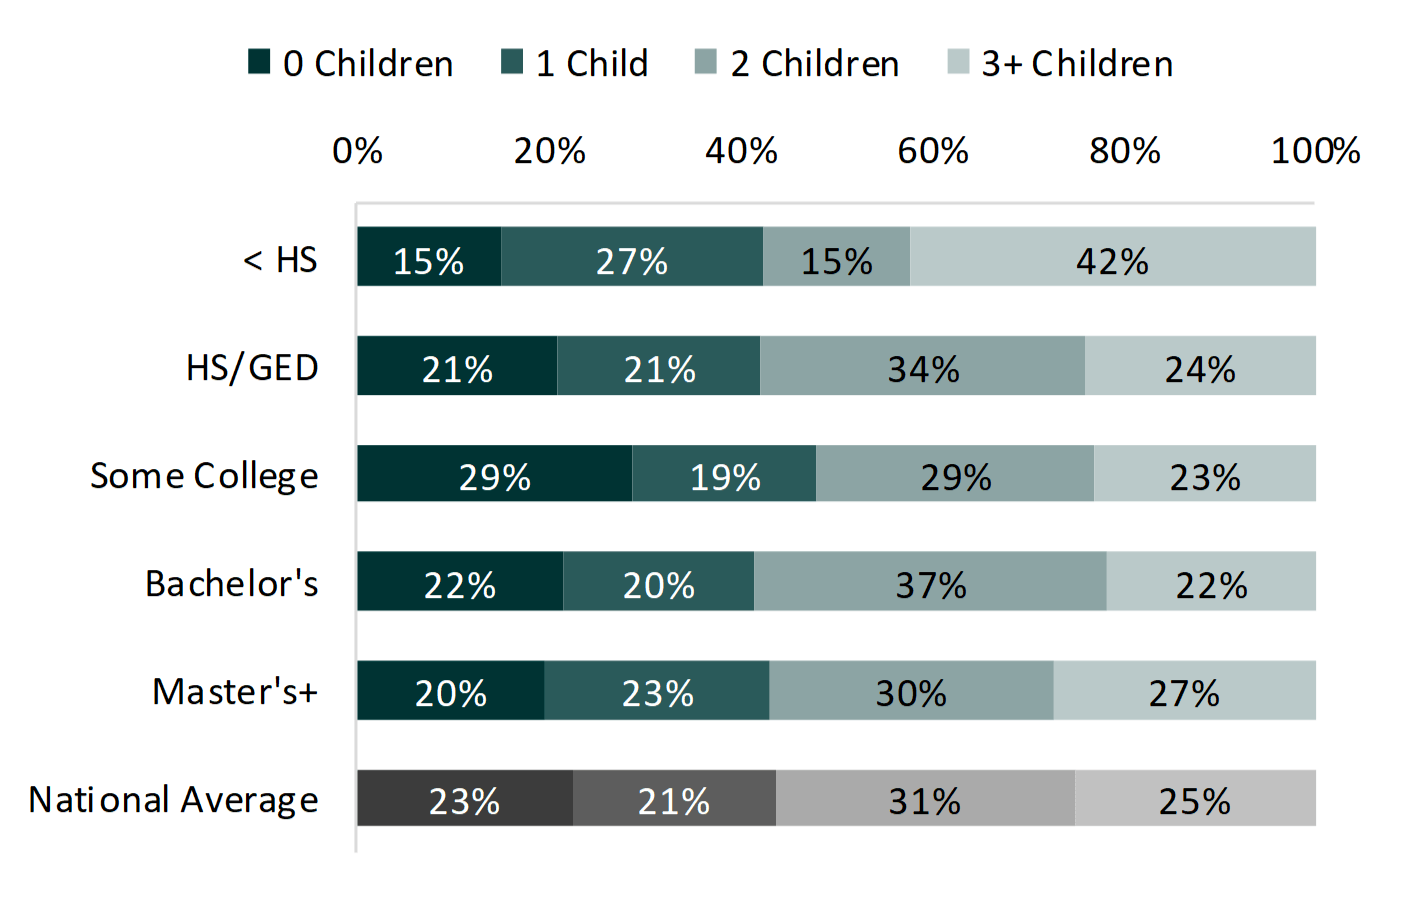
- Among men aged 40-44, the modal number of children is two for all education levels except those without a high school degree or equivalency.
- Men without a high school degree report the highest average number of children (2.4 children, not shown), and the modal category is three or more children (42%).
- Childlessness among men in their early- to-mid 40s is most common among those with some college at over one-quarter.
- Men with a bachelor’s degree or some college have the lowest proportions with three or more children (22% and 23%, respectively).
Figure 3. Number of Children by Education Among Men Aged 40-44, 2016


"Men in their early-to-mid 40s are more often childless today than 30 years ago."

References
- Livingston, G. (2019). Is U.S. fertility at an all-time low? Two of three measures point to yes. Pew Research Center. https://www.pewresearch.org/fact-tank/2019/05/22/u-s-fertility-rate-explained/
- Stykes, J. (2011). Fatherhood in the U.S.: Number of Children, 1987-2010. Family Profiles, FP-11-10. National Center for Family & Marriage Research.
Suggested Citation
- Schweizer, V. J. (2019). Fatherhood in the U.S.: Number of Children, 1987-2017. Family Profiles, FP-19-29. Bowling Green, OH: National Center for Family and Marriage Research. https://doi.org/10.25035/ncfmr/fp-19-29
Updated: 11/07/2025 03:31PM

