Marriages to Same-Sex and Different-Sex Couples: 2019 & 2021
Family Profile No. 09, 2023
Authors: Krista K. Westrick-Payne and Wendy D. Manning
Marriages to same-sex couples were declared legal in all states by the U.S. Supreme Court in 2015. Starting in 2019 the US Census Bureau included a revised household roster in the American Community Survey (ACS) that directly counts same-sex and different-sex married and cohabiting couples. We rely on data from the ACS 1-year PUMS files from 2019 and 2021 to provide the most recent ACS estimates of changing numbers of individuals entering a same-sex marriage. We compare same-sex newlyweds to different-sex newlyweds based on the couples’ marital history, age, and education. Analyses are limited to householders and spouses of householders. Note that although the terms “sex” and “gender” are not interchangeable, because the ACS survey questionnaire uses the term “sex,” we have opted to do so as well. Check out the NCFMR profiles by topic “LGBTQ+ Relationships” for more resources on LGBTQ+ individuals and couples, Kamp Dush and Manning (2021) for marriage rates to same-sex couples and Julian et al. (2022) for changes in marriages to same-sex and different-sex couples during the pandemic.
Marriages in the Last Year
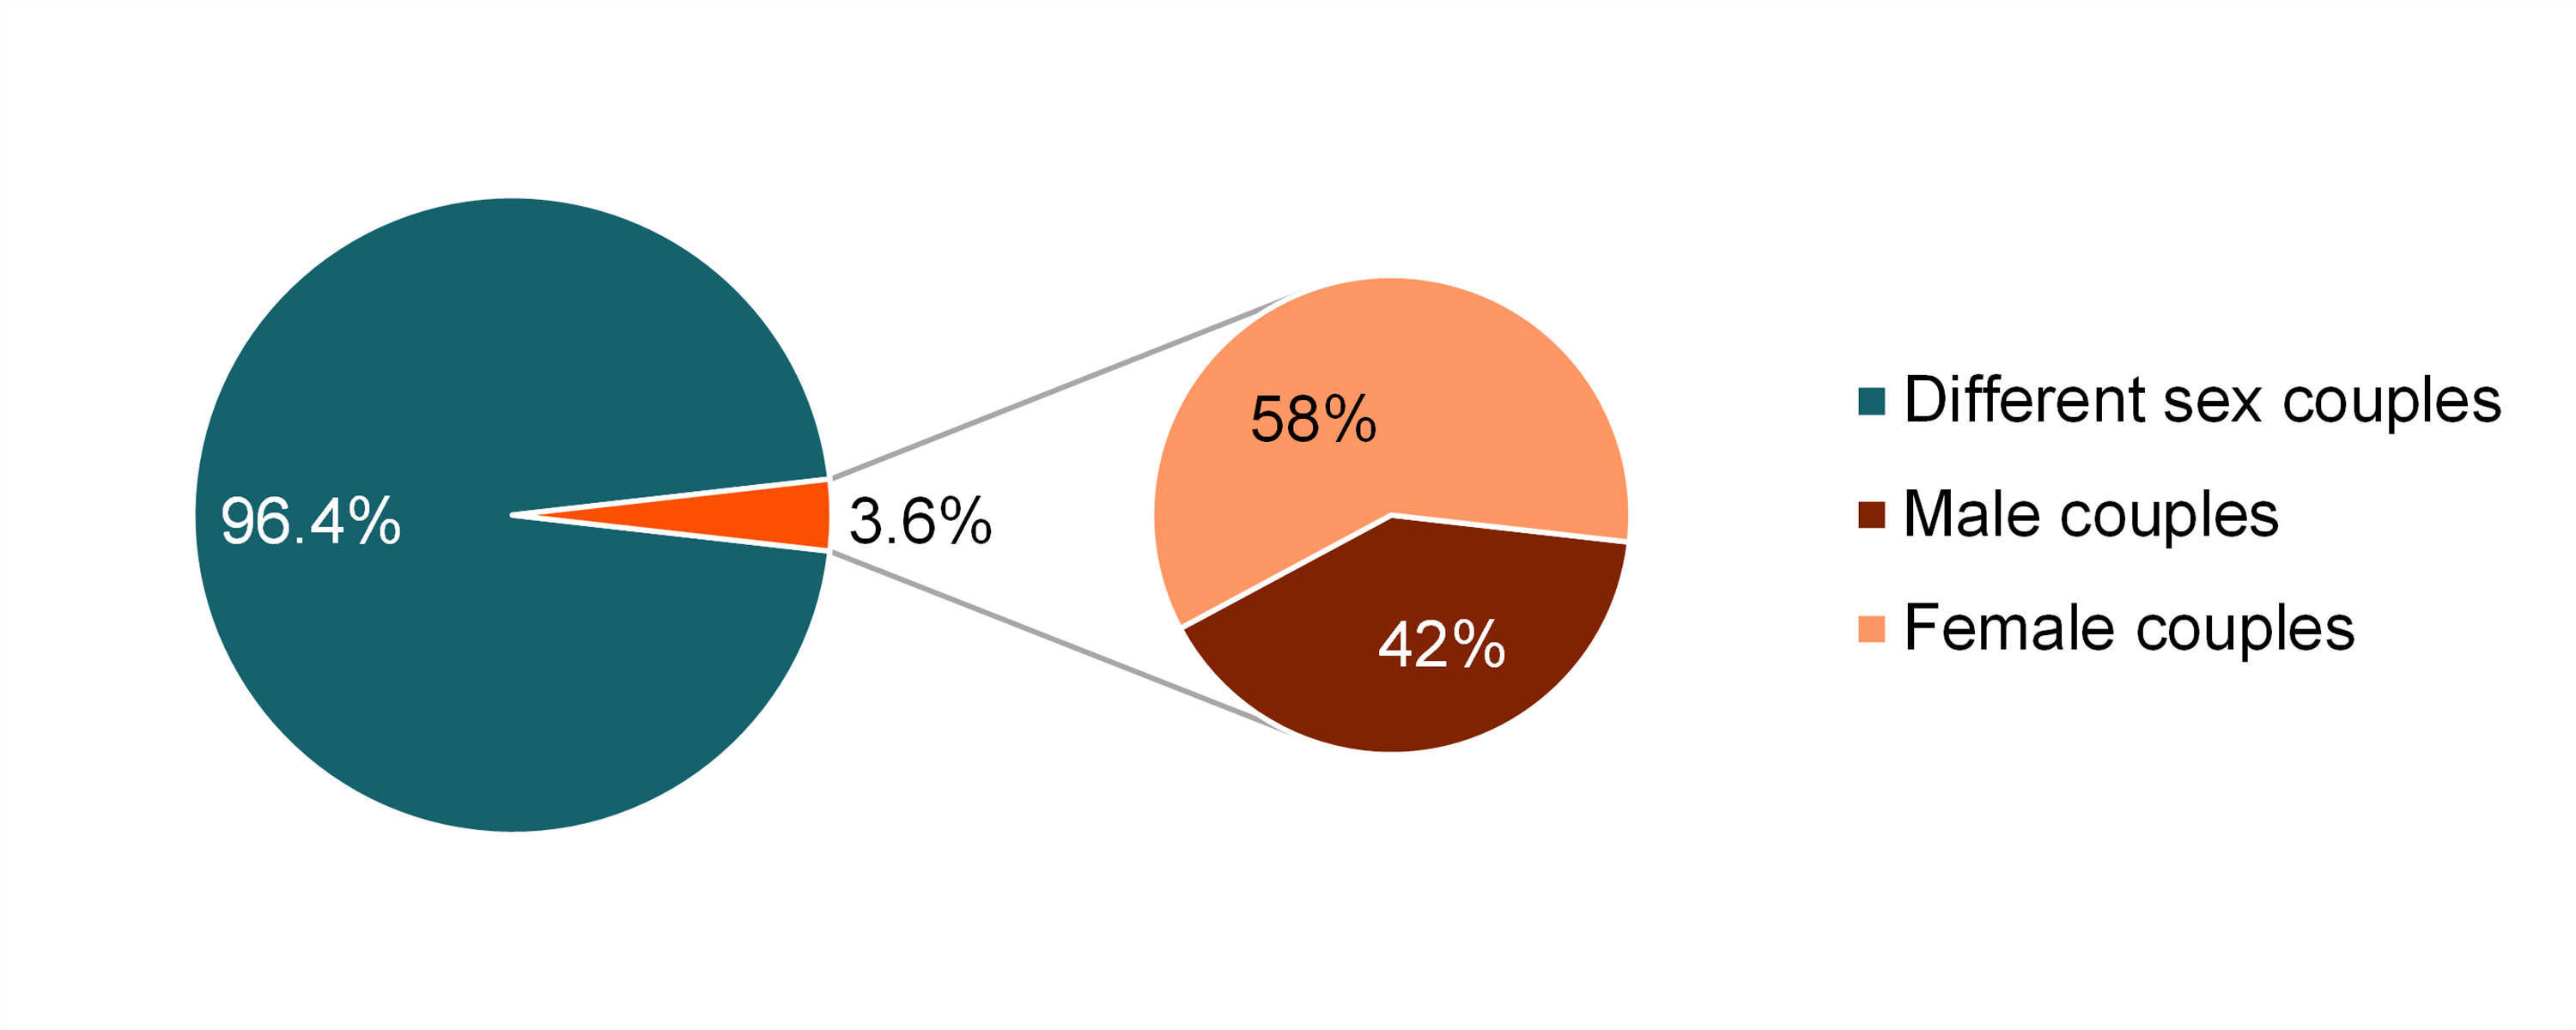
- In 2021 there were 60,046 marriages to same-sex couples representing 3.6% of all marriages.
- Nearly 4 out of 100 marriages in the U.S. in 2021 were to same-sex couples. A slightly greater share was to female couples (58%) than male couples (42%).
Figure 1. Sex Composition of Recently Married Couples, 2021

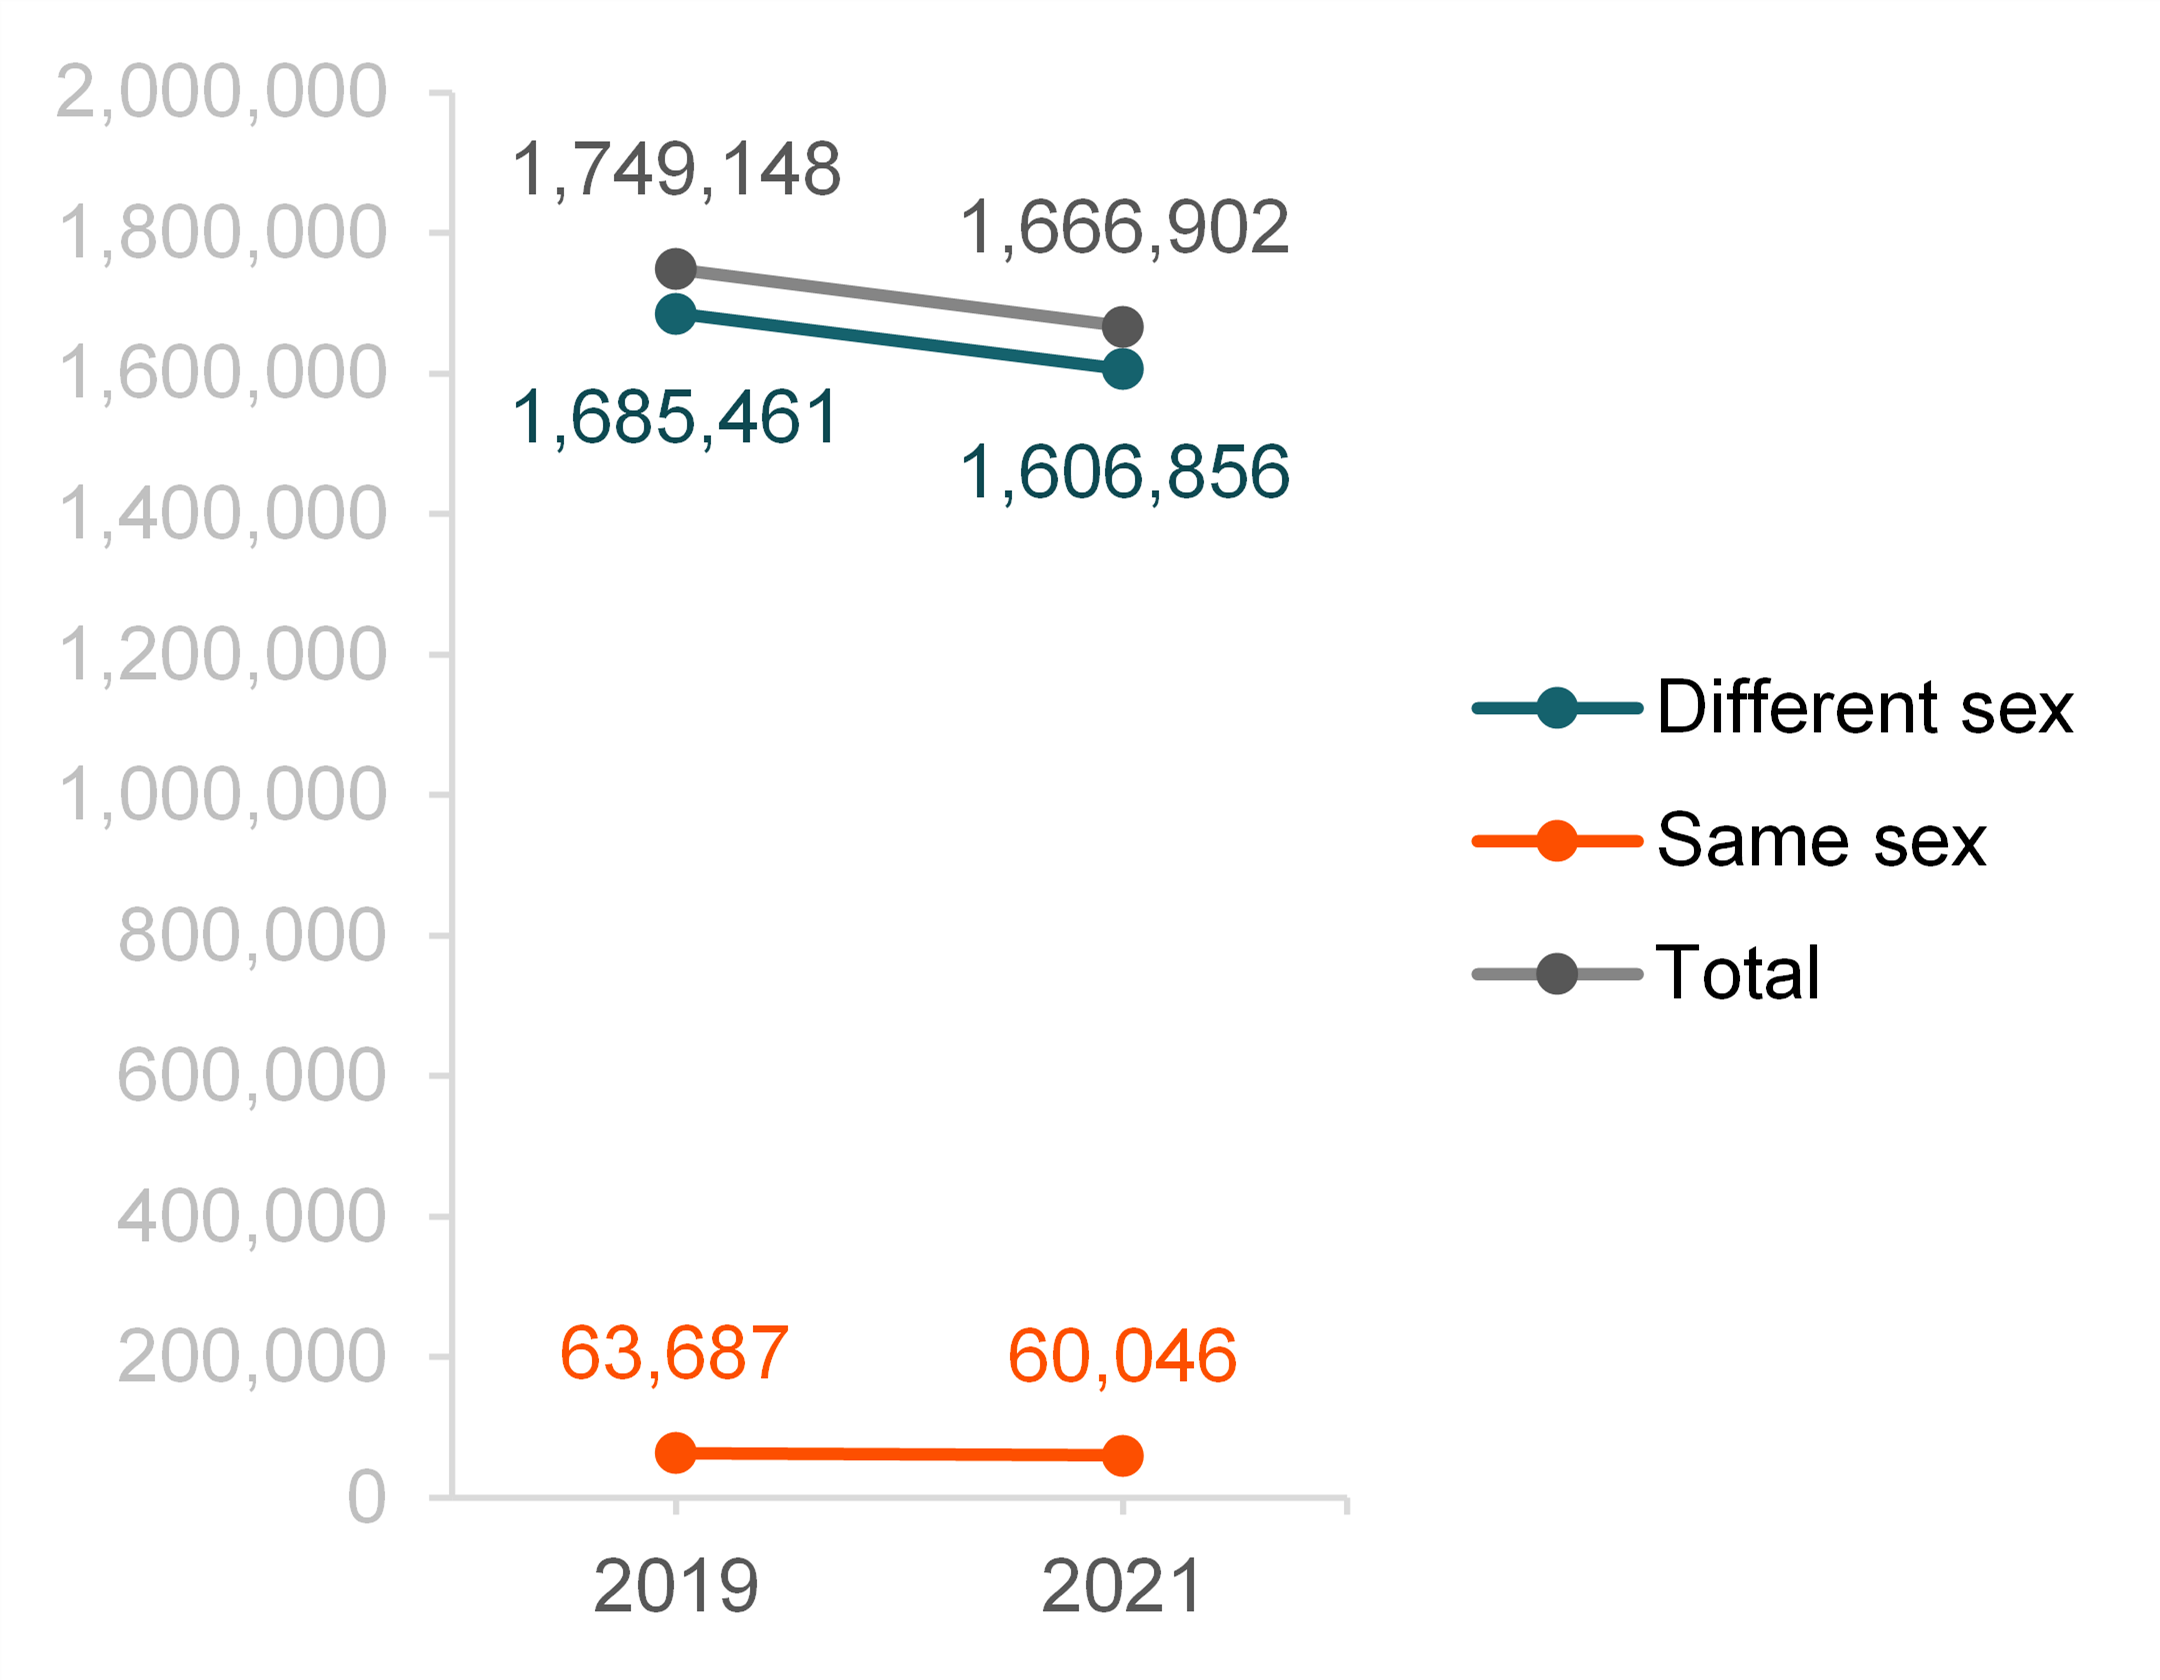
- Overall, there was a decline in the number of marriages between 2019 and 2021—there was not a pandemic marriage recovery in 2021 (Westrick-Payne 2022).
- Prior to the pandemic in 2019, there were an estimated 1,685,461 marriages to different-sex couples declining to 1,606,856 in 2021.
- Marriages to same-sex couples also declined from 63,687 in 2019 to 60,046 in 2021.
- Based on chi-square tests, the pattern of declines in marriages was similar for different-sex and same-sex couples (result not shown).
Figure 2. Change in the number of marriages in the last year by couple sex composition, 2019 & 2021[1]

[1] Among currently married couples, on average different sex couples have been married longer than couples of the same sex—25 years versus 10 years. In other words, a larger share of currently married couples of the same sex are in more recent marriages compared to couples of different sexes.
Marital History Among Couples Who Married in the Last Year
- About two-thirds of marriages in 2021 were to couples who were both entering marriage for the first time (Figure 3) (69% of sex-sex couples and 65% of different-sex couples).
- In 6% of same-sex couples married in 2021 both members of the couple had been previously married and in 25% only one member of the couple had been previously married.
- Nearly one-fifth (19%) of different-sex couples who married in 2021 included one person who had been previously married and in 16% both members of the couple had been previously married.
Figure 3. Marital history among different- and same-sex couples who married in the last year, 2021


Age at Marriage Among Couples Who Married in the Last Year
- The age at first marriage continues to rise in the U.S. (Julian 2022). The age at marriage for same-sex couples is slightly older than for different-sex couples and there is a larger age gap between spouses (Westrick-Payne and Manning 2021).
- In two-fifths (40%) of marriages to same-sex couples the younger member of the couple was under age 30 and in about half (49%) of marriages to different-sex couples the younger of the newlyweds was under age 30.
- Same-sex couples who married in 2021 more often included someone over the age of 40 than different-sex couples (29% vs. 22%).
Figure 4. Age at marriage among different- and same-sex couples who married in the last year, 2021


Educational Attainment Among Couples Who Married in the Last Year
- Same-sex couples who married in 2021 had higher levels of educational attainment than their different-sex counterparts.
- In over three out of five (63%) same-sex couples who married in 2021 one member of the couple had a college degree in contrast to 55% of different-sex couples who married in 2021.
Figure 5. Educational attainment among different- and same-sex couples who married in the last year, 2021


Data Source:
Ruggles, S. Flood, S., Foster, S., Goeken, R., Pacas, J., Schouweiler, M., & Sobek, M. (2021). IPUMS USA: Version 11.0 [dataset]. Minneapolis, MN: IPUMS. https://doi.org/10.18128/D010.V11.0
References:
Julian, C. A., Manning, W. D., Westrick-Payne, K, K, Carlson, L (2022). Prepandemic and pandemic marriages among same-sex and different-sex couples. Socius: Sociological Research for a Dynamic World, 8. https://doi.org/10.1177/23780231221135968
Julian, C. A. (2022). Median age at first marriage, 2021. Family Profiles, FP-22-15. Bowling Green, OH: National Center for Family & Marriage Research. https://doi.org/10.25035/ncfmr/fp-22-15
Kamp Dush, C. & Manning, W. D. (2022). Population perspectives on marriage among same-sex couples in the US: Rates and predictors of same-sex unions. In Aaron Hoy (Eds.), The social science of same-sex marriage: LGBT people and their relationships in the era of marriage equality. Routledge. https://doi.org/10.4324/9781003089995
Westrick-Payne, K. K. (2022). Charting marriage & divorce in the U.S.: The adjusted marriage rate, 2008-2021. Bowling Green, OH: National Center for Family & Marriage Research.
Suggested Citation:
Westrick-Payne, K. K. & Manning, W. D. (2023). Marriages to same-sex and different-sex couples: 2019 & 2021. Family Profiles, FP-22-09. Bowling Green, OH: National Center for Family & Marriage Research. https://doi.org/10.25035/ncfmr/fp-23-09
Updated: 11/12/2025 10:05AM

