Marriage, Divorce, and the COVID-19 Pandemic in the U.S.
Family Profile No. 12, 2022
Authors: Krista Westrick-Payne & Wendy D. Manning
This Profile examines marriage and divorce in the years preceding and following the first year of the COVID-19 Pandemic. Using administrative data from the National Center for Health Statistics, and survey estimates from the U.S. Census Bureau and IPUMS-USA, we deconstruct state-level crude marriage and divorce rates (rates per 1,000 total population) and compute adjusted rates (rates per 1,000 women eligible for a marriage or a divorce) for the years 2010 through 2020. Then, using a demographic technique like that employed to quantify excess mortality, we estimate p-scores between the expected number of marriages and divorces for 2020 and the number observed. The expected 2020 marital events are based on the percent change in the respective observed number by state between 2018 and 2019. To see our other work examining these evolving trends, take a look at the following data visualizations:
- Manning, W. D. & Payne, K. K. (2021). Marriage and divorce during the COVID-19 Pandemic: A case study of five states. Socius: Sociological Research for a Dynamic World, 7, 1-3. https://doi.org/10.1177/23780231211006976
- Westrick-Payne, K. K., Manning, W. D., & Carlson, L. (2022). Pandemic shortfall in Marriages and divorces in the United States. Socius: Sociological Research for a Dynamic World, 8, 1-3. https://doi.org/10.1177/23780231221090192
Marriage and Divorce Before the Pandemic
The Adjusted Marriage Rate
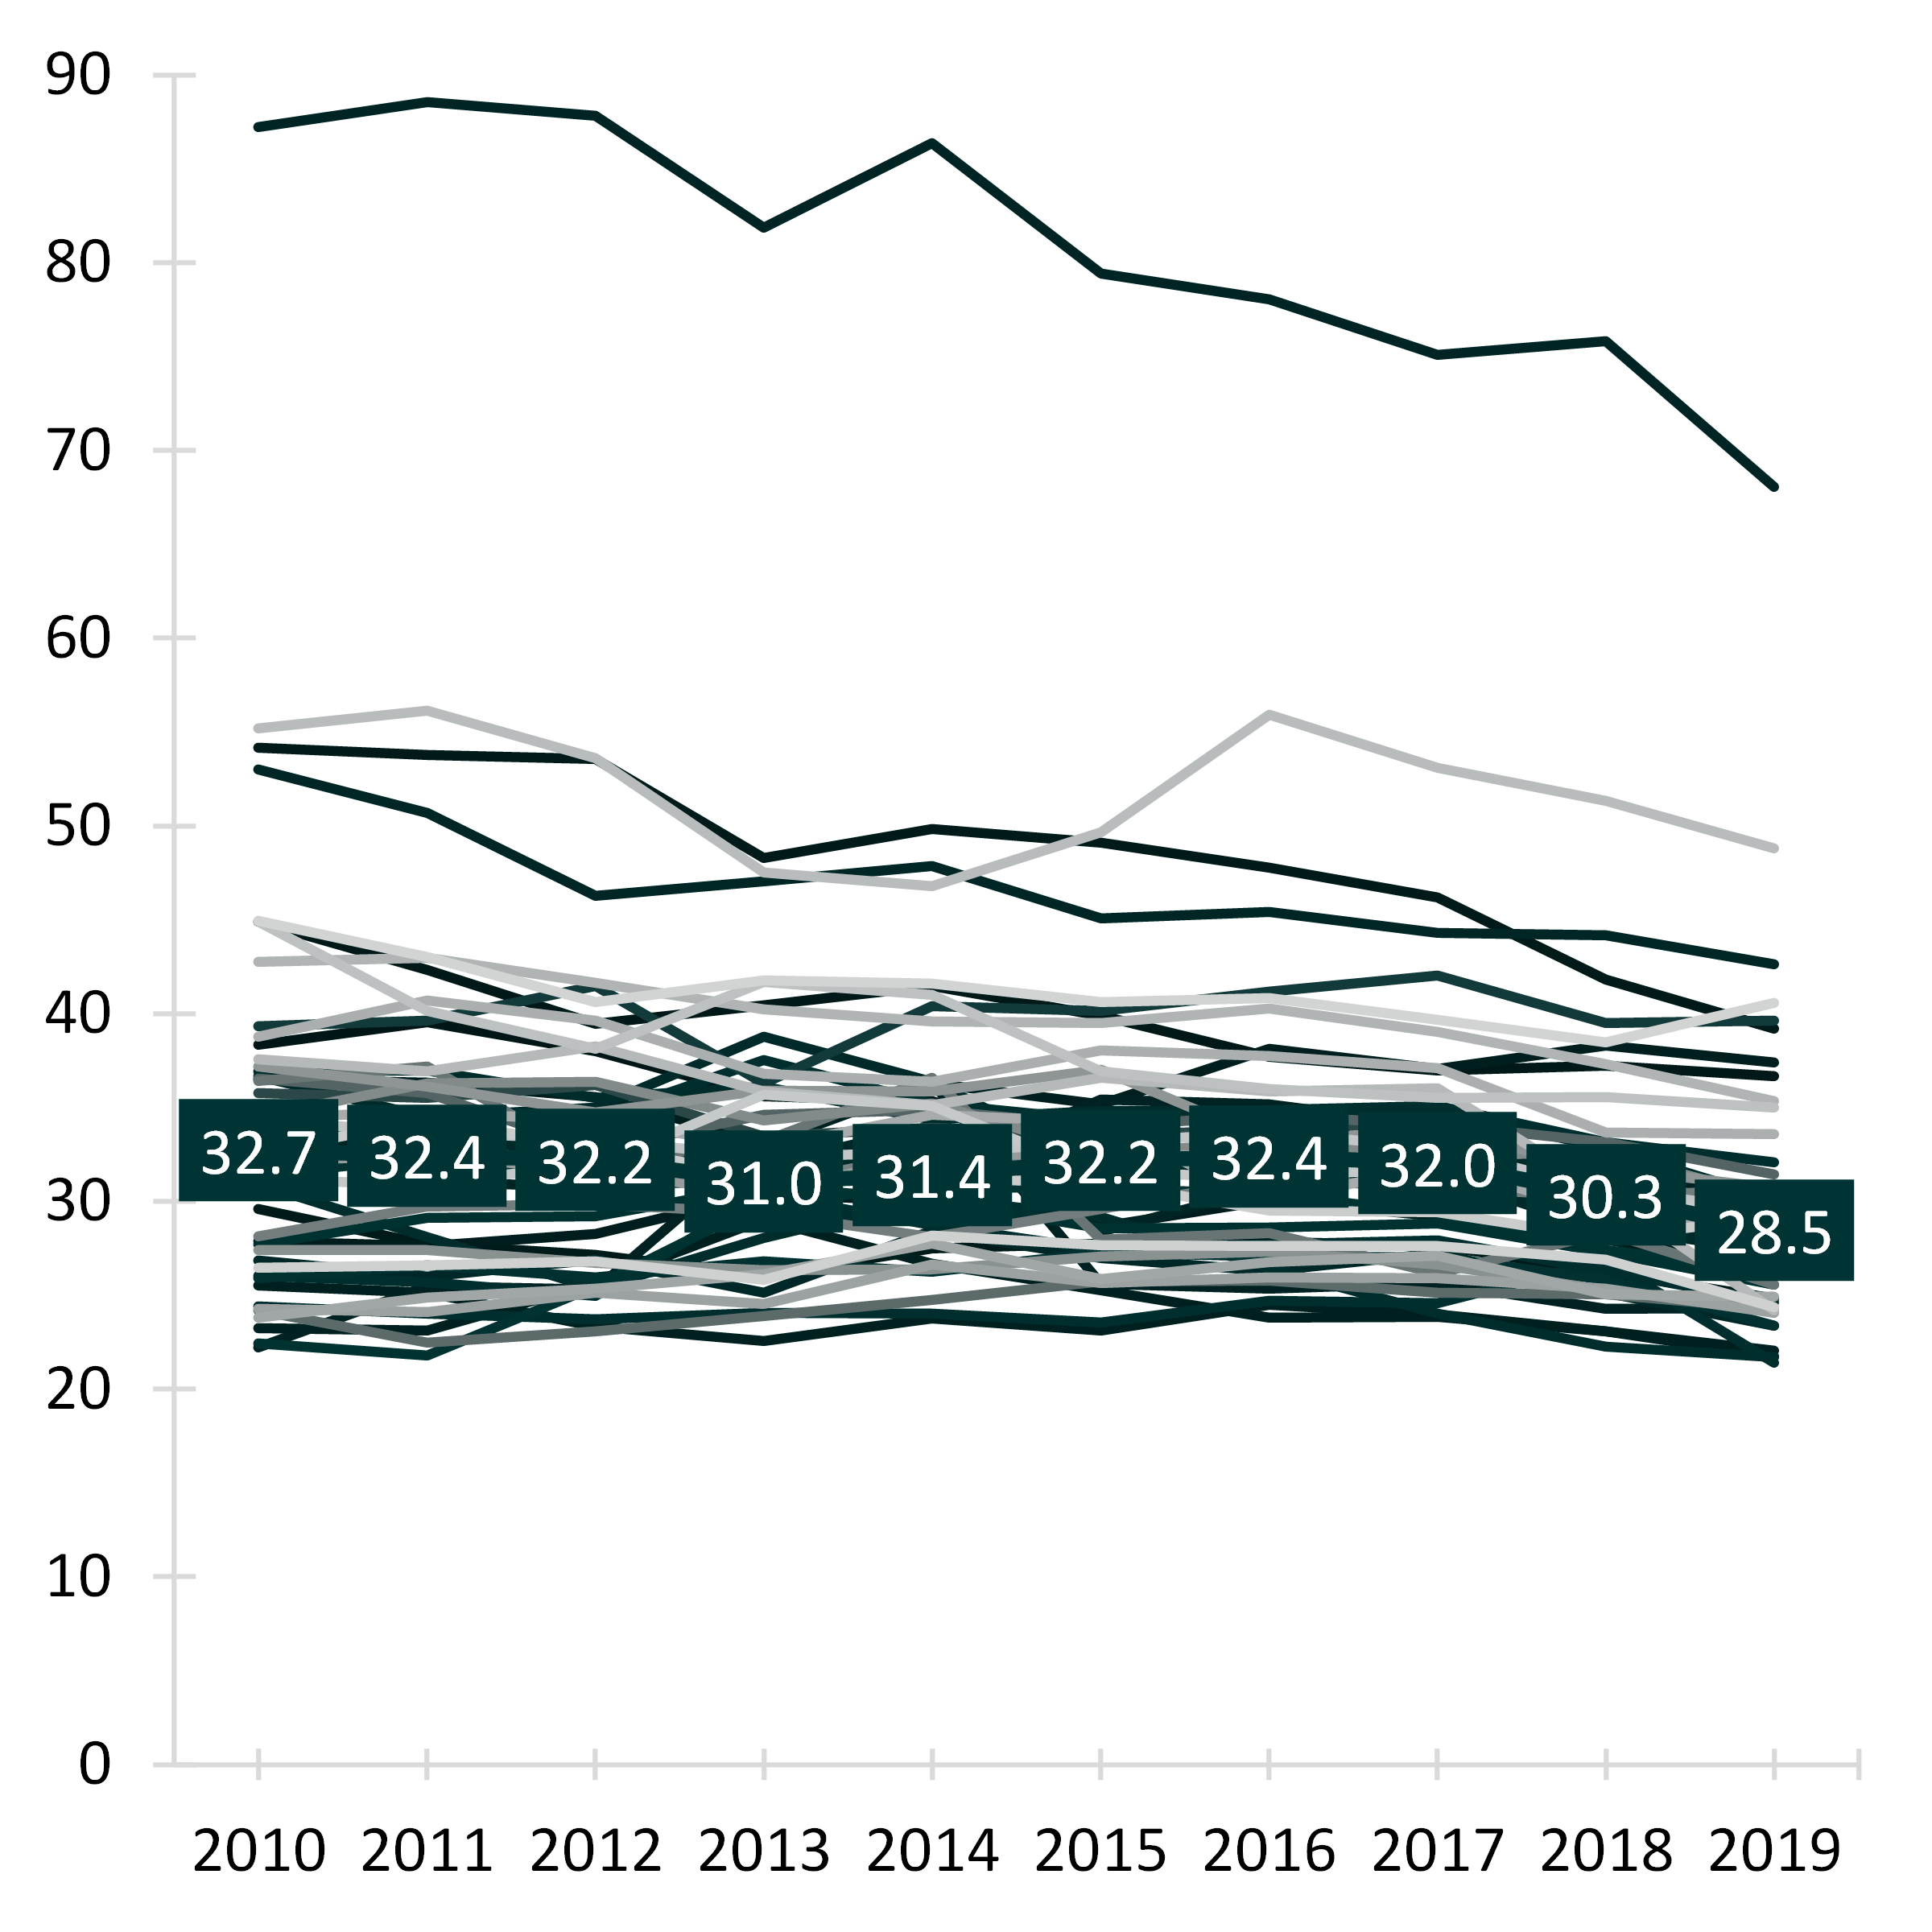
- From 2010 through 2016, the adjusted marriage rate had been relatively stable. At the national level, it ranged from a high of 32.7 marriages per 1,000 unmarried women in 2010 to a low of 31.0 per 1,000 in 2013.
- Beginning in 2017, the adjusted marriage rate has dropped each subsequent year through 2019. In 2019, the adjusted marriage rate was 28.5 marriages per 1,000 unmarried women.
The Adjusted Divorce Rate
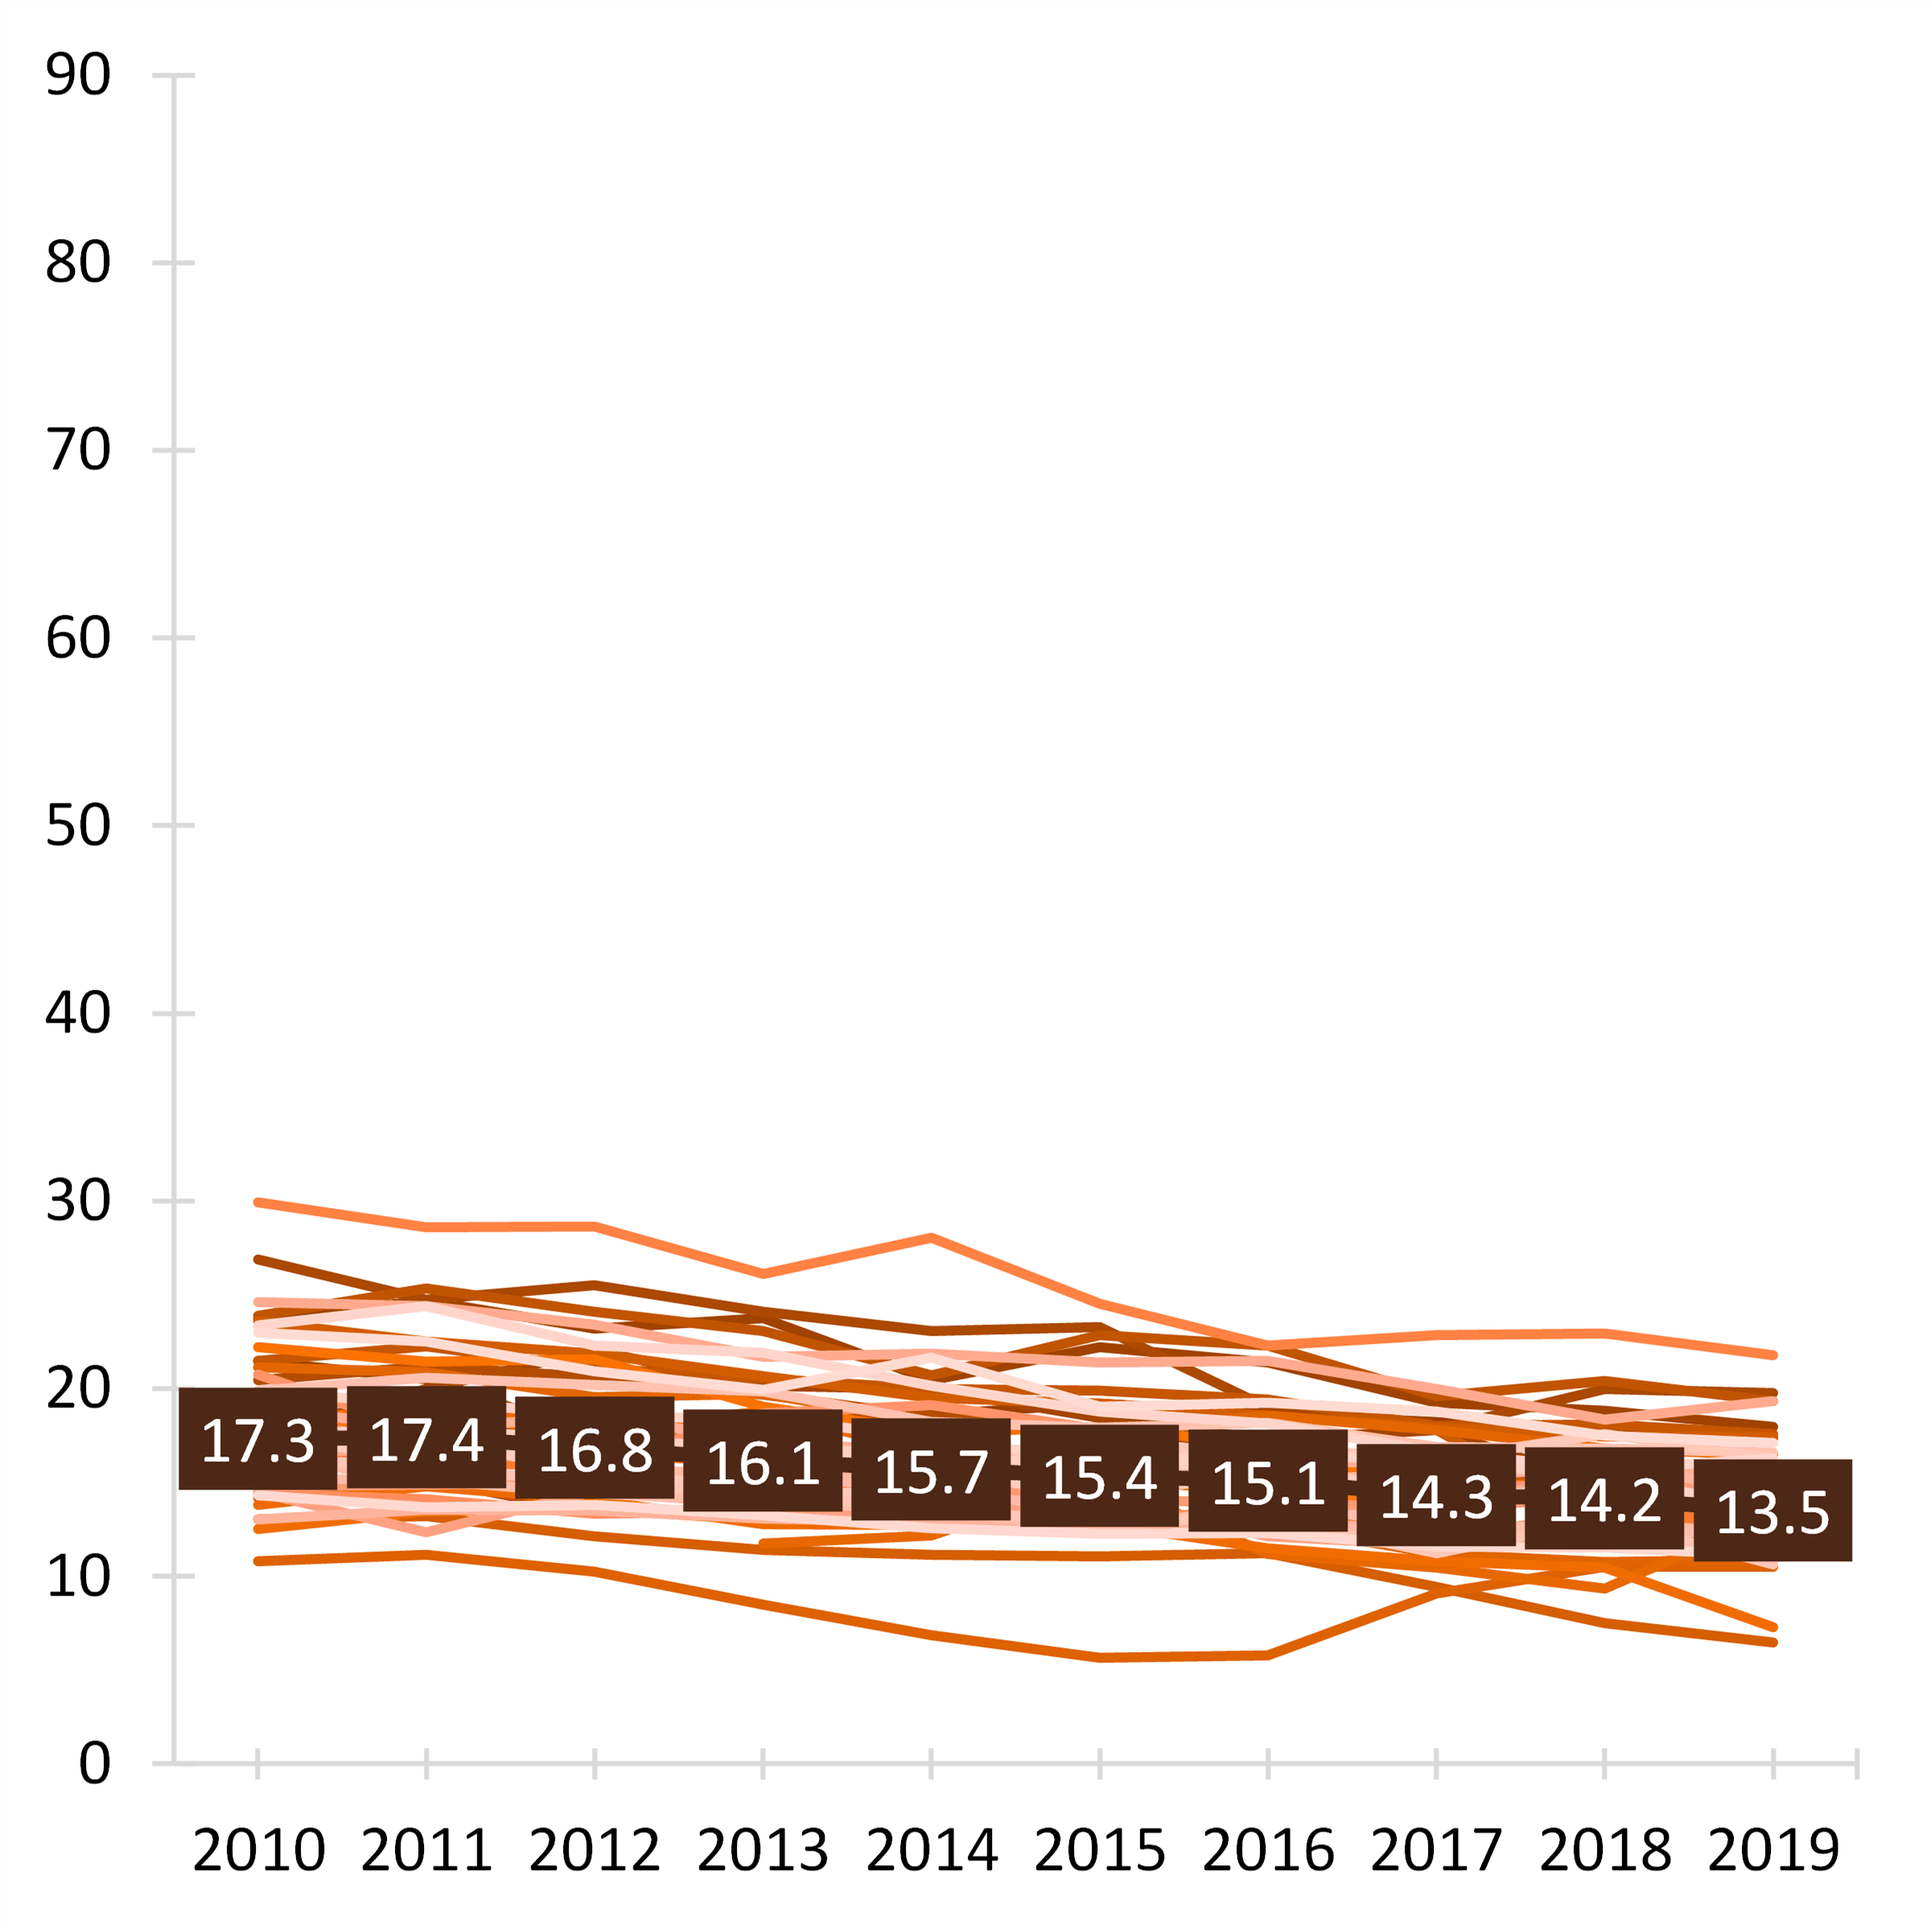
- From 2011 through 2019, the national-level adjusted divorce rate has declined. The rate went from 17.4 divorces per 1,000 married women down to 13.5 divorce per 1,000 in 2019.
- At the national level, marriages outnumber divorces each year by over two-fold (not shown). In 2010, there were 2.4 marriages per one divorce in the United States. In 2016, there were as many as 2.9 marriages per one divorce, leveling off around 2.7 by 2019
Figure 1. Women’s National and State-level Adjusted Marriage Rates and Adjusted Divorce Rates, 2010-2019
1a. Adjusted Marriage Rates

1b. Adjusted Divorce Rates

Source: NCFMR analyses of CDC/NCHS, National Vital Statistics System, U.S. Census Bureau, Population Division Annual Estimates of the Resident Population; IPUMS USA, University of Minnesota, www.ipums.org.
Note: Adjusted marriage rates for the state of Nevada are excluded due to extreme values.
Marriages and Divorces in 2020 – What Does the Administrative Data Reveal?
Marriages
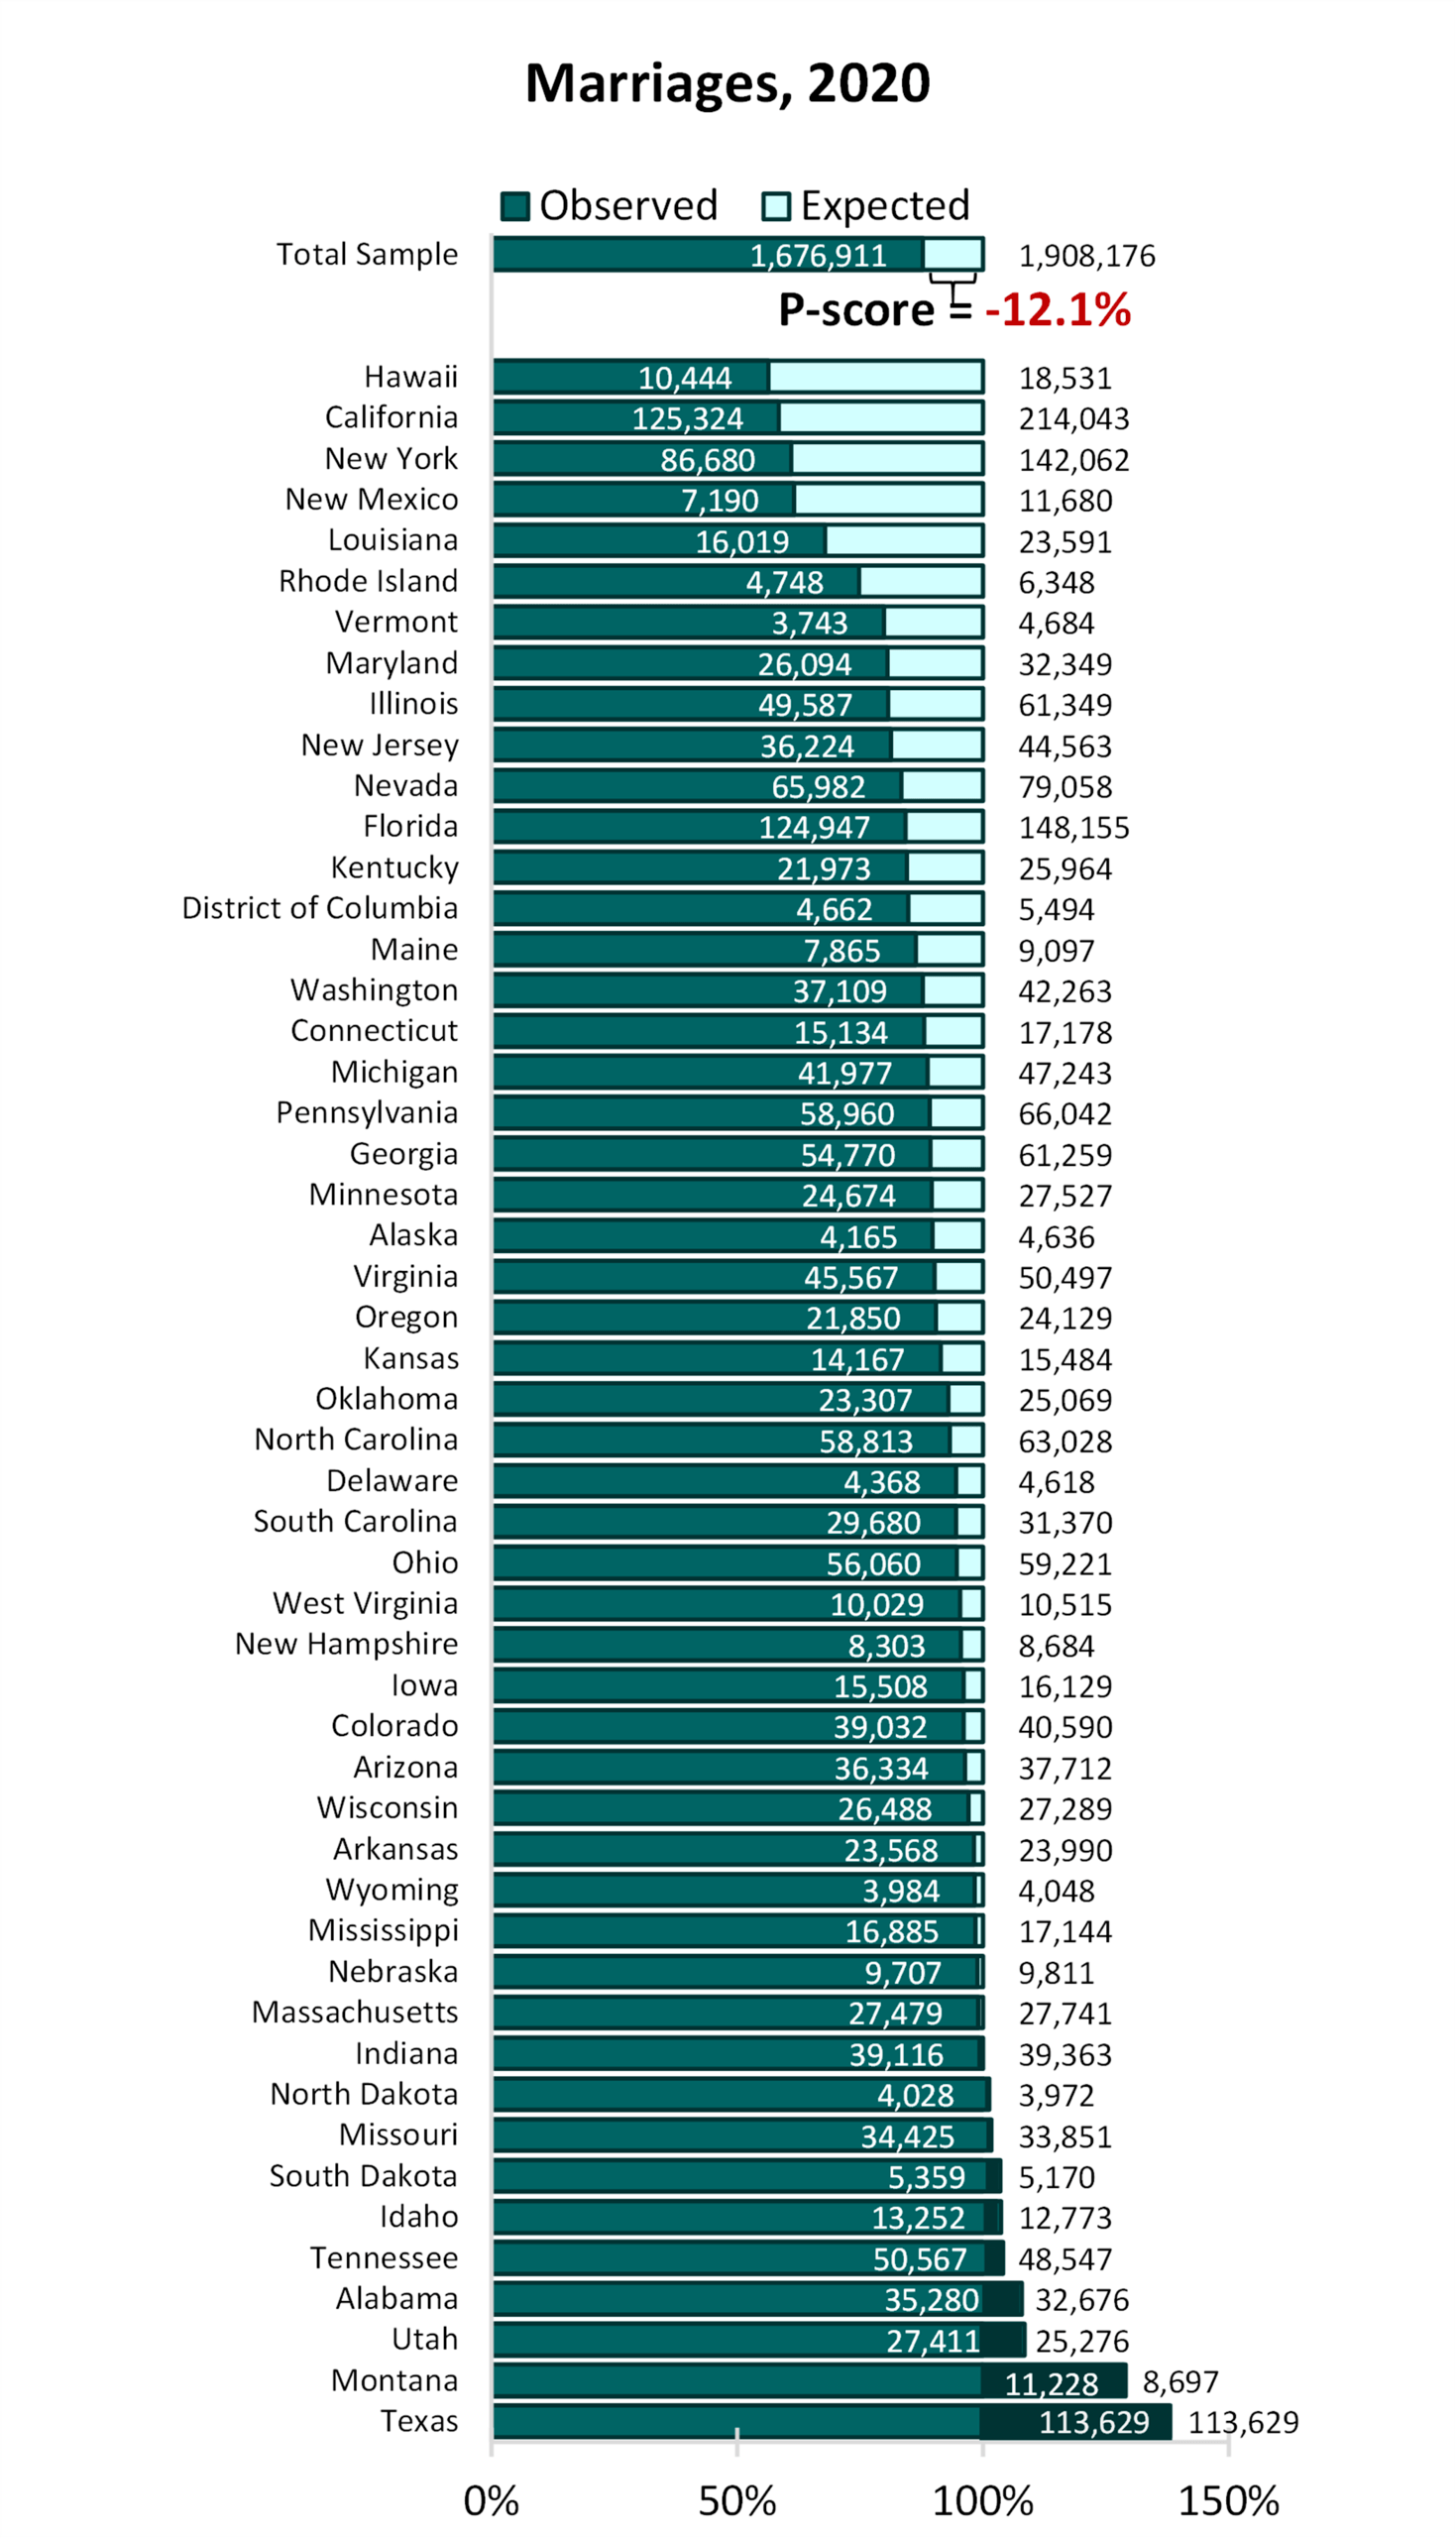
- Based on estimates of the percent change from 2018 to 2019, we anticipated there would be 1.9 million marriages in 2020. However, NCHS data reveal there were only about 1.6 million marriages. This represents a shortfall of 231,265 marriages, or a 12% decline.
- These results varied by state. Some states recorded large percent declines, like Hawaii with 43.6% fewer marriages, California with 41.5% fewer, and New York with 39%.
- Nine states had no shortfall. Texas recorded 38% more marriages and Montana 29%. Upon investigation, it was discovered that Montana law allows for “double proxy marriages” in which neither party need be physically in the state to wed. During 2020, the state reported 4,300 double proxy weddings compared to 1,200 in 2019 (CBS News, Sunday Morning, February 13, 2022).
Divorces
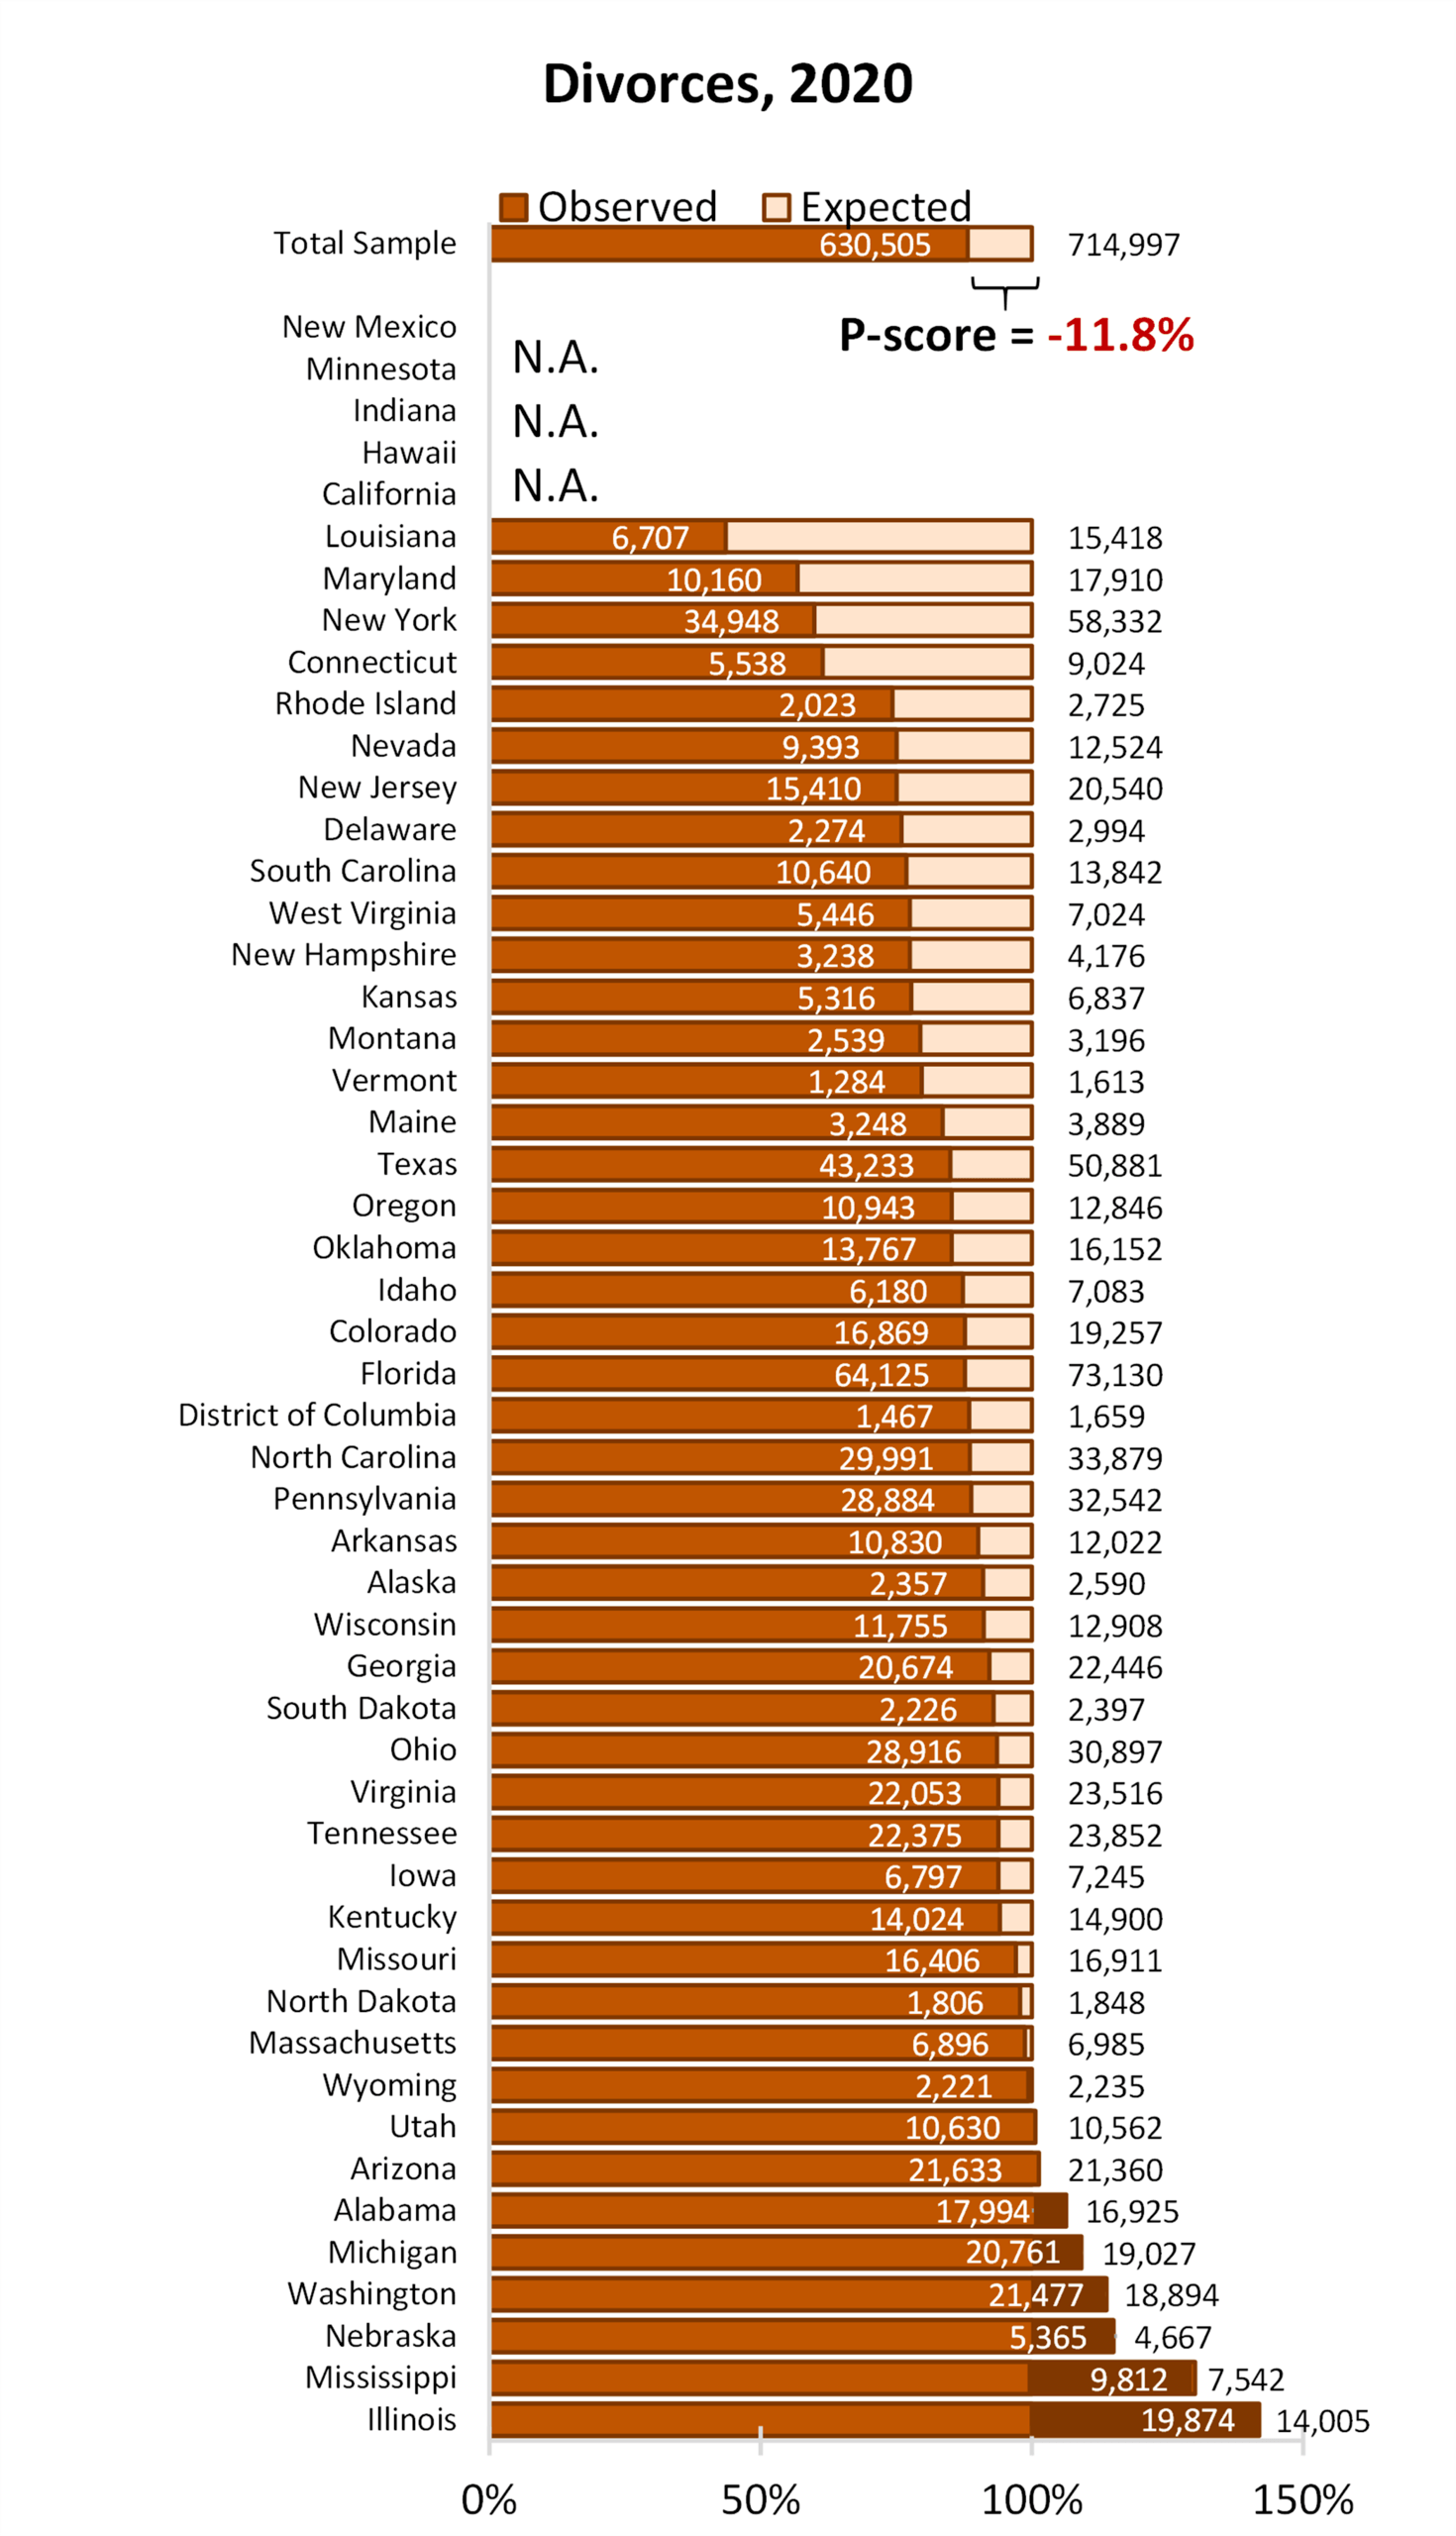
- We expected 714,997 divorces would occur in 2020. However, only 630,505 did so. As with marriages, this decline represented a 12% reduction in the number of divorces occurring in 2020.
- The two states with the largest percent declines were Louisiana (56.5%) and Maryland (43.3%) fewer divorces.
- As with marriages, at the close of 2020 not all states ended the year with fewer divorces—eight states had more divorces than expected. The two largest increases were found in Illinois (41.9%) and Mississippi (30.1%).


Source: NCFMR analyses of CDC/NCHS, National Vital Statistics System; U.S. Census Bureau, Population Division Annual Estimates of the Resident Population; U.S. Census Bureau, 2020 American Community Survey, 1-year Experimental PUMS
Data Sources:
CDC/NCHS, National Vital Statistics System
U.S. Census Bureau, Population Division Annual Estimates of the Resident Population
IPUMS USA, University of Minnesota, www.ipums.org
Suggested Citation:
Westrick-Payne, K. K., Manning, W. D. (2022). Marriage, divorce, and the COVID-19 Pandemic in the U.S. Family Profiles, FP-22-12. Bowling Green, OH: National Center for Family & Marriage Research. https://doi.org/10.25035/ncfmr/fp-22-12
Updated: 11/12/2025 10:04AM

