Thirty Years of Changing Cohabitation Experience in the U.S., 1987-2017
Family Profile No. 27, 2020
Author: Wendy D. Manning
This Family Profile documents shifts in the percentage of women who have ever cohabited over the past thirty years (1987 to 2017). Due to the relatively short duration of cohabiting unions (about 2 years), it is important to examine changes in women's experiences of cohabitation and not just their status at the time of interview (Lamidi, Manning, & Brown, 2019). To provide three decades of cohabitation trends, we draw on two published articles (Bumpass & Lu, 2000; Kennedy & Bumpass, 2008), Family Profile 17-02 (Hemez and Manning 2017), and analyses using the recently released National Survey of Family Growth (NSFG). Estimates for 2017 are based on the newly released 2015-2019 NSFG cycle. Check out the NCFMR full set of profiles on cohabitation including FP-18-22, FP-19-02, and FP-20-12. For more information on the NSFG, see the 2017-2019 Cycle of National Survey of Family Growth and the NSFG web page (NCHS, 2020). All analyses are weighted based on recommendations by NCHS. The age restriction of 19-44 is imposed to allow comparisons across a long-time horizon.
Changes in the Share of Women Who Ever Cohabited
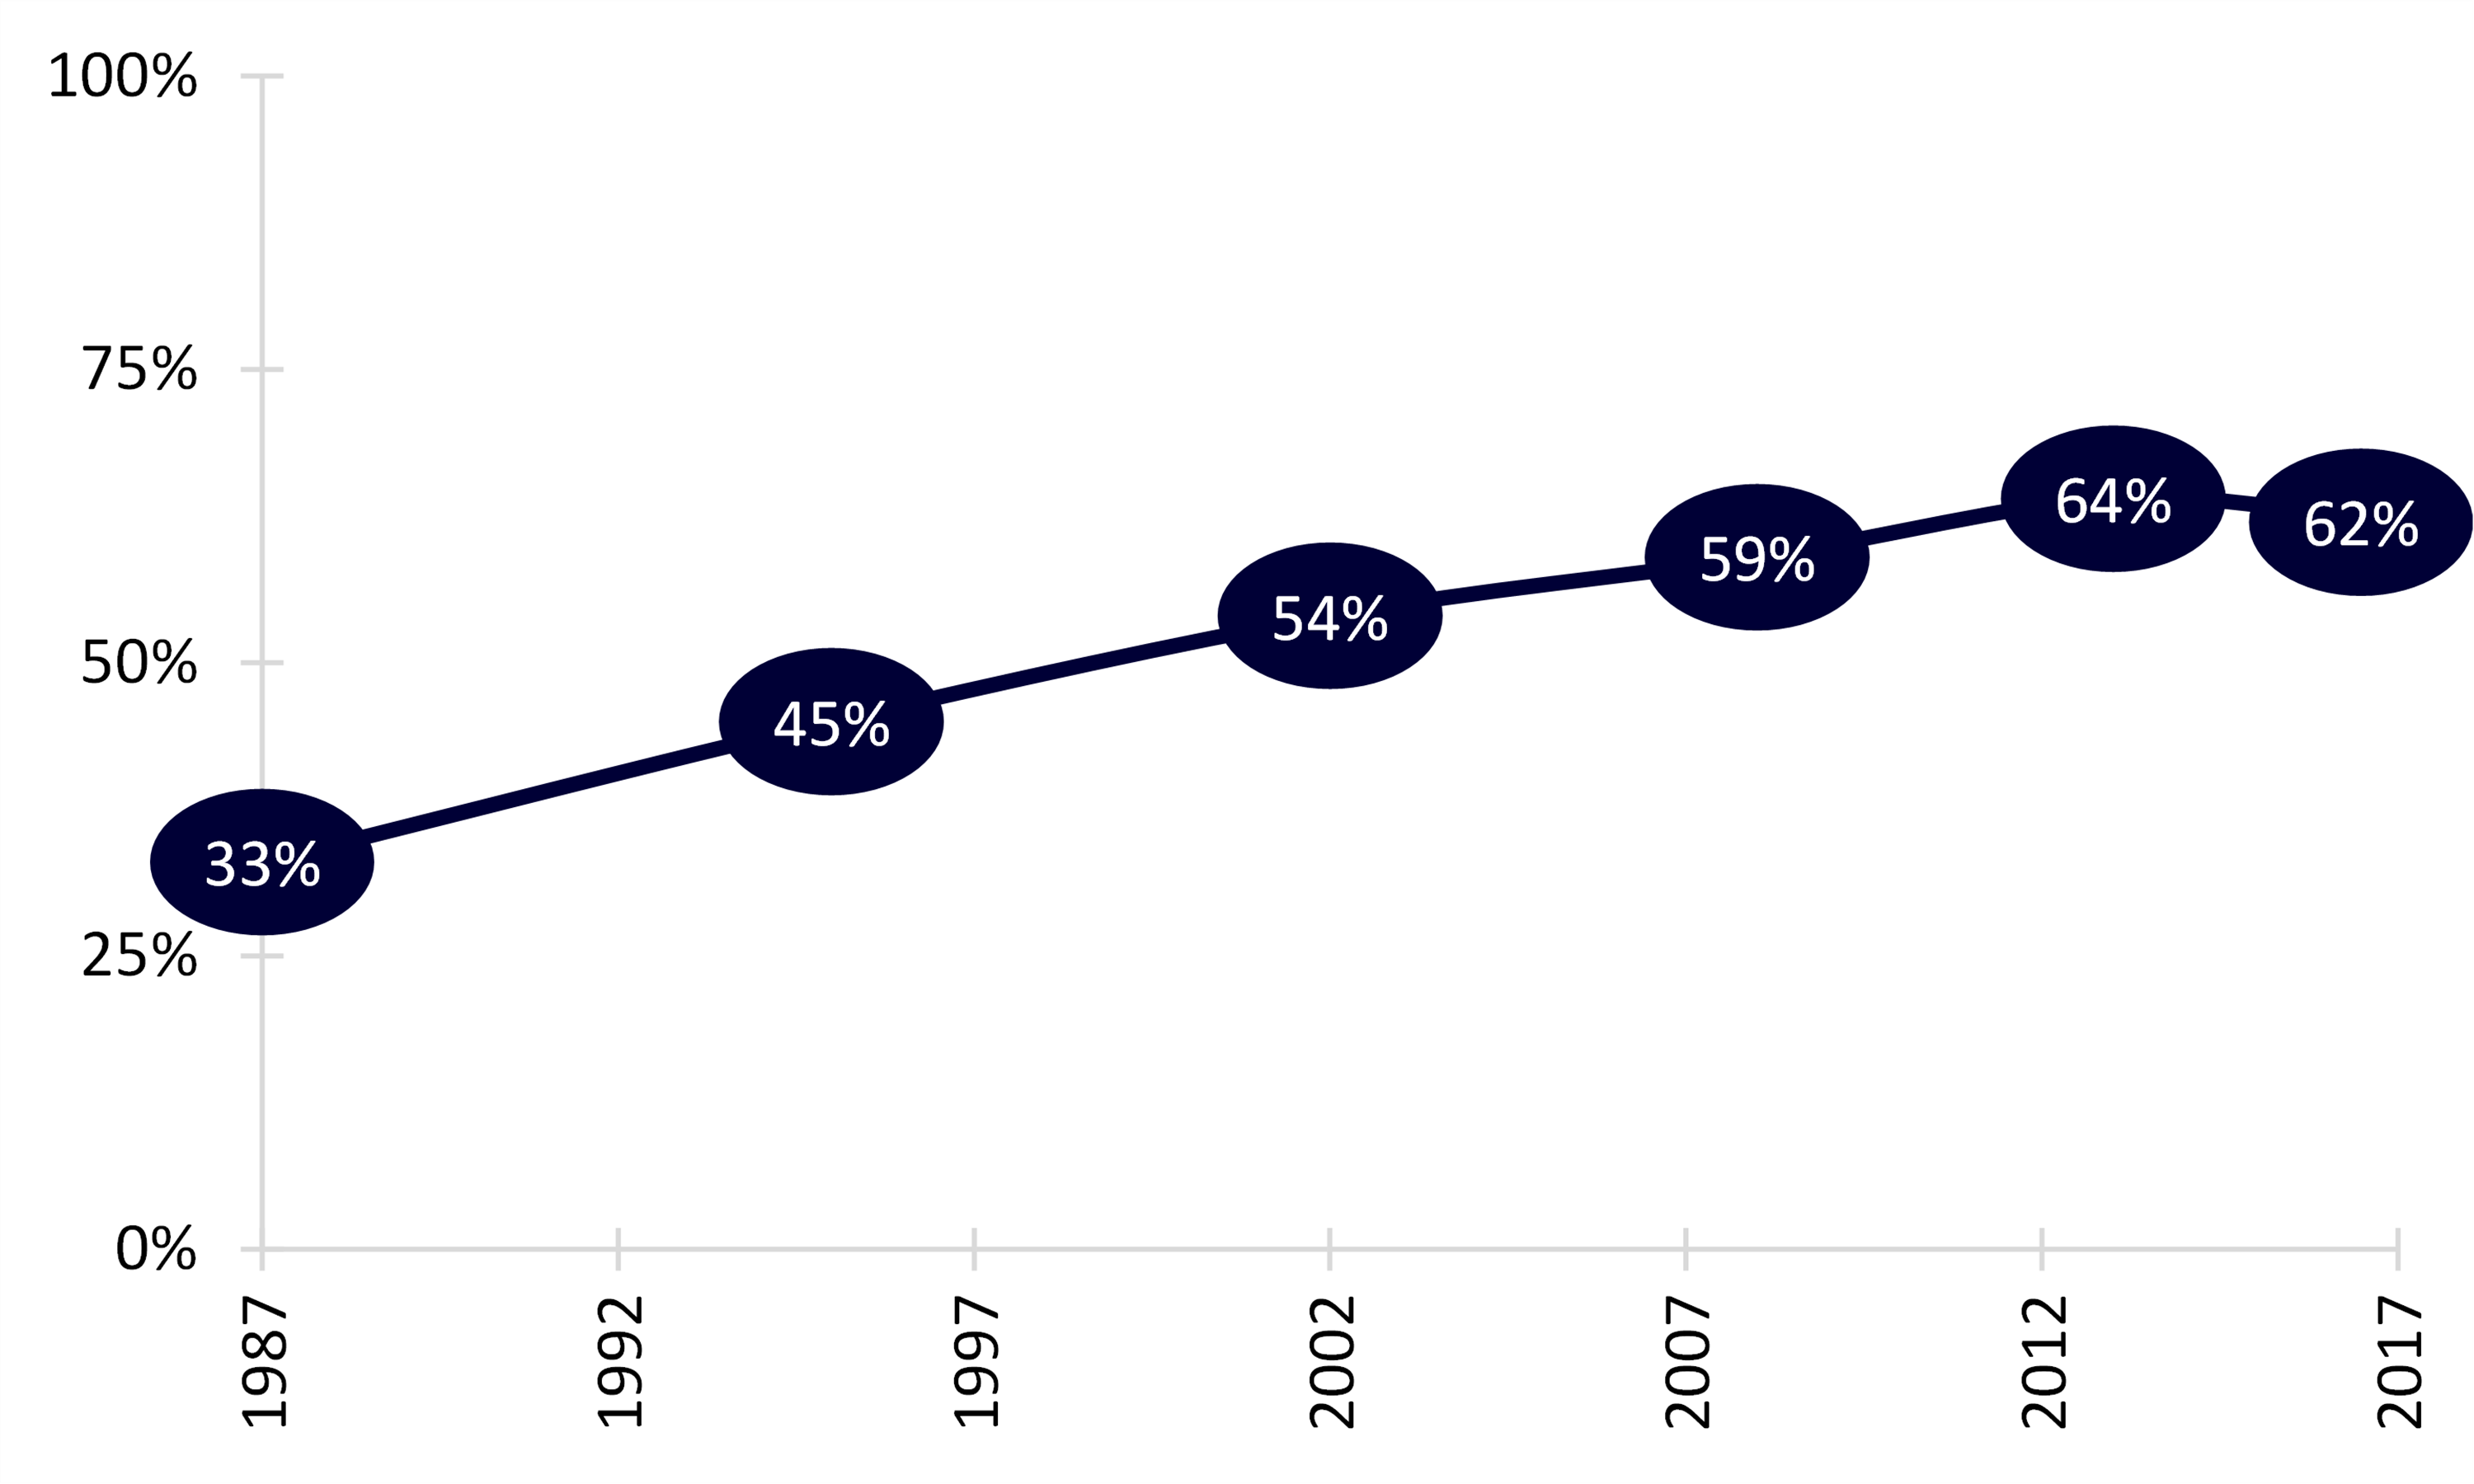
- The percentage of women who have ever cohabited steadily increased from 1987 and 2013. In 1987, one-third of women (aged 19-44) had ever cohabited. By 2013, that number approached two-thirds (64%).
- Over the last decade, a plateau in the growth of cohabitation has emerged. Recently, about three out of five (62%) women reported having ever cohabited. This is the first time a stalled increase in cohabitation has been observed over the last 30 years.
- Among women who have ever cohabited, most (65%) women have cohabited with only one partner. About one-third of women have lived with two or more partners.
Figure 1. Changes in the Share of Women (19-44) Who Ever Cohabited


The trend of increases in cohabitation has recently stalled, indicating a plateau in cohabitation experience in the United States.

Race & Ethnicity
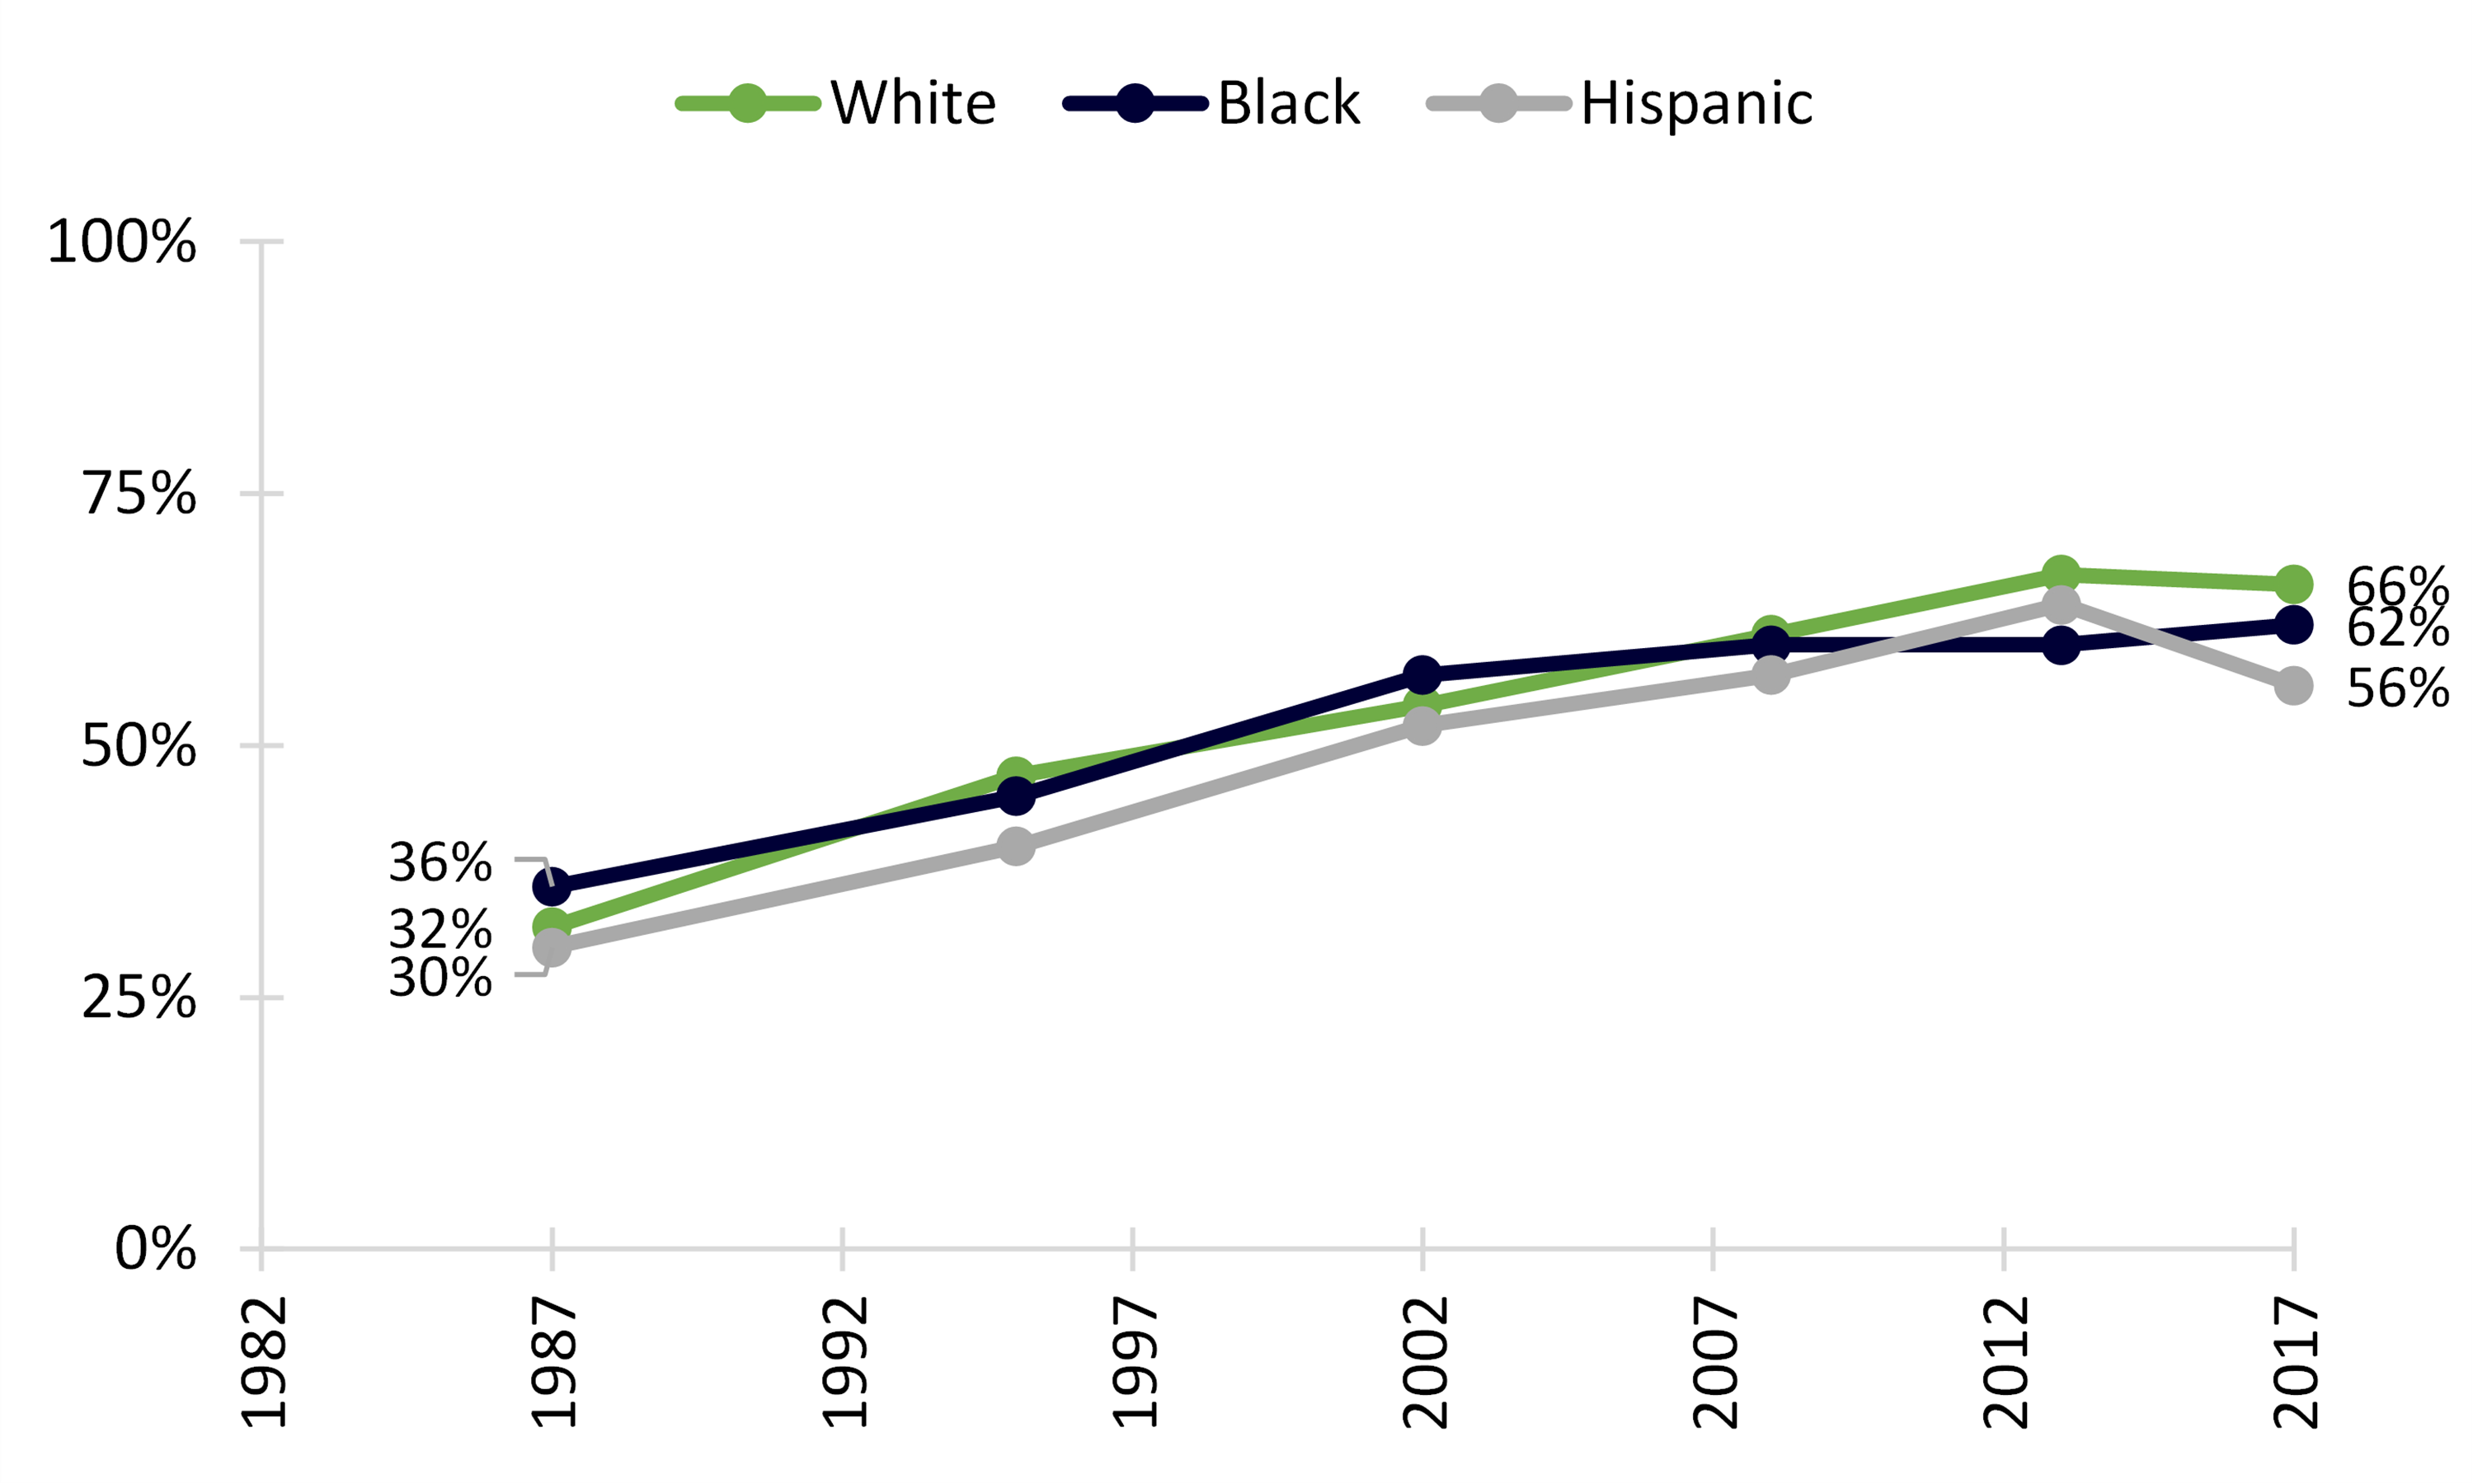
- Starting in 1987, the share of women who had ever cohabited increased for Whites, Hispanics, and Blacks.
- In 2017, two-thirds (66%) of White women had ever cohabited compared to 62% of Black women and 56% of Hispanic women.
- Over the last decade, the share of women with cohabitation experience has basically leveled for all racial and ethnic groups shown here. A slight decline was observed among Hispanic women returning to 2008 levels.
Figure 2. Change in the Share of Women {19-44) Who Ever Cohabited, by Race and Ethnicity Status

Educational Attainment
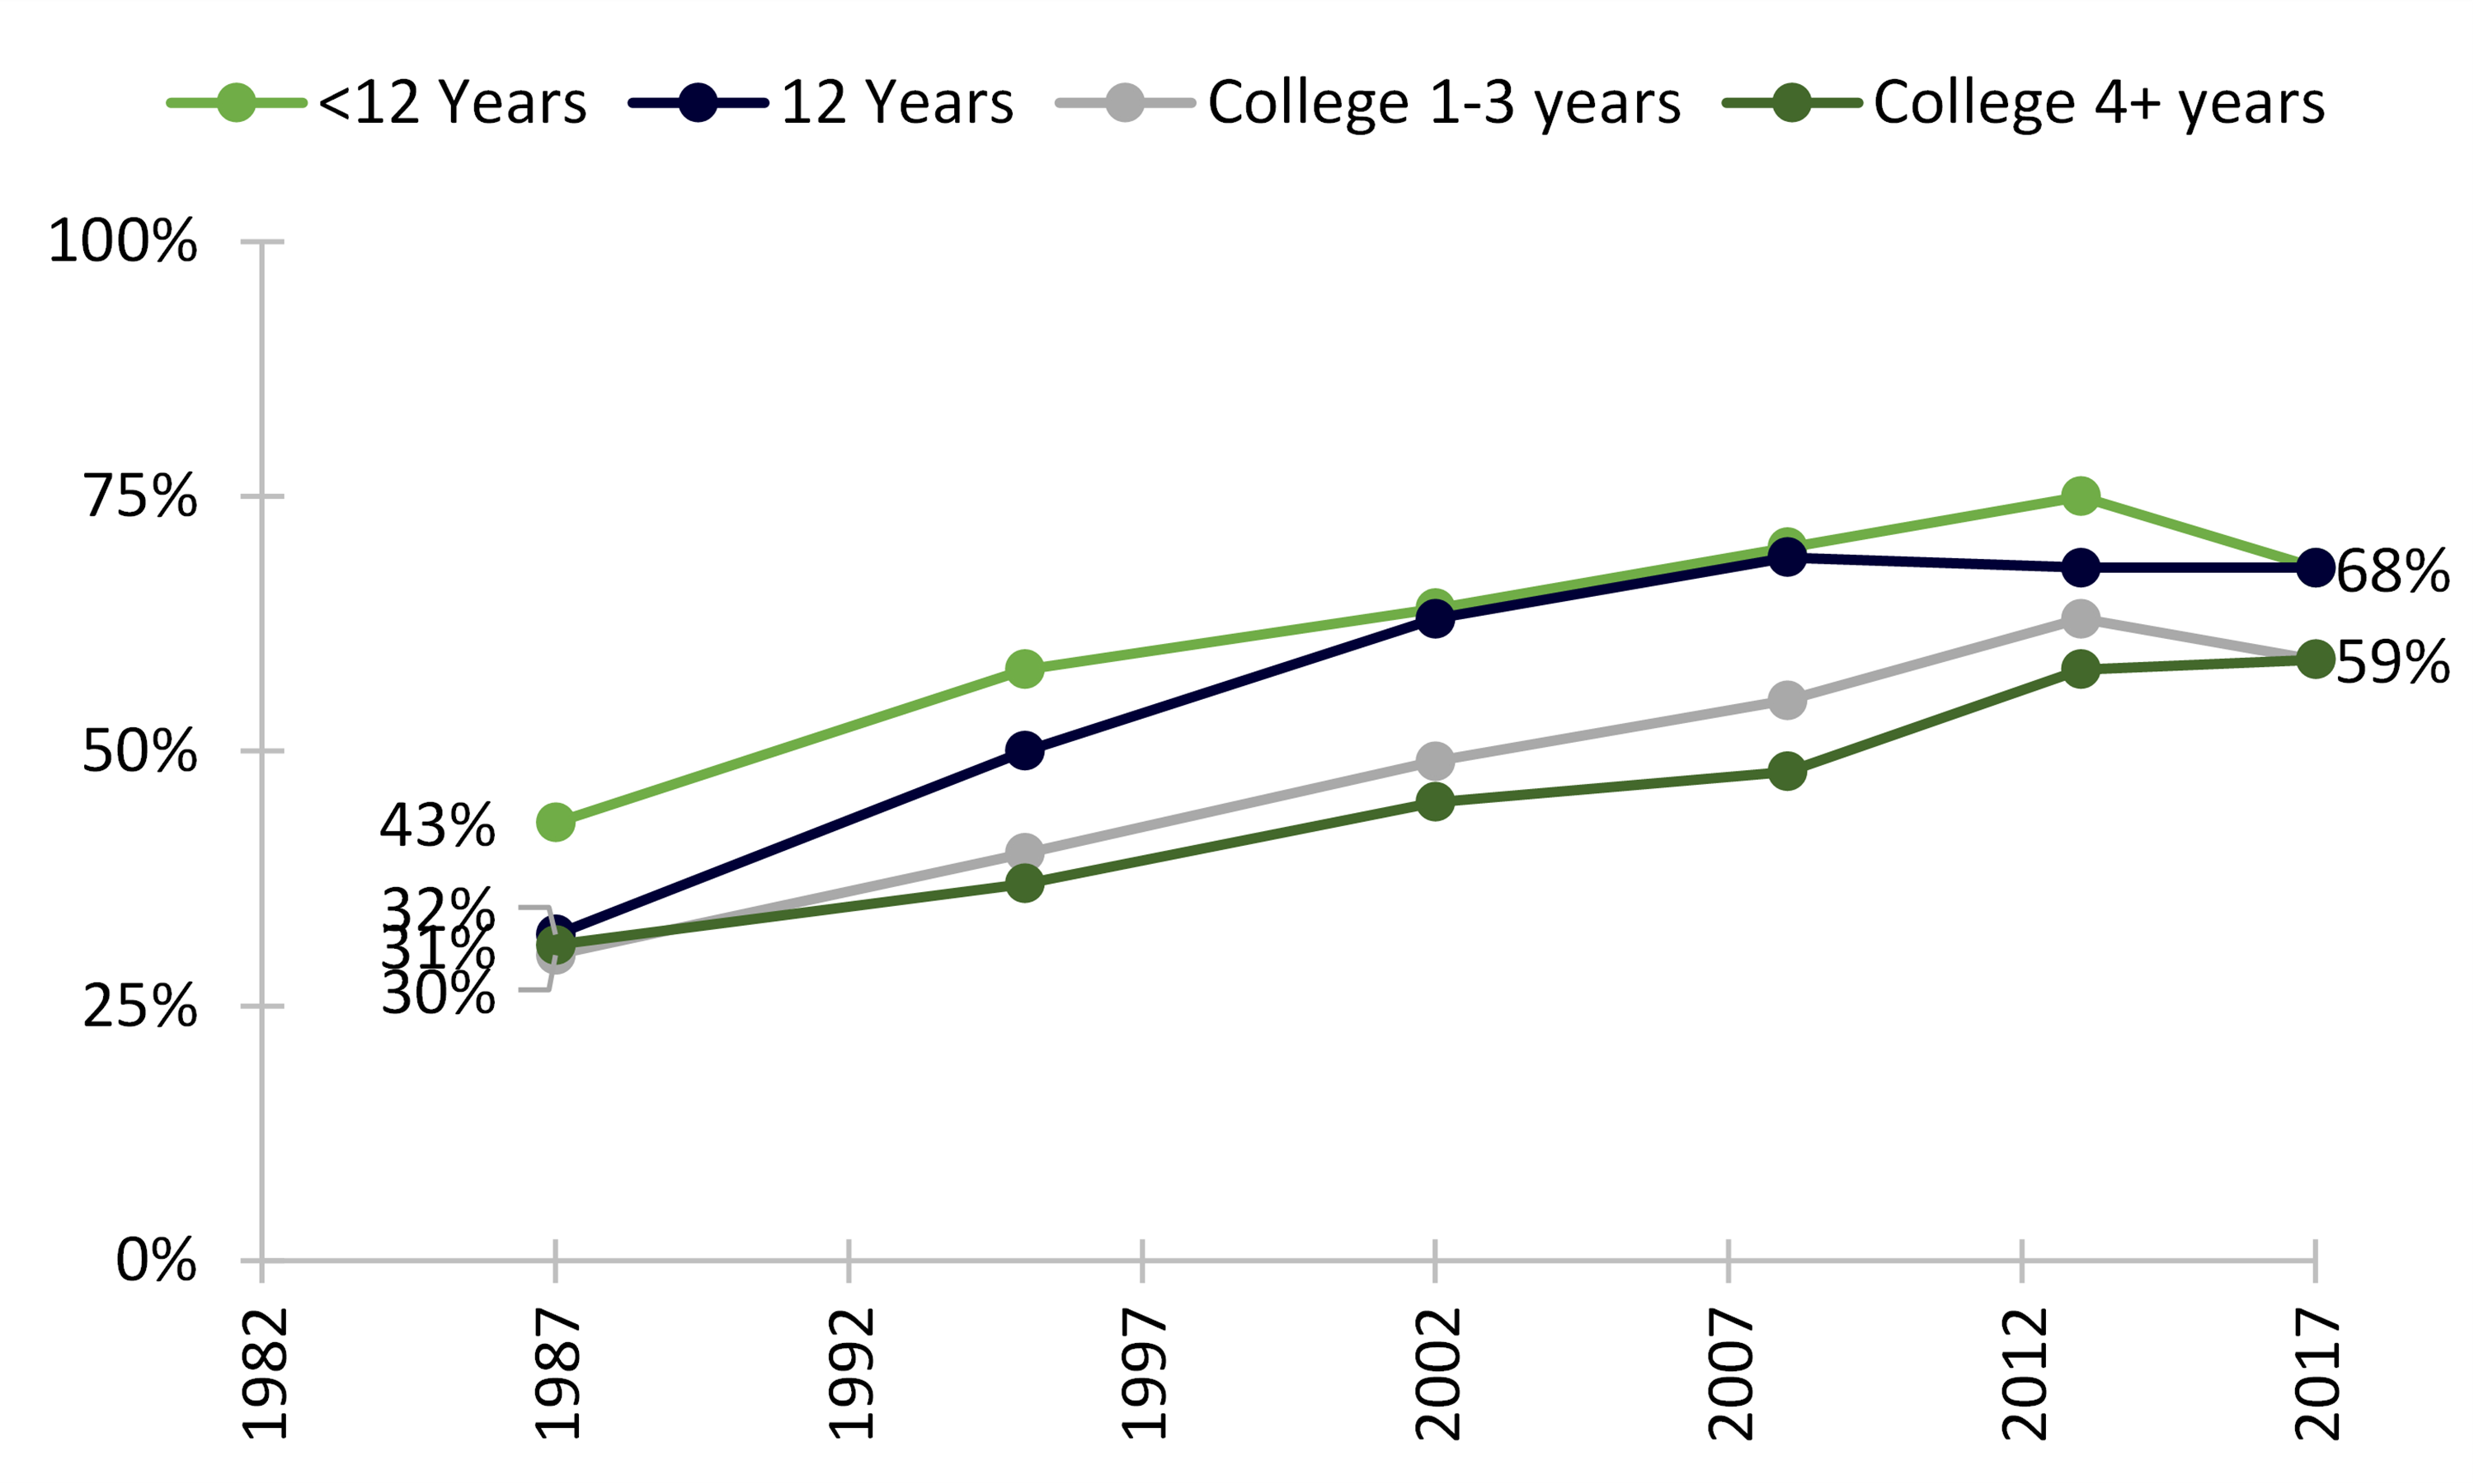
- The share of women aged 19-44 who had ever cohabited increased among all educational attainment groups until recently. There is a new educational convergence in cohabitation experience.
- Similar shares (68%) of women without a high school degree and those with a high school degree or GED had ever cohabited.
- Until recently, women with a college degree had the lowest levels of cohabitation. In 2017, three out of five women with some post-high school education (with or without a college degree) had ever cohabited.
Figure 3. Change in the Share of Women {19-44) Who Ever Cohabited, by Educational Attainment

References
- Bumpass, L. & Lu, H. (2000). Trends in cohabitation and implications for children's family contexts in the United States. Population Studies, 54, 29-41. doi:
10.1080/713779060 - Hemez, P. & Manning, W. D. (2017). Twenty-five years of change in cohabitation experience in the U.S., 1987-2013. Family Profiles, FP-17-02. http://www.bgsu.edu/ncfmr/resources/data/family-profiles/hemez-manning-25-years-change-cohabitation-fp-17-02.html
- Kennedy, S. & Bumpass, L. (2008). Cohabitation and children's living arrangements: New estimates from the United States. Demographic Research, 19, 1663-1692. doi: 10.4054/DemRes.2008.19.47
- Lamidi, E. 0., Manning, W. D., & Brown, S. L. (2019). Change in the stability of first premarital cohabitation, 1983-2013. Demography, 56, 427-450.
- National Center for Health Statistics (NCHS). 2020. 2017-2019 National Survey of Family Growth Public-Use Data and Documentation. Hyattsville, MD: CDC National Center for Health Statistics. Retrieved October 28, 2020. (http://www.cdc.gov/nchs/nsfg/nsfg_2017_2019_puf.htm).
Suggested Citation
- Manning, W. D. (2020). Thirty years of change in cohabitation experience in the U.S., 1987-2017. Family Profiles, FP-20-27. Bowling Green, OH: National Center for Family & Marriage Research. https://doi.org/10.25035/ncfmr/fp-20-27

This project is supported with assistance from Bowling Green State University. From 2007 to 2013, support was also provided by the U.S. Department of Health and Human Services, Office of the Assistant Secretary for Planning and Evaluation. The opinions and conclusions expressed herein are solely those of the author(s) and should not be construed as representing the opinions or policy of any agency of the state or federal government.
Updated: 04/06/2021 01:32PM

