Age Variation in the Divorce Rate, 1990 & 2017
Family Profile No. 13, 2019
Author: Colette Allred
(Updated profiles include: FP-19-13 & FP-17-20)
Introduction
The overall U.S. divorce rate has declined only slightly over the past three decades. In 1990, 19 people divorced for every 1,000 people who were currently married versus 15 per 1,000 in 2017. This overall trend masks considerable variation in the divorce rate by age group. The divorce rate for those aged 50 and older has more than doubled since 1990 (Brown & Lin, 2012), signaling that the divorce rate for younger adults has declined (Kennedy & Ruggles, 2014). This profile updates FP-17-20 combining data from the 1990 U.S. Vital Statistics and the 2017 American Community Survey.
Divorce Rates
During both 1990 and 2017, the rates of divorce declined with age. Differences in divorce rates across age groups were smaller in 2017 than in 1990.
- Among those in the younger age groups, divorce rates have decreased since 1990.
- The greatest decrease was observed among 15- to 24-year-olds, whose divorce rates decreased by 43% (from 47 to 27 per 1,000).
- For those aged 45 and older, divorce rates were higher in 2017 than in 1990.
Figure 1. Divorce Rates by Age Groups
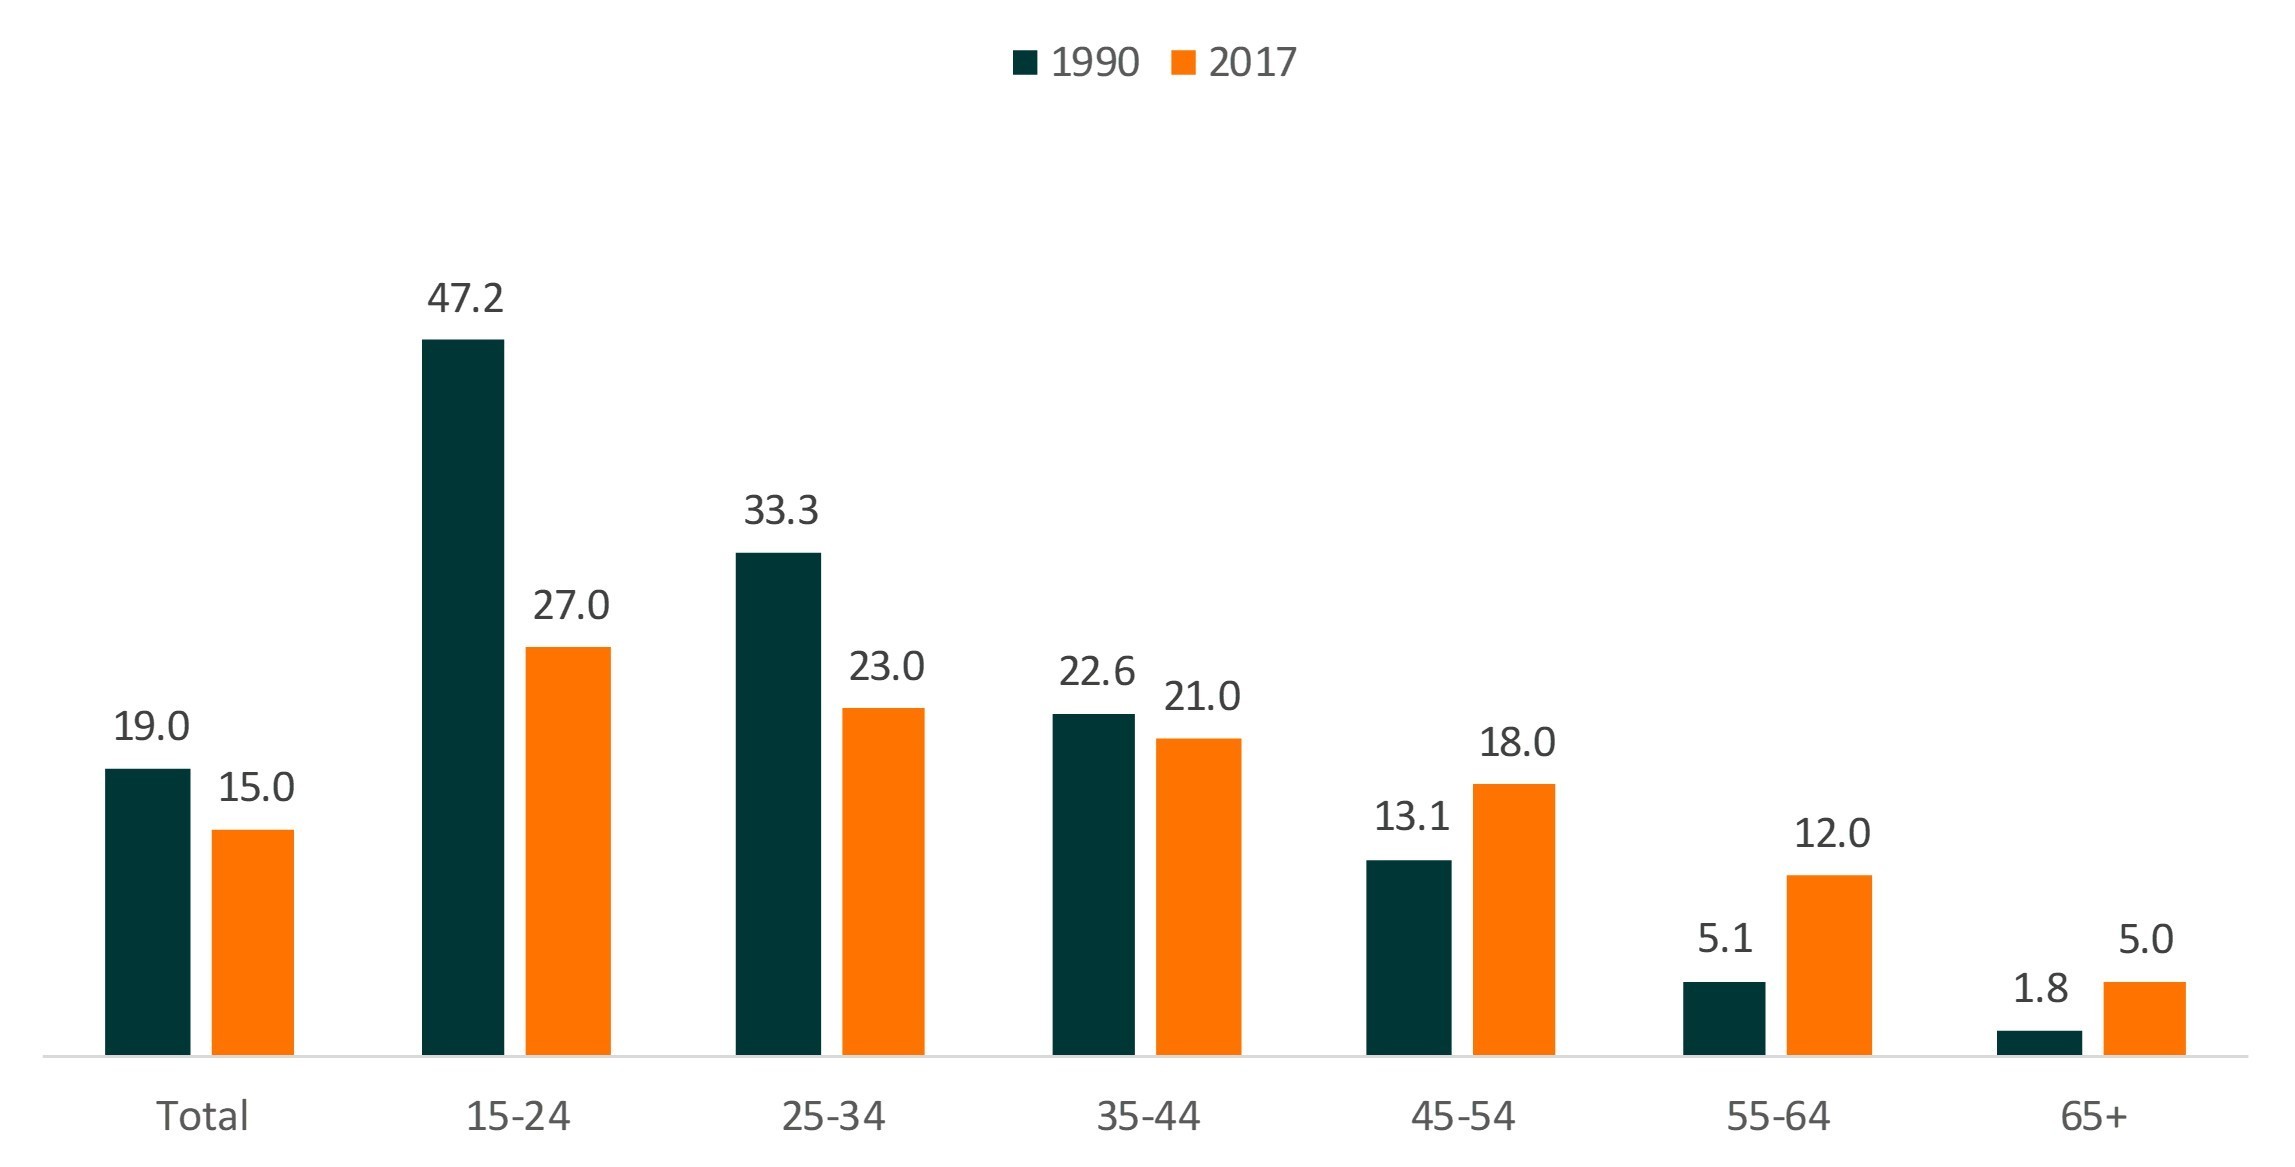
Source: Centers for Disease Control and Prevention, National Center for Health Statistics, Vital Statistics and U.S. Census Bureau, American Community Survey, 2017
Divorce Rates by Gender
The trends and levels of divorce were similar for men and women across age groups.
- For both men and women under age 35, the divorce rate declined.
- The divorce rate for men aged 35-44 also decreased, but for women in the same age group, the rate barely changed (from 21 to 22 per 1,000).
- Divorce rates for those aged 45 and older increased for both men and women, although the increase was much greater for women than for men.
- For women aged 55-64, their divorce rate nearly tripled (from 4 to 11 per 1,000), whereas the rate for men in the same age group doubled (from 6 to 12 per 1,000).
- The divorce rate for women aged 65 and older increased six-fold (1 to 6 per 1,000), whereas for men aged 65 and up, the divorce rate almost tripled (2 to 5 per 1,000).
Figure 2. Divorce Rates by Age Groups and Gender


Source: Centers for Disease Control and Prevention, National Center for Health Statistics, Vital Statistics and U.S. Census Bureau, American Community Survey, 2017
References:
Brown, S. L., & Lin, I.-F. (2012). The gray divorce revolution: Rising divorce among middle-aged and older adults, 1990-2010. The Journals of Gerontology Series B: Psychological Sciences and Social Sciences, 67(6), 731-741.
Kennedy, S., & Ruggles, S. (2014). Breaking up is hard to count: The rise of divorce in the United States, 1980-2010. Demography, 51(2), 587-598.
Wu, H. (2017). Age variation in the divorce rate, 1990-2015. Family Profiles, FP-17-20. Bowling Green, OH: National Center for Family & Marriage Research.
Suggested Citation:
Allred, C. (2019). Age variation in the divorce rate, 1990 & 2017. Family Profiles, FP-19-13. Bowling Green, OH: National Center for Family & Marriage Research. https://doi.org/10.25035/ncfmr/fp-19-13.

Updated: 07/08/2026 07:44PM