R3D Align Basepair Table Help
The alignment basepair table provides a wealth of information regarding the correspondences in the nucleotide to nucleotide alignment, the basepairing interactions of each structure, and the structural similarities of local regions of aligned nucleotides.
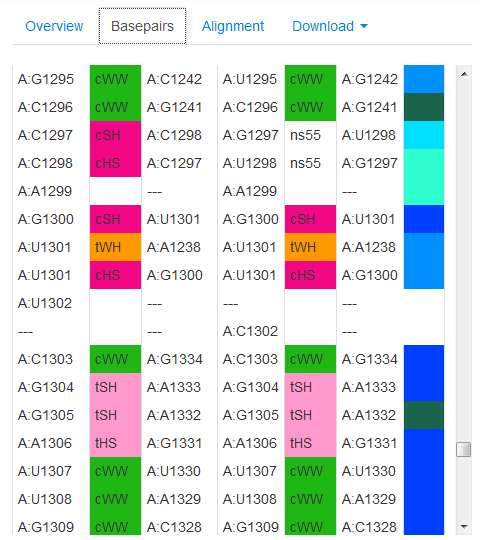
The following figure shows a portion of the spreadsheet produced by R3D Align to represent the 3D alignment of the T. thermophilus(PDB 1J5E) (Columns 1-3) and E. coli (PDB 2AVY) (Columns 4-6) 16S rRNA structures.

Each nucleotide from 1J5E is listed in Column 1 identified by the chain followed a colon and then the base letter and nucleotide number as in the PDB file. The nucleotide in 2AVY to which it is aligned, if any, is listed in Column 4 of the same row.

For example, the first row of the figure indicates that nucleotide 1295 of chain A in 1J5E has base G and is aligned with nucleotide 1295 of chain A in 2AVY, which has base U.
If there is no corresponding nucleotide in the second structure, the entry in Column 4 is left blank. Likewise, if a nucleotide in Column 4 is not aligned to a nucleotide in first structure, the cell in Column 1 of the corresponding row is left blank.

For example, the rows indicate that nucleotide U1302 in 1J5E has no correspondence in 2AVY and nucleotide C1302 in 2AVY has no correspondence in 1J5E. Blank entries such as these indicate that the nucleotide does not have a structural correspondence. The nucleotide may have a correspondence at the level of evolutionary homology, however. For example, in the figure above, it is likely that U1302 in T.th. corresponds to C1302 in E.coli, but that they do not superimpose well enough in 3D to stay under the discrepancy cutoff d used by R3D Align.
To capture some aspects of the local 3D context, the alignment also shows the basepairs made by each nucleotide in each structure. For each nucleotide in Column 1, the nucleotide it basepairs with is listed in column 3. The type of basepair is indicated in Column 2 and is annotated according to the Leontis/Westhof system.

For example, the row indicates that nucleotides G1295 and C1242 form a cisWatson-Crick/Watson-Crick basepair. A separate row is provided for each basepair a nucleotide makes.

For example, in the rows U1301 is listed twice because it makes a transWatsonCrick/Hoogsteen (tWH) base pair with A1238 and a cis Hoogsteen/Sugar (cHS) base pair with G1300. The nucleotides in Columns 1 and 4 of the alignment are listed in increasing numerical order. The nucleotide corresponding to that in Column 3 is displayed in the same row in Column 6. The type of interaction between the nucleotides in Columns 4 and 6 is indicated in Column 5. In the example above, U1301 and G1300 in 1J5E make a cHS basepair and are aligned to U1301 and G1300, respectively, in 2AVY which also make a cHS basepair. If the nucleotides in Columns 4 and 6 do not form a base-pairing interaction, some other text is displayed. Near basepairs are indicated by text such as ncWW or ncSH, stacking interactions are indicated by text such as s35, near stacking interactions by text such as ns35. If there is no interaction at all between the indicated nucleotides, ‘—’ is displayed.
The cells in columns 2 and 5 are colored according to basepair type. This allows for a quick visual assessment of the alignment of basepairs between structures. One can quickly conclude that the alignment portion displayed above is accurate because identical colors (and thus identical basepairs) appear in most of the rows.

Rows in which corresponding basepairs do not appear in columns 2 and 5 indicate a possible area of further exploration. For good alignments, pairs of aligned nucleotides generally make the same base pair types as nucleotides that are also aligned. Note, in this case, that these rows show the basepair between C1297 and C1298, and then again between C1298 and C1297. This is because each nucleotide in Structure 1 will be listed at least once in Column 1.
Not only does the spreadsheet thus show every base pair interaction detected in each structure in addition to all of the alignment information, the colors appearing in the rightmost column also provide information regarding the structural similarities of the local region of each aligned nucleotide. These colors are determined in the same way that the colors for the connecting lines in the bar diagram are determined. Specifically, for each nucleotide in the first structure that has a corresponding nucleotide in the second, the four nearest neighboring nucleotides with a correspondence are found and the geometric discrepancy between those five nucleotides and the corresponding five is computed to use as the basis for the coloring the line.

The legend is displayed at the top of each basepair table to assist the user for the alignment analysis.
By simply scrolling and scanning the colors appearing in the rightmost column, the user can quickly and easily determine which regions superimpose well locally and which do not. This information is also represented in a more compact way in the Bar Diagrams.
Updated: 08/01/2025 05:42PM
