Non-Marriage Among College-Educated Adults, 2005-2019
Family Profile No. 02, 2022
Authors: Adrianne R. Brown and Wendy D. Manning
There is a well-documented educational gradient in marriage, with smaller shares never-married among the highly educated than among the less educated (FP-22-01). However, the population of college-educated individuals has increased, and there is growing heterogeneity among this population. In turn, there is likely heterogeneity in the marriage experience among those with a bachelor’s degree. This profile uses the American Community Survey (ACS) to examine the share of adults aged 35-39 with a bachelor’s degree or more by race/ethnicity and gender and, among this group, the share never-married by race/ethnicity and gender in 2005 and 2019. We focus on those aged 35-39 because this age bracket is above the median age at first marriage (the age in which at least 50% of people were married) in 2019 for college-educated men and women (FP-21-12) and is above the average age of those enrolled in higher education in the U.S. (Fishman et al., 2017).
College Education Among 35-39-Year-Olds
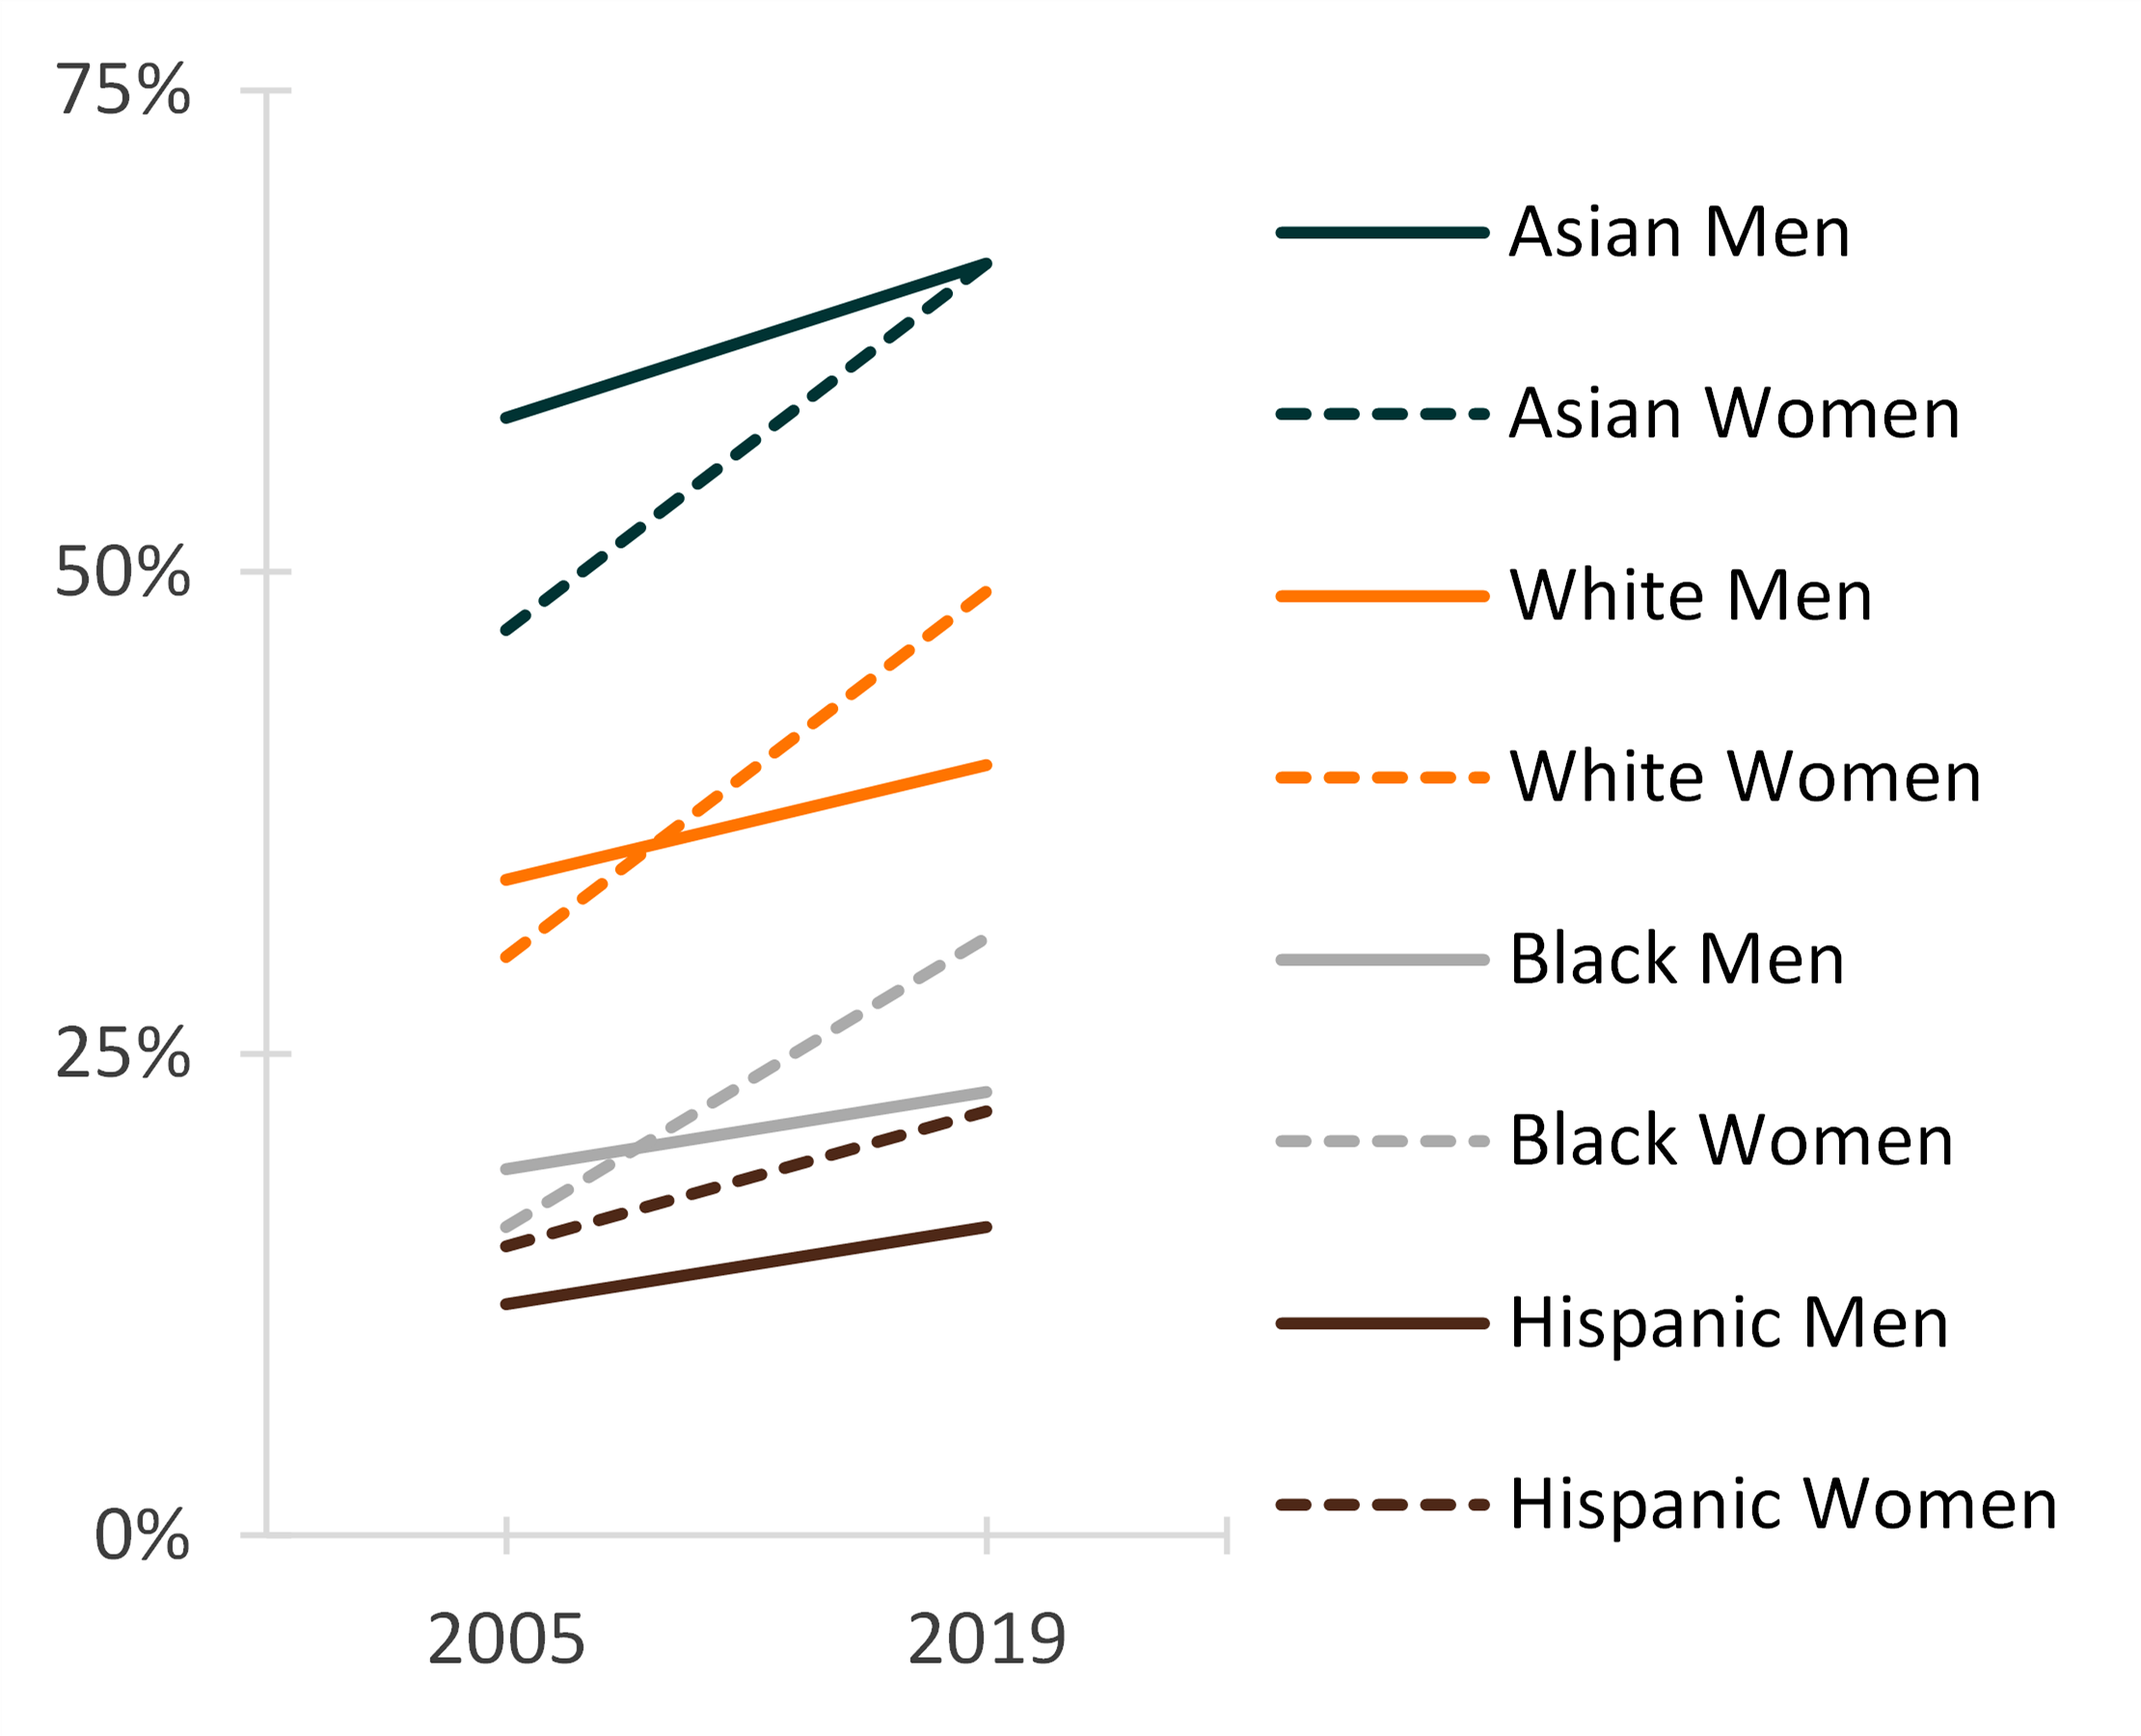
- Between 2005 and 2019, the share of adults aged 35-39 who held at least a bachelor’s degree increased for both men and women in all four of the racial/ethnic categories examined, but the magnitude of increase varied across groups.
- In 2005, larger shares of Asian, White, and Black men were college-educated compared to women.
- By 2019, this pattern was reversed for Whites and Blacks, such that larger shares of White and Black women were college-educated compared to men.
- In 2019, equal shares of Asian men and women held a bachelor’s degree or higher.
- Throughout the period, the share of Hispanic women who were college-educated was larger than that of Hispanic men.
- There was an overall race/ethnic pattern in the share college-educated that persisted throughout the period, with Asians having the largest share with at least a bachelor’s degree, followed by Whites, Blacks, and Hispanics.
Figure 1. Share of Adults Aged 35-39 with a Bachelor’s Degree or Higher by Race and Gender, 2005-2019

Non-Marriage Among College-Educated Men and Women
- Race/ethnic differentials in marriage among the college educated were greater among women than men.
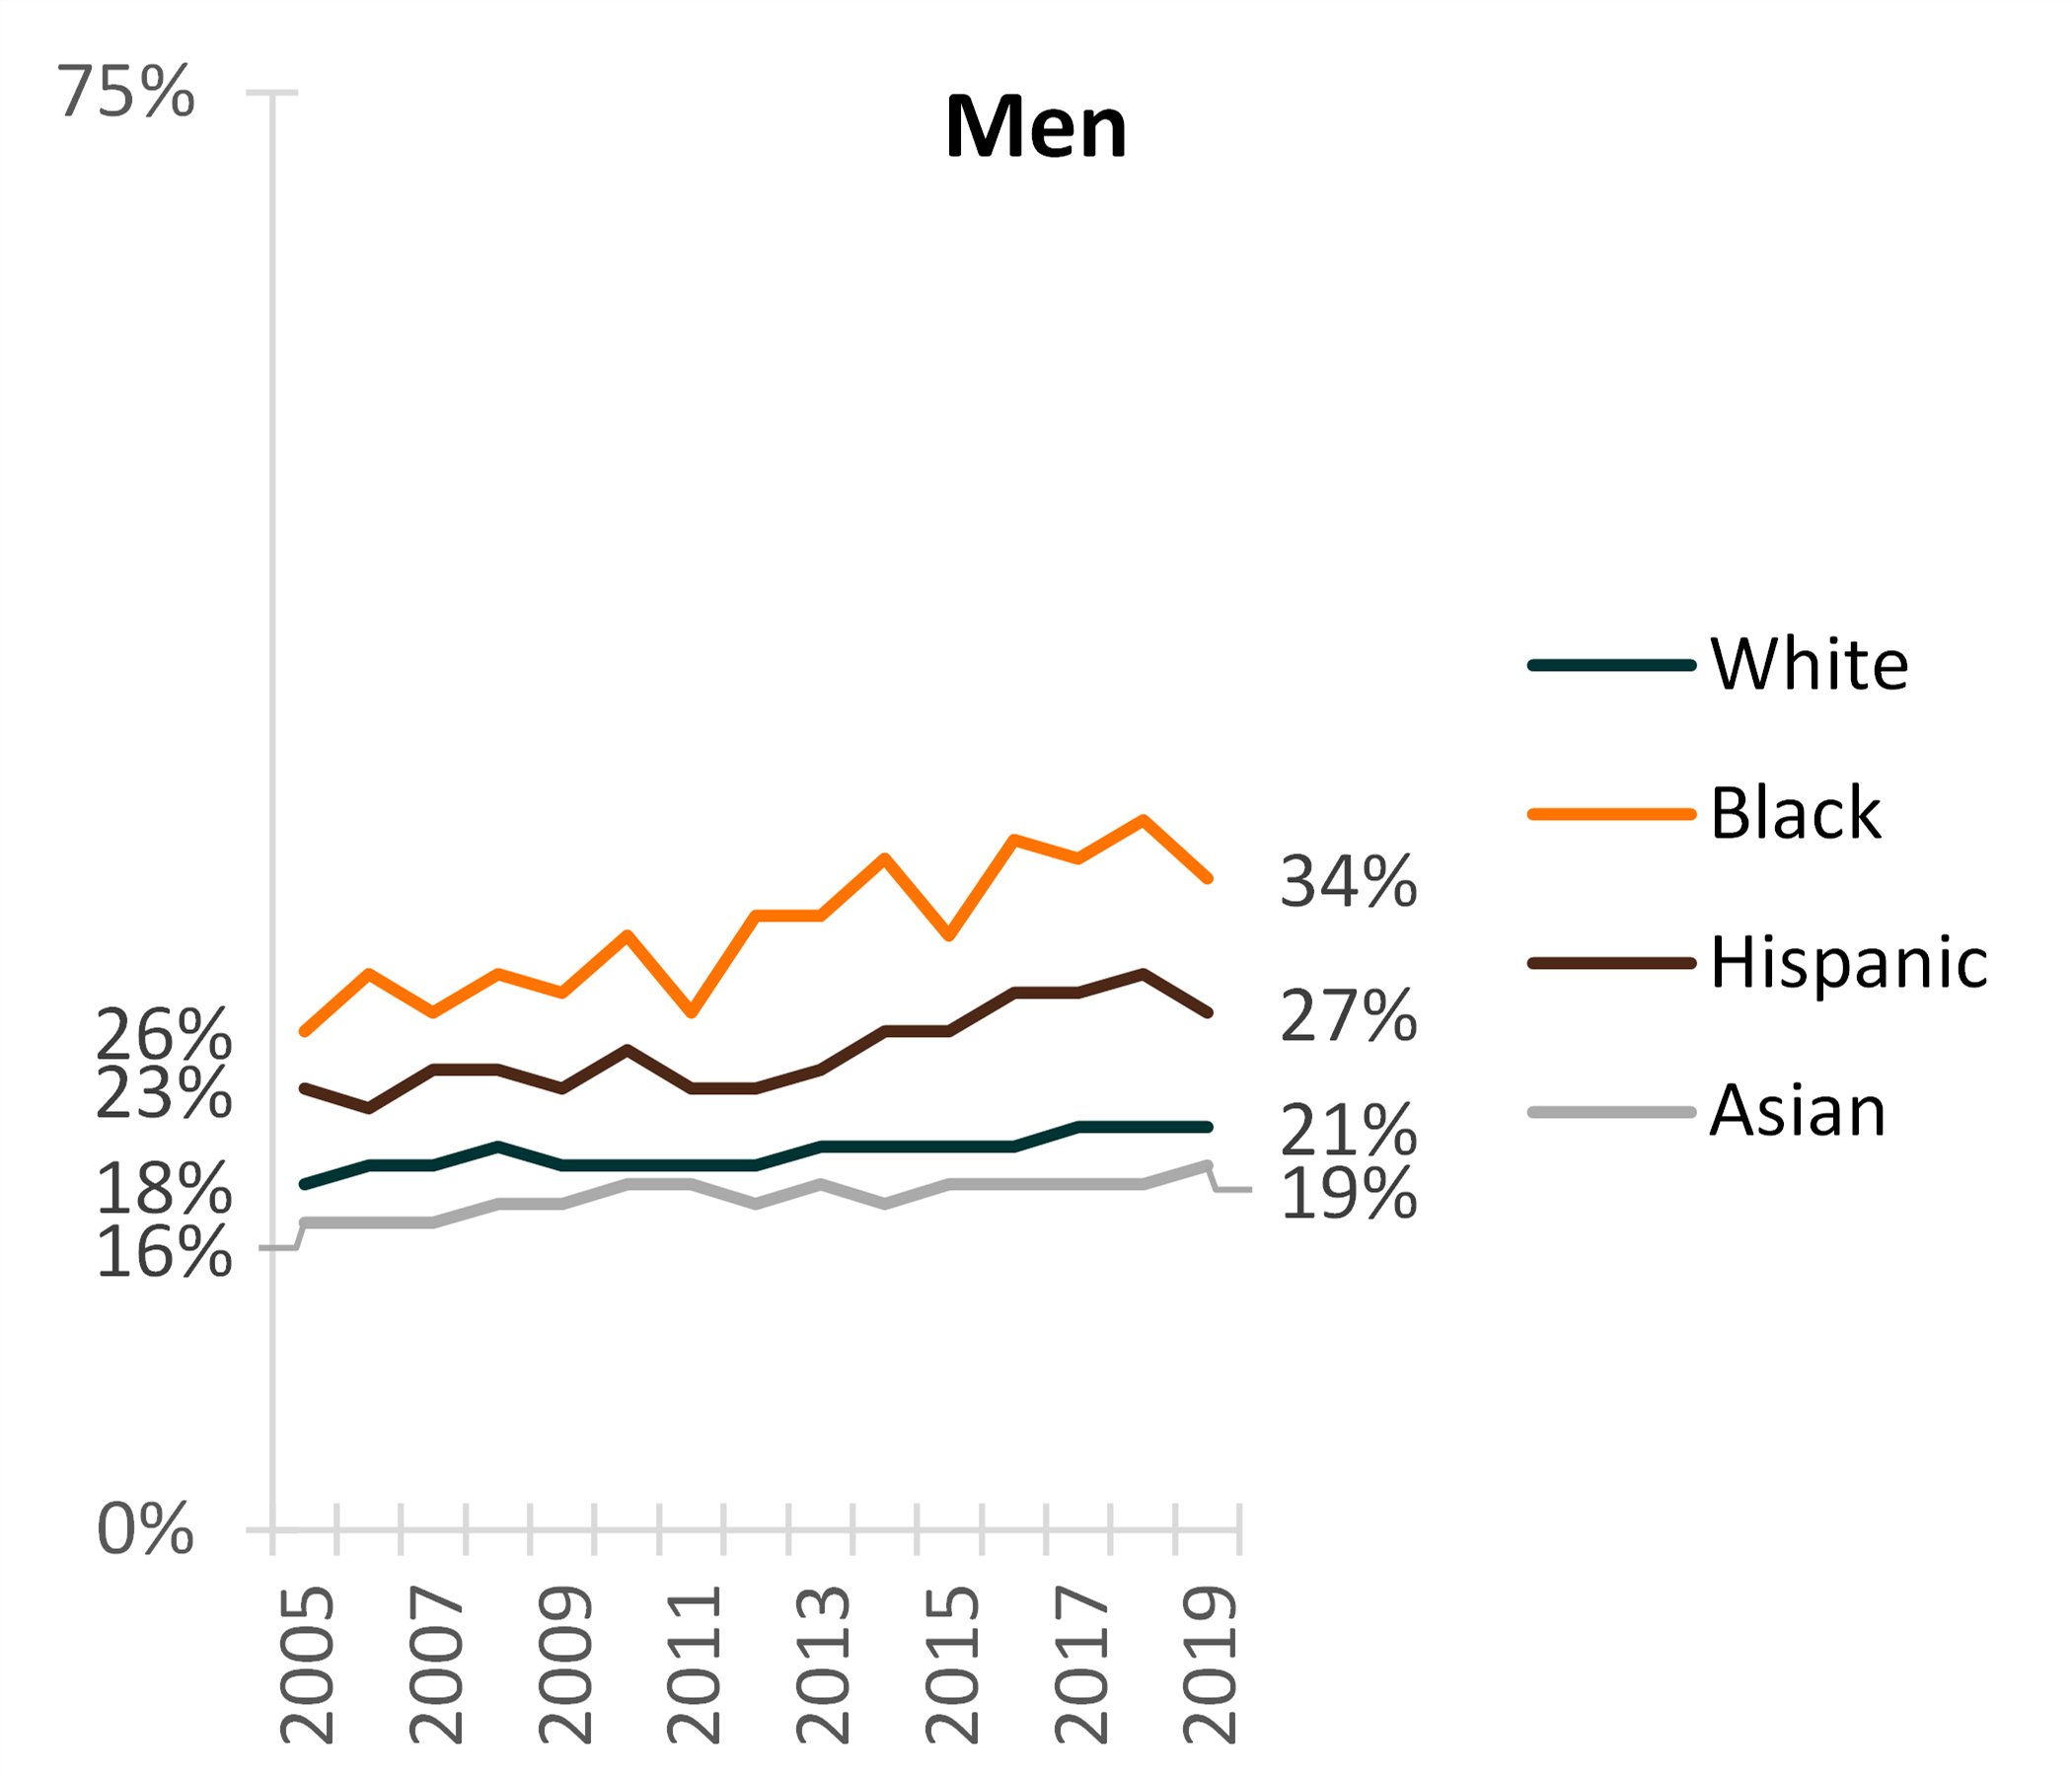
- In 2019, among college-educated men, one-third of Black men had never married (34%), followed by over a quarter of Hispanic men (27%) and two-fifths of White men (21%). The smallest share was among Asian men (19%) (Figure 2).
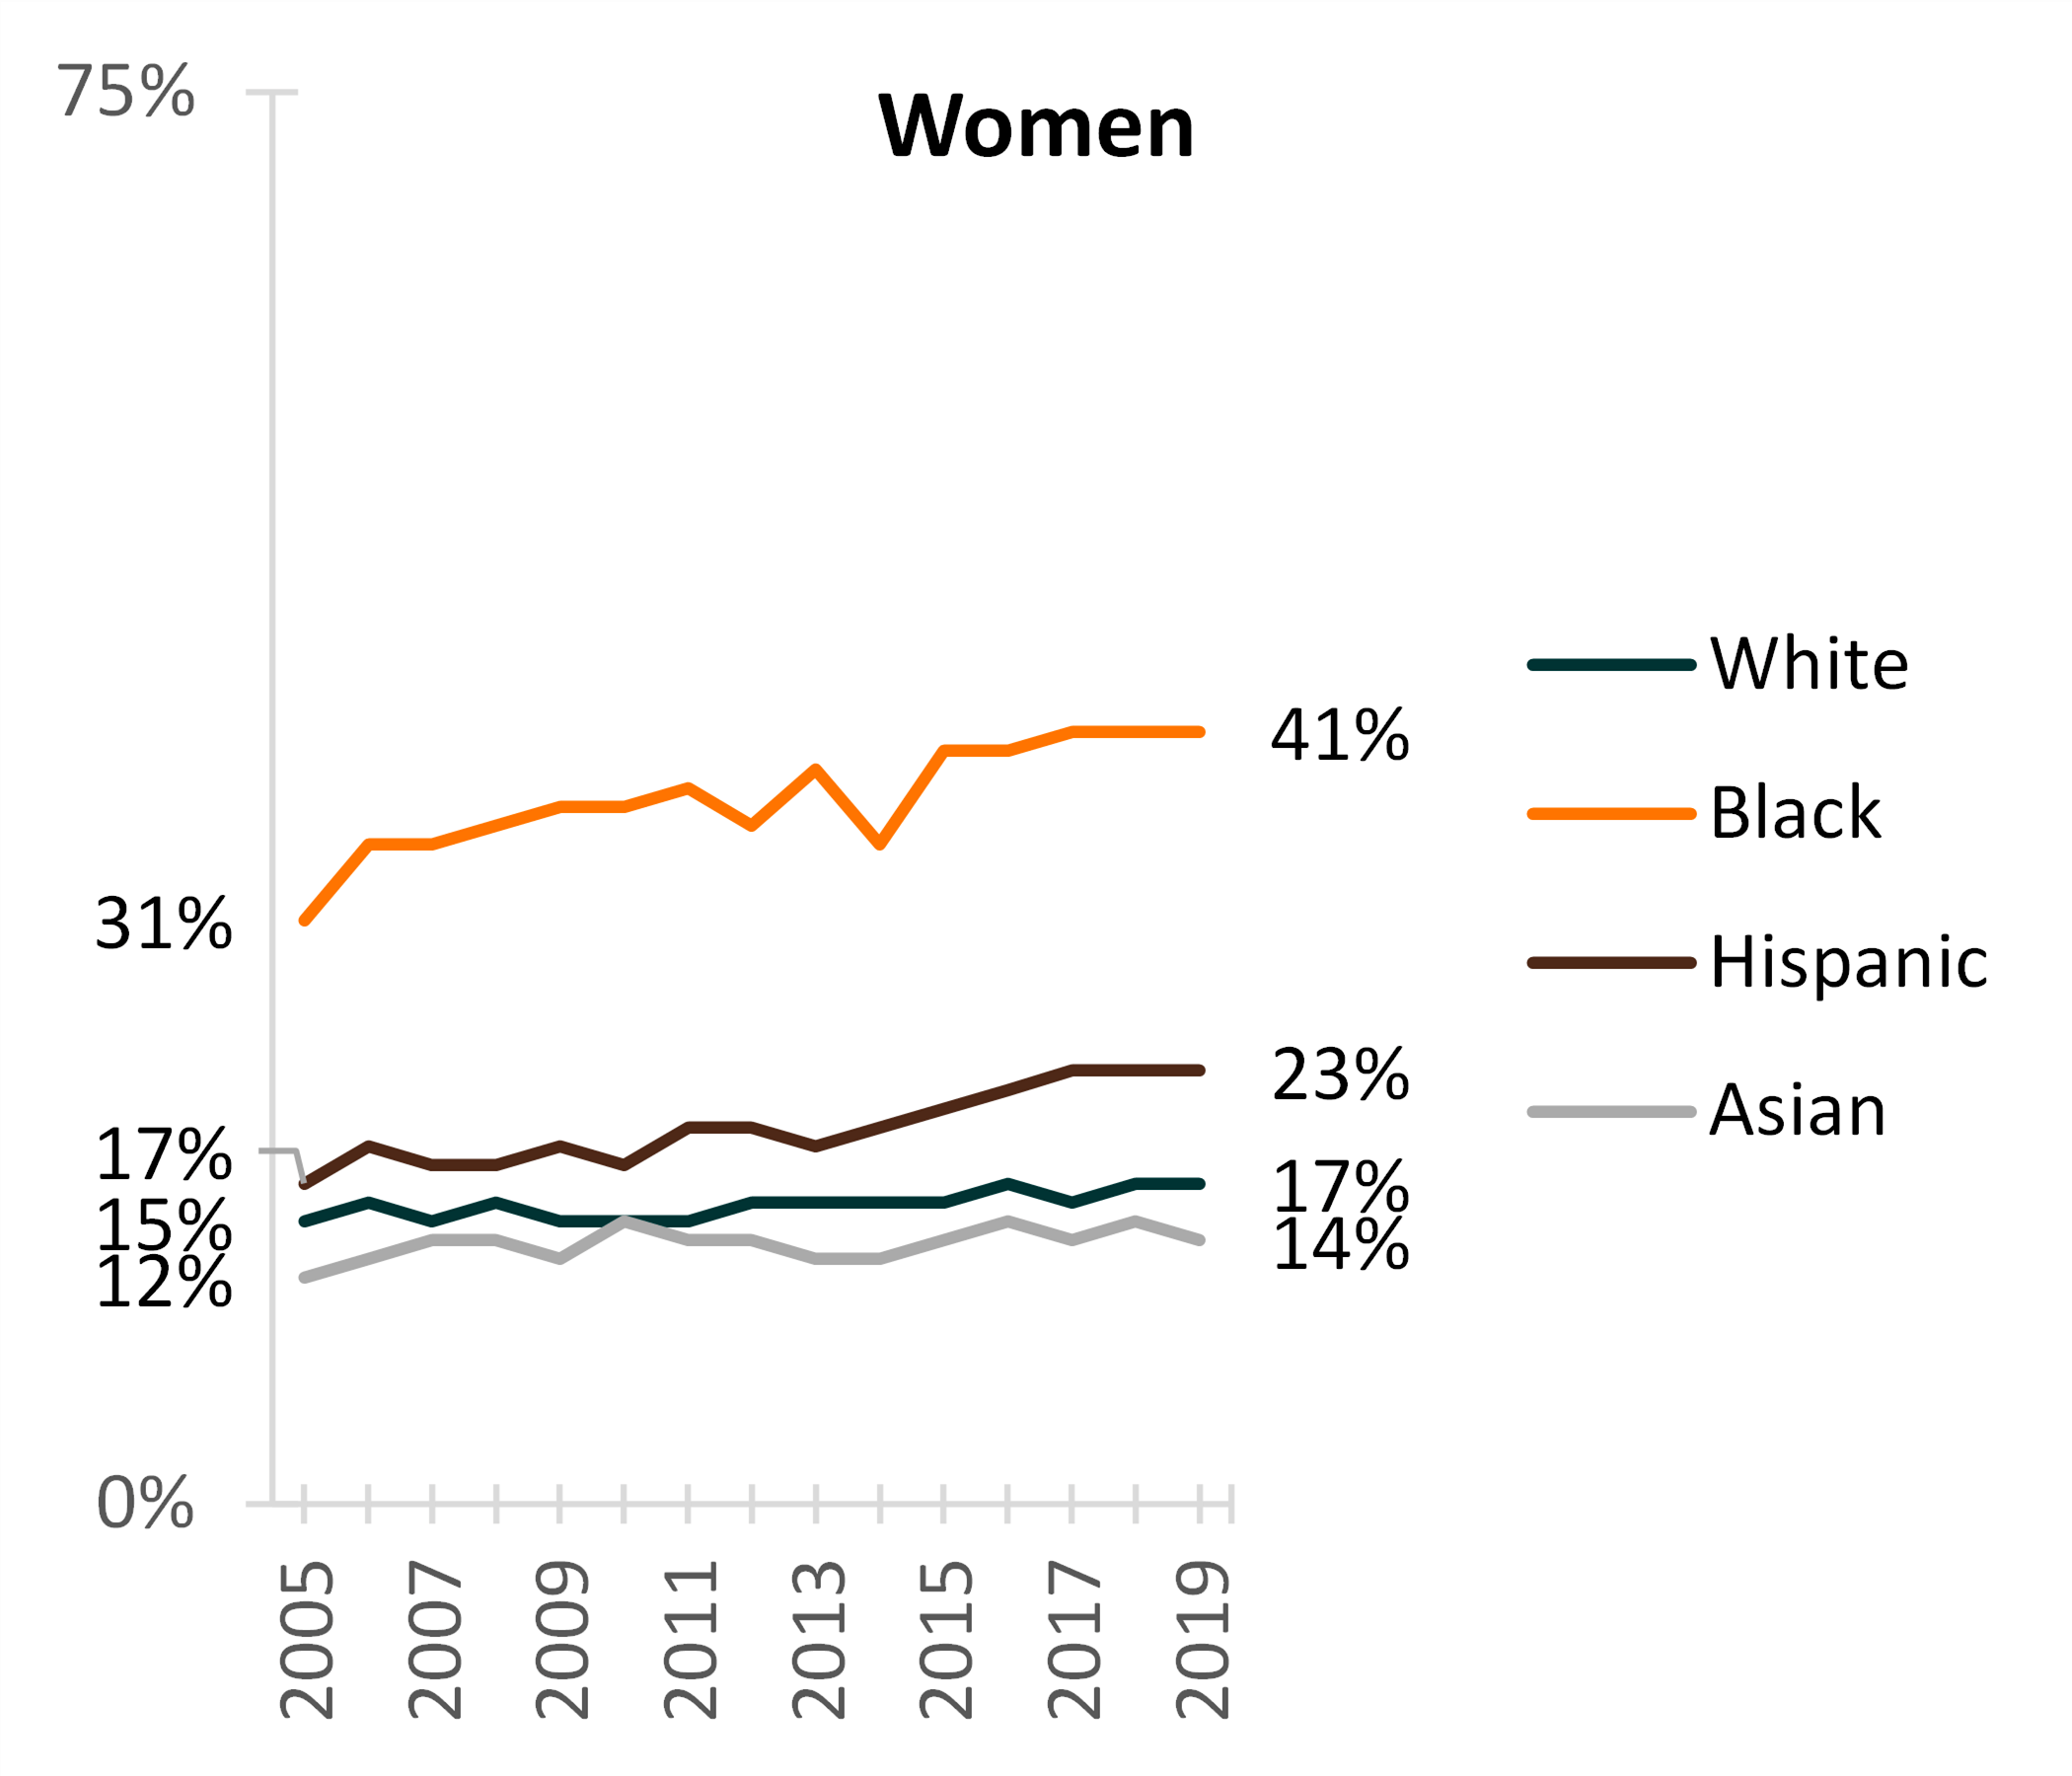
- In 2019, the share of college-educated women who had never married was highest among Black women (41%), followed by Hispanic women (23%) and White women (17%). The smallest share was among Asian women at 14% (Figure 3).
- The share of college-educated men and women who had never married increased between 2005 and 2019, and the increase occurred for Asian, Black, Hispanic, and White men and women.
- Among men, the increase was largest among Black men and smallest among Asian and White men.
Among women, the increase in the share never-married was greatest among Black women and smallest among Asian and White women.
- Among men, the increase was largest among Black men and smallest among Asian and White men.
- In both 2005 and 2019, the share of college-educated men aged 35-39 who had never married was higher than the share never-married among women for White, Hispanic, and Asian adults. In contrast, among college-educated Black adults, the share of never-married was greater among women than men.
Figure 2. Share of Men Aged 35-39 with a Bachelor’s Degree or Higher who Never Married by Race, 2005-2019

Figure 3. Share of Women Aged 35-39 with a Bachelor’s Degree or Higher who Never Married by Race, 2005-2019

Source: NCFMR calculations of the American Community Survey 1-year estimates, 2005-2019
Data Source:
- Ruggles, S. Flood, S., Foster, S., Goeken, R., Pacas, J., Schouweiler, M., & Sobek, M. (2021). IPUMS USA: Version 11.0 [dataset]. Minneapolis, MN: IPUMS. https://doi.org/10.18128/D010.V11.0
References:
- Brown, A. R. (2022). Trends in Non-Marriage Among Men, 2005-2019. Family Profiles, FP-22-01. Bowling Green, OH: National Center for Family & Marriage Research. https://doi.org/10.25035/ncfmr/fp-22-01
- Fishman, R., Ekowo, M., & Ezeugo, E. (2017). Perception vs. reality: The typical college student. New America.
- Payne, K. K. (2019). Median age at first marriage, 2019. Family Profiles, FP-21-12. Bowling Green, OH: National Center for Family & Marriage Research. https://doi.org/10.25035/ncfmr/fp-21-12
Suggested Citation:
- Brown, A. R. & Manning, W. D. (2022). Non-Marriage Among College-Educated Adults, 2005-2019. Family Profiles, FP-22-02. Bowling Green, OH: National Center for Family & Marriage Research. https://doi.org/10.25035/ncfmr/fp-22-02
Updated: 11/07/2025 02:58PM


