Gray Divorce Rate in the U.S.: Geographic Variation, 2017
Family Profile No. 20, 2019
Author: Colette Allred
Although the overall divorce rate in the U.S. has declined, among those aged 50 and older it has roughly doubled since 1990 (FP-19-13; Brown & Lin, 2012). In this Family Profile, we estimate the national trend in divorce rates for adults aged 50 and older (“gray divorce”) using the 1990 U.S. Vital Statistics Report and 1-year estimates from the American Community Survey (ACS) for the years 2008 to 2017 (the most recently available data). To examine state-level variation, we employ the 2013-2017, 5-year estimates from the ACS. This Family Profile supplements previously published profiles documenting the geographic variation in divorce rate overall (FP-17-24; FP-18-21).
The Gray Divorce Rate, 2017*
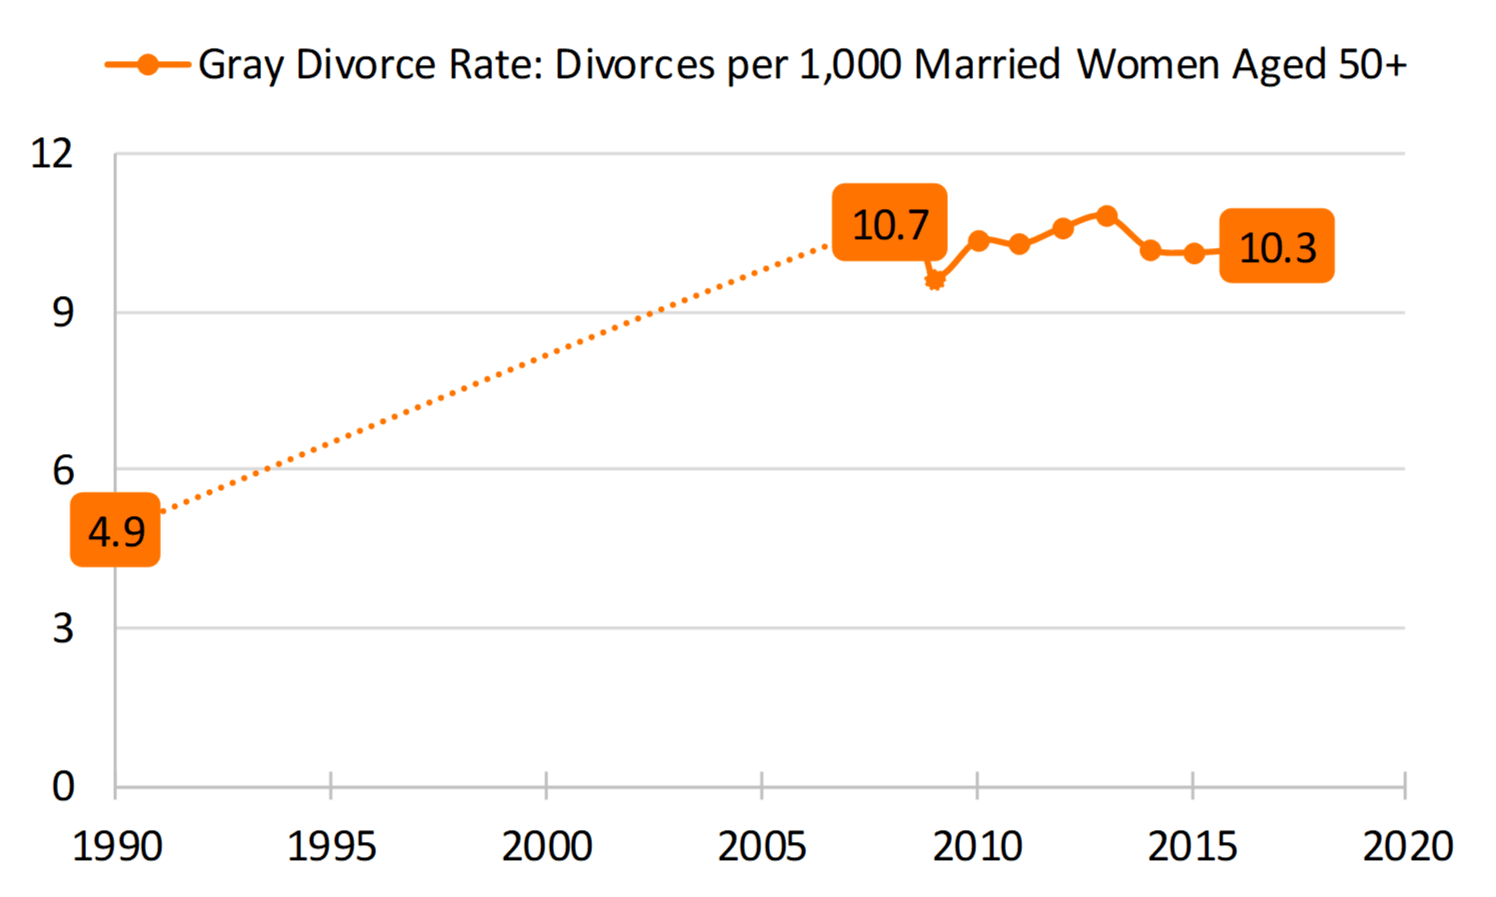
- The gray divorce rate (represented as the number of divorces per 1,000 married women aged 50 and older) increased more than twofold between 1990 (4.9) and 2008 (10.7).
- Since 2008, the gray divorce rate has decreased slightly from 10.7 divorces per 1,000 married women aged 50 and older to 10.3.
- In 2017, 344,755 women aged 50 and older divorced.
*The gray divorce rate = [(number of women aged 50+ divorced in the past 12 months) / (number of women aged 50+ divorced in the past 12 months + number of currently married women aged 50+)] * 1,000
Figure 1. Women's Gray Divorce Rate, 1990-2017

Source: NCFMR analyses of 1990 National Center for Health Statistics; 2008-2017 U.S. Census Bureau, American Community Survey, 1-yr est.
Five Highest and Lowest Gray Divorce Rates, 2017
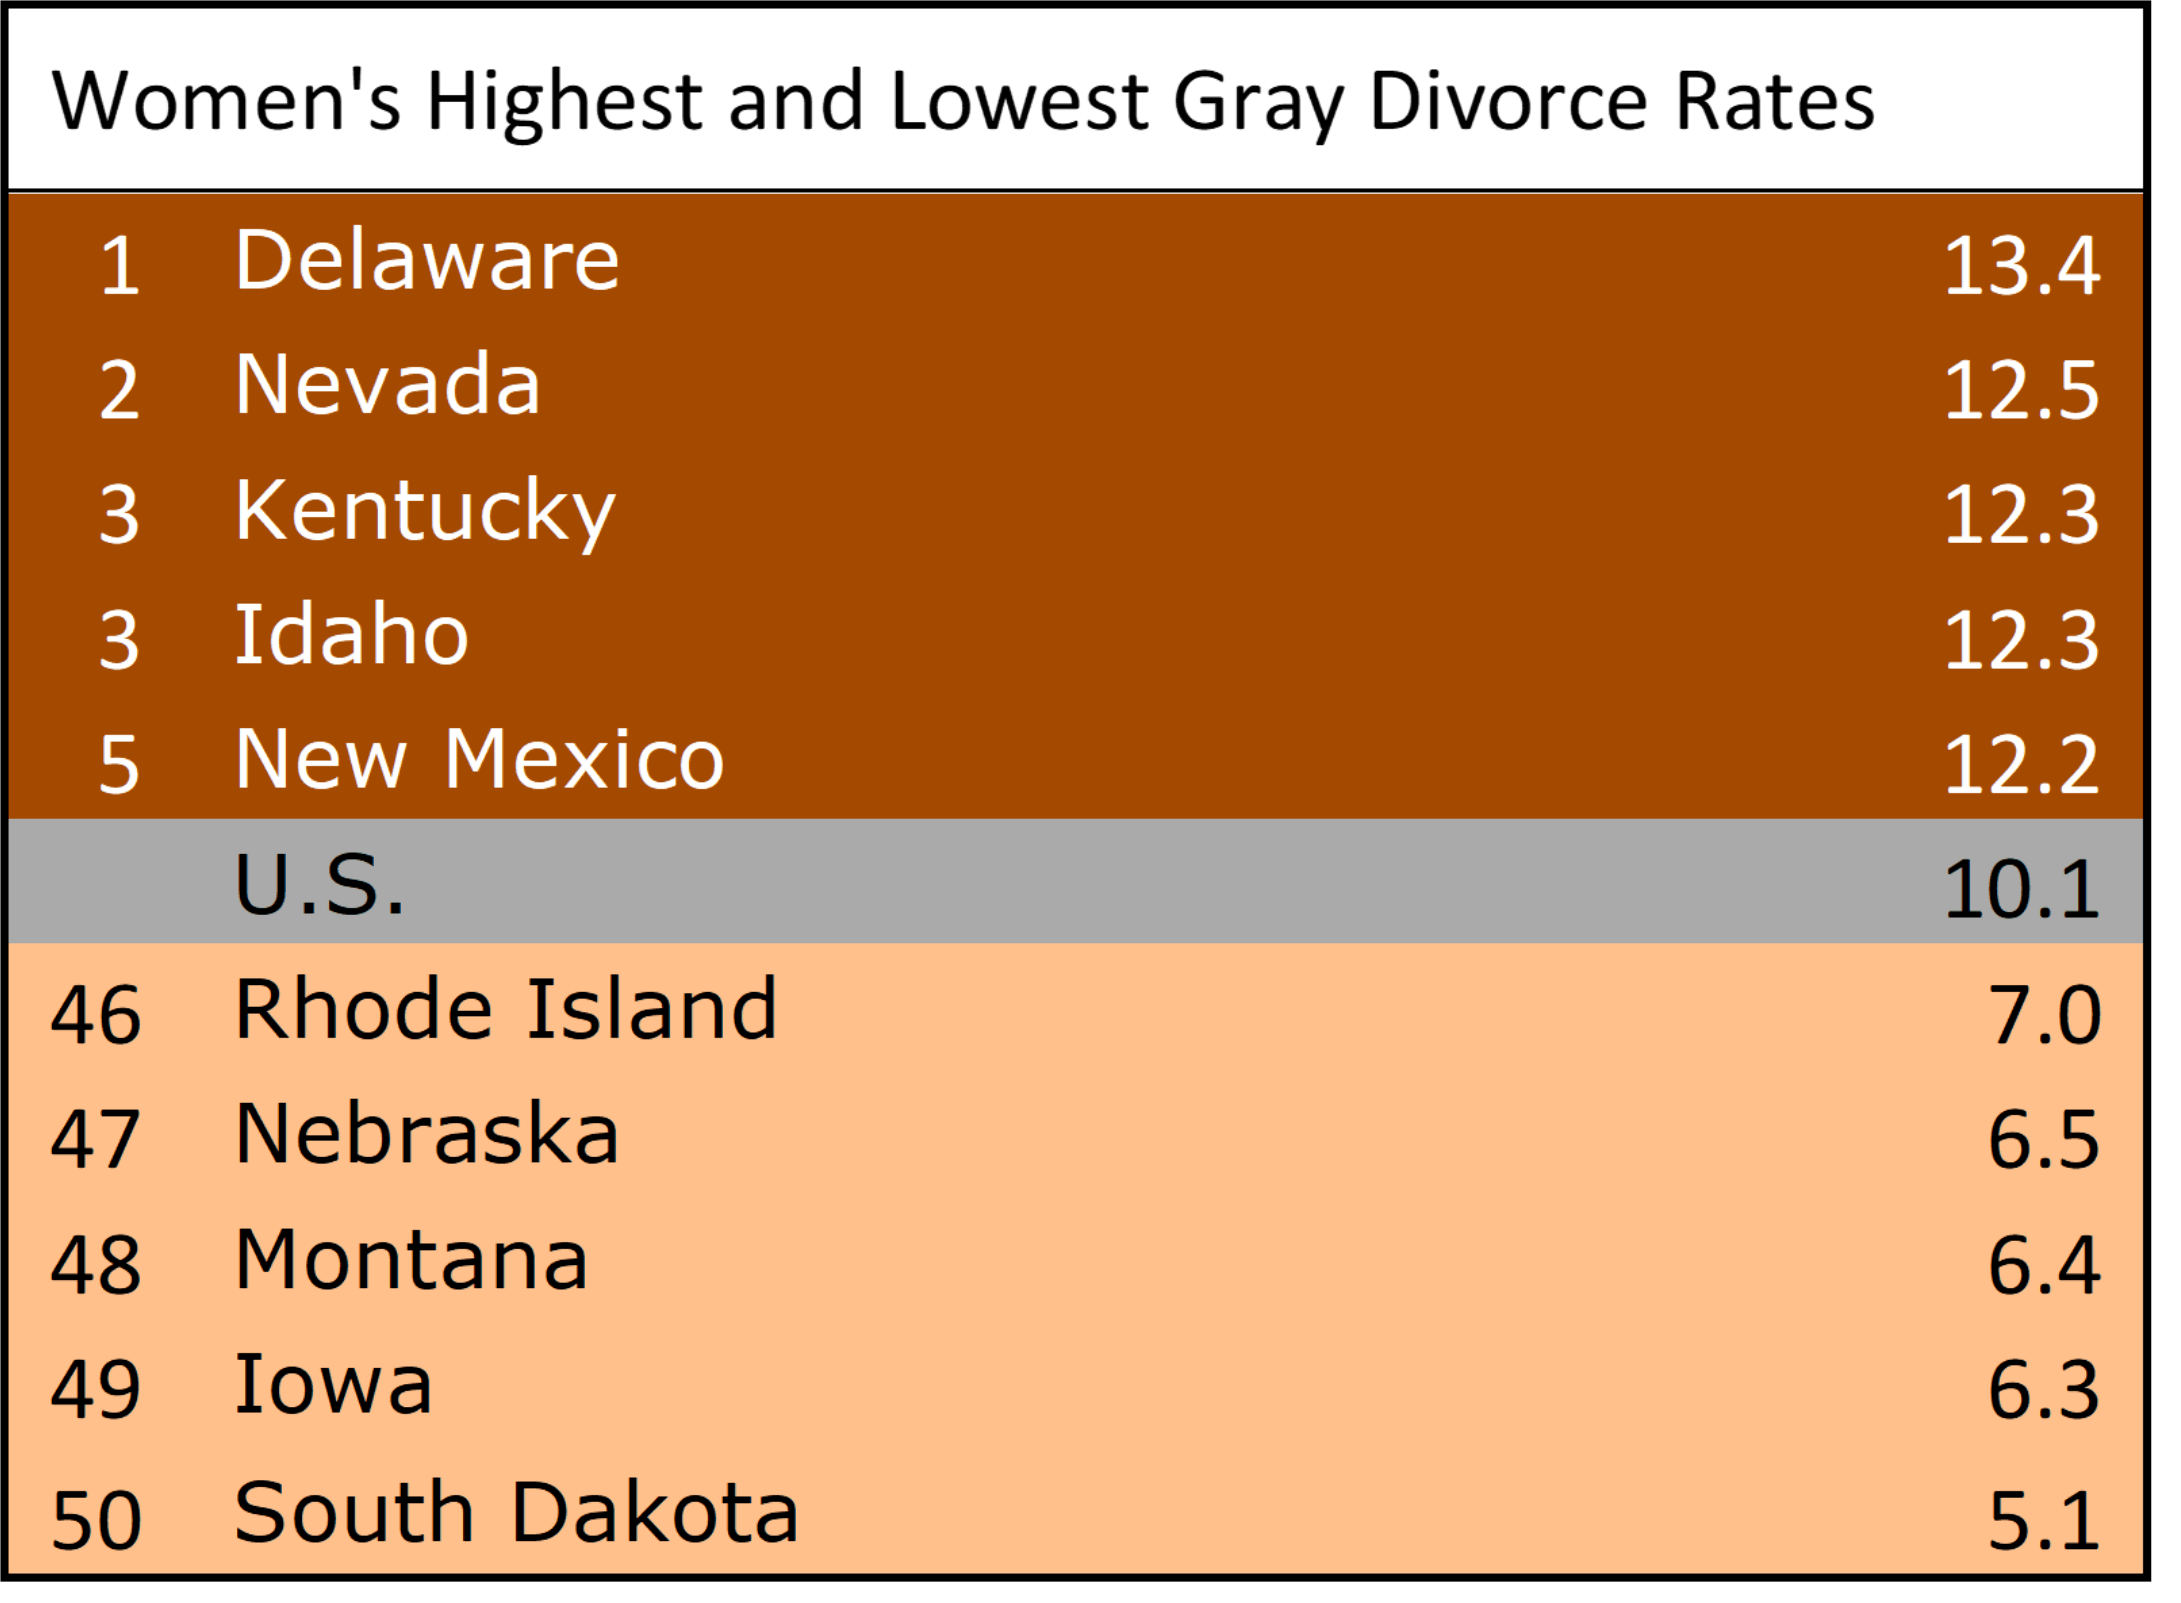
- South Dakota had the lowest gray divorce rate, with about 5 marriages per 1,000 ending in divorce among women aged 50 and older.
- Delaware had the highest gray divorce rate in 2017, with over 13 marriages per 1,000 ending in divorce among women aged 50 and older.
- Delaware’s gray divorce rate was more than twice the rate of South Dakota’s.
Figure 2: Women's Highest and Lowest Gray Divorce Rates

Source: NCFMR analyses of 2017 U.S. Census Bureau, American Community Survey, 5-yr est.
State Rankings in Gray Divorce Rates, 2017
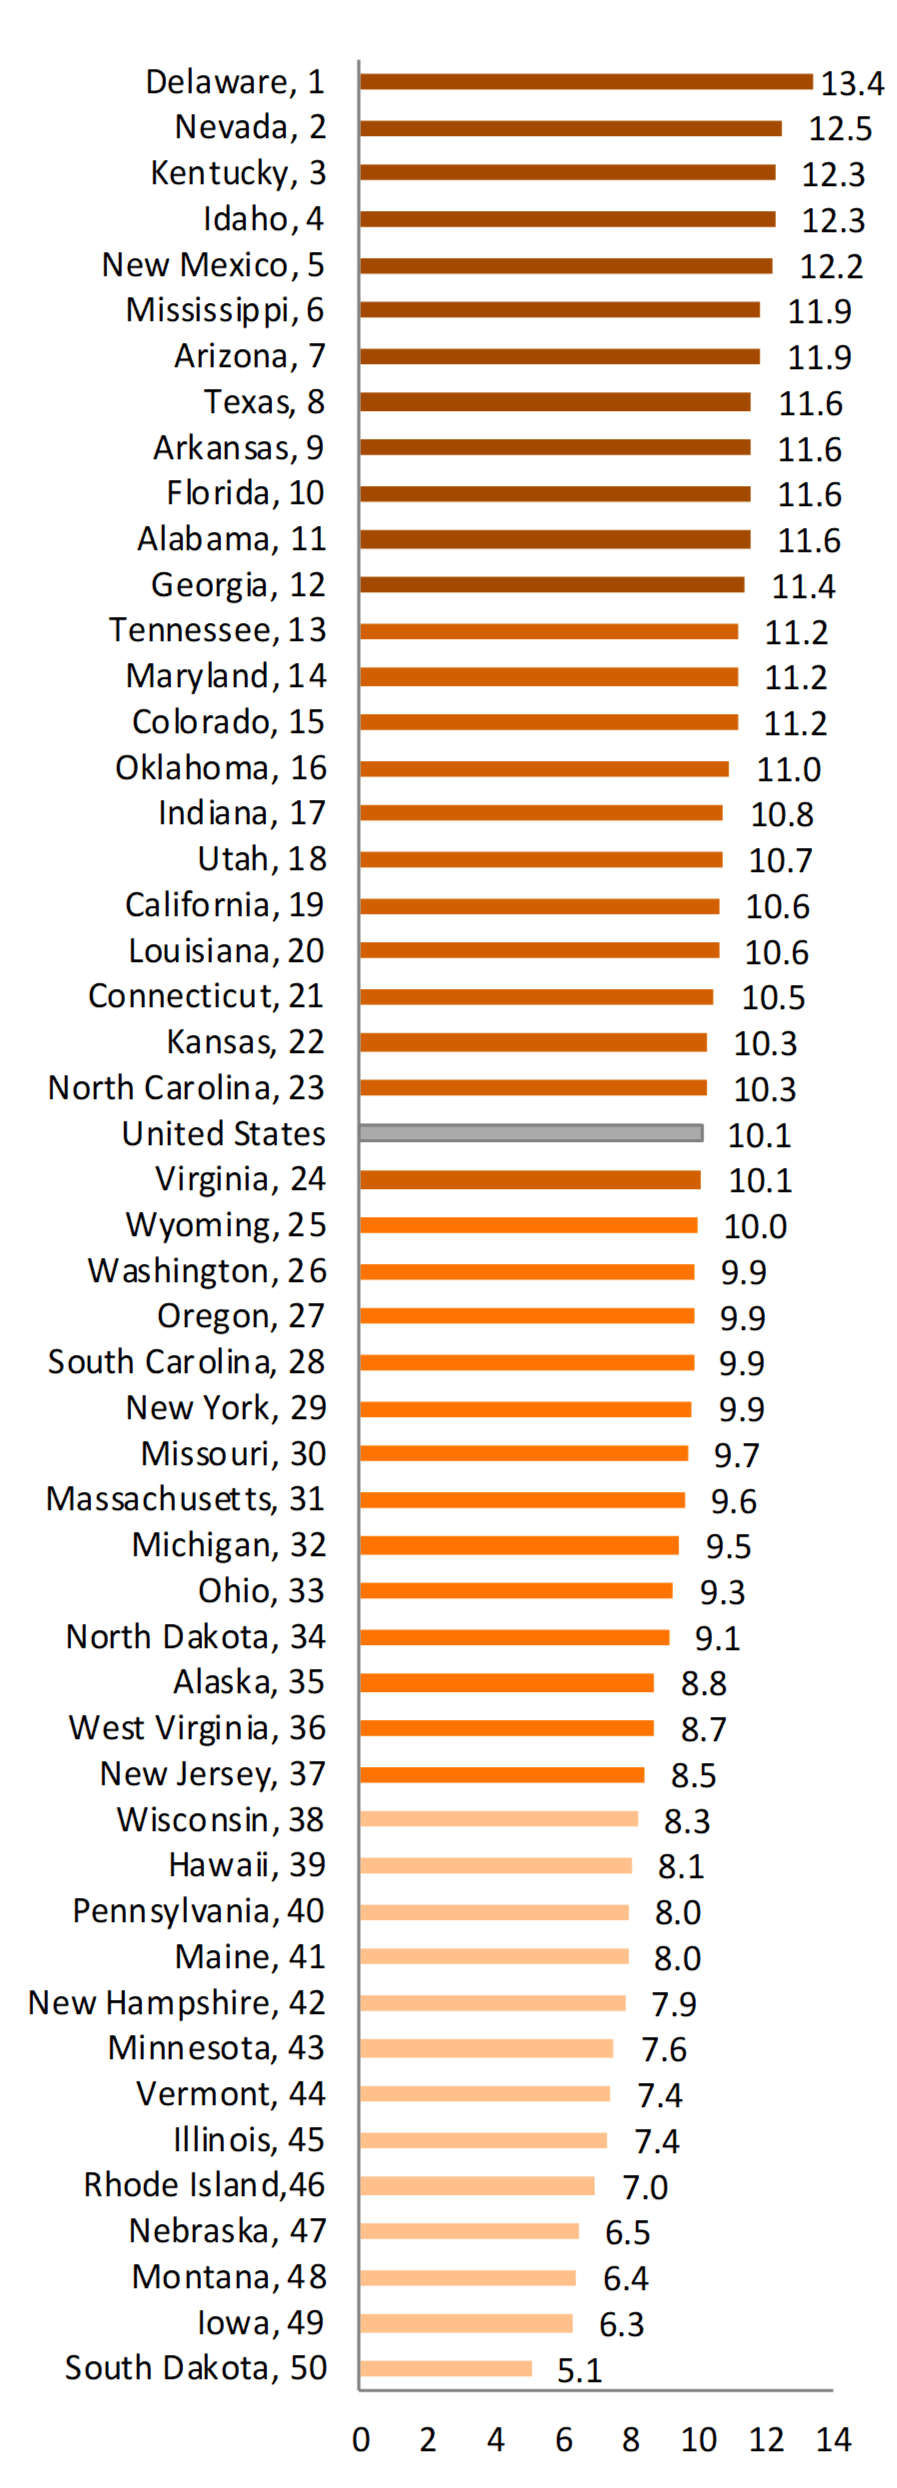
Figure 3. State Variation in the Divorce Rate per 1,000 Married Women Aged 50+ by Quartile, 2017

- The 12 states with the highest gray divorce rates (making up the 1st quartile) had rates of at least 11.4 divorces per 1,000 married women aged 50 and older in 2017.
- The 13 states that experienced the lowest gray divorce rates (making up the 4th quartile) in 2017 had fewer than 8.5 divorces per 1,000 women aged 50 and older.
- The gray divorce rates observed in North Carolina and Virginia were most similar to that of the overall gray divorce rate in the United States (10.1).
Source: NCFMR analyses of U.S. Census Bureau, 2017 American Community Survey, 5-yr est.
Geographic Variation in Gray Divorce Rates, 2017
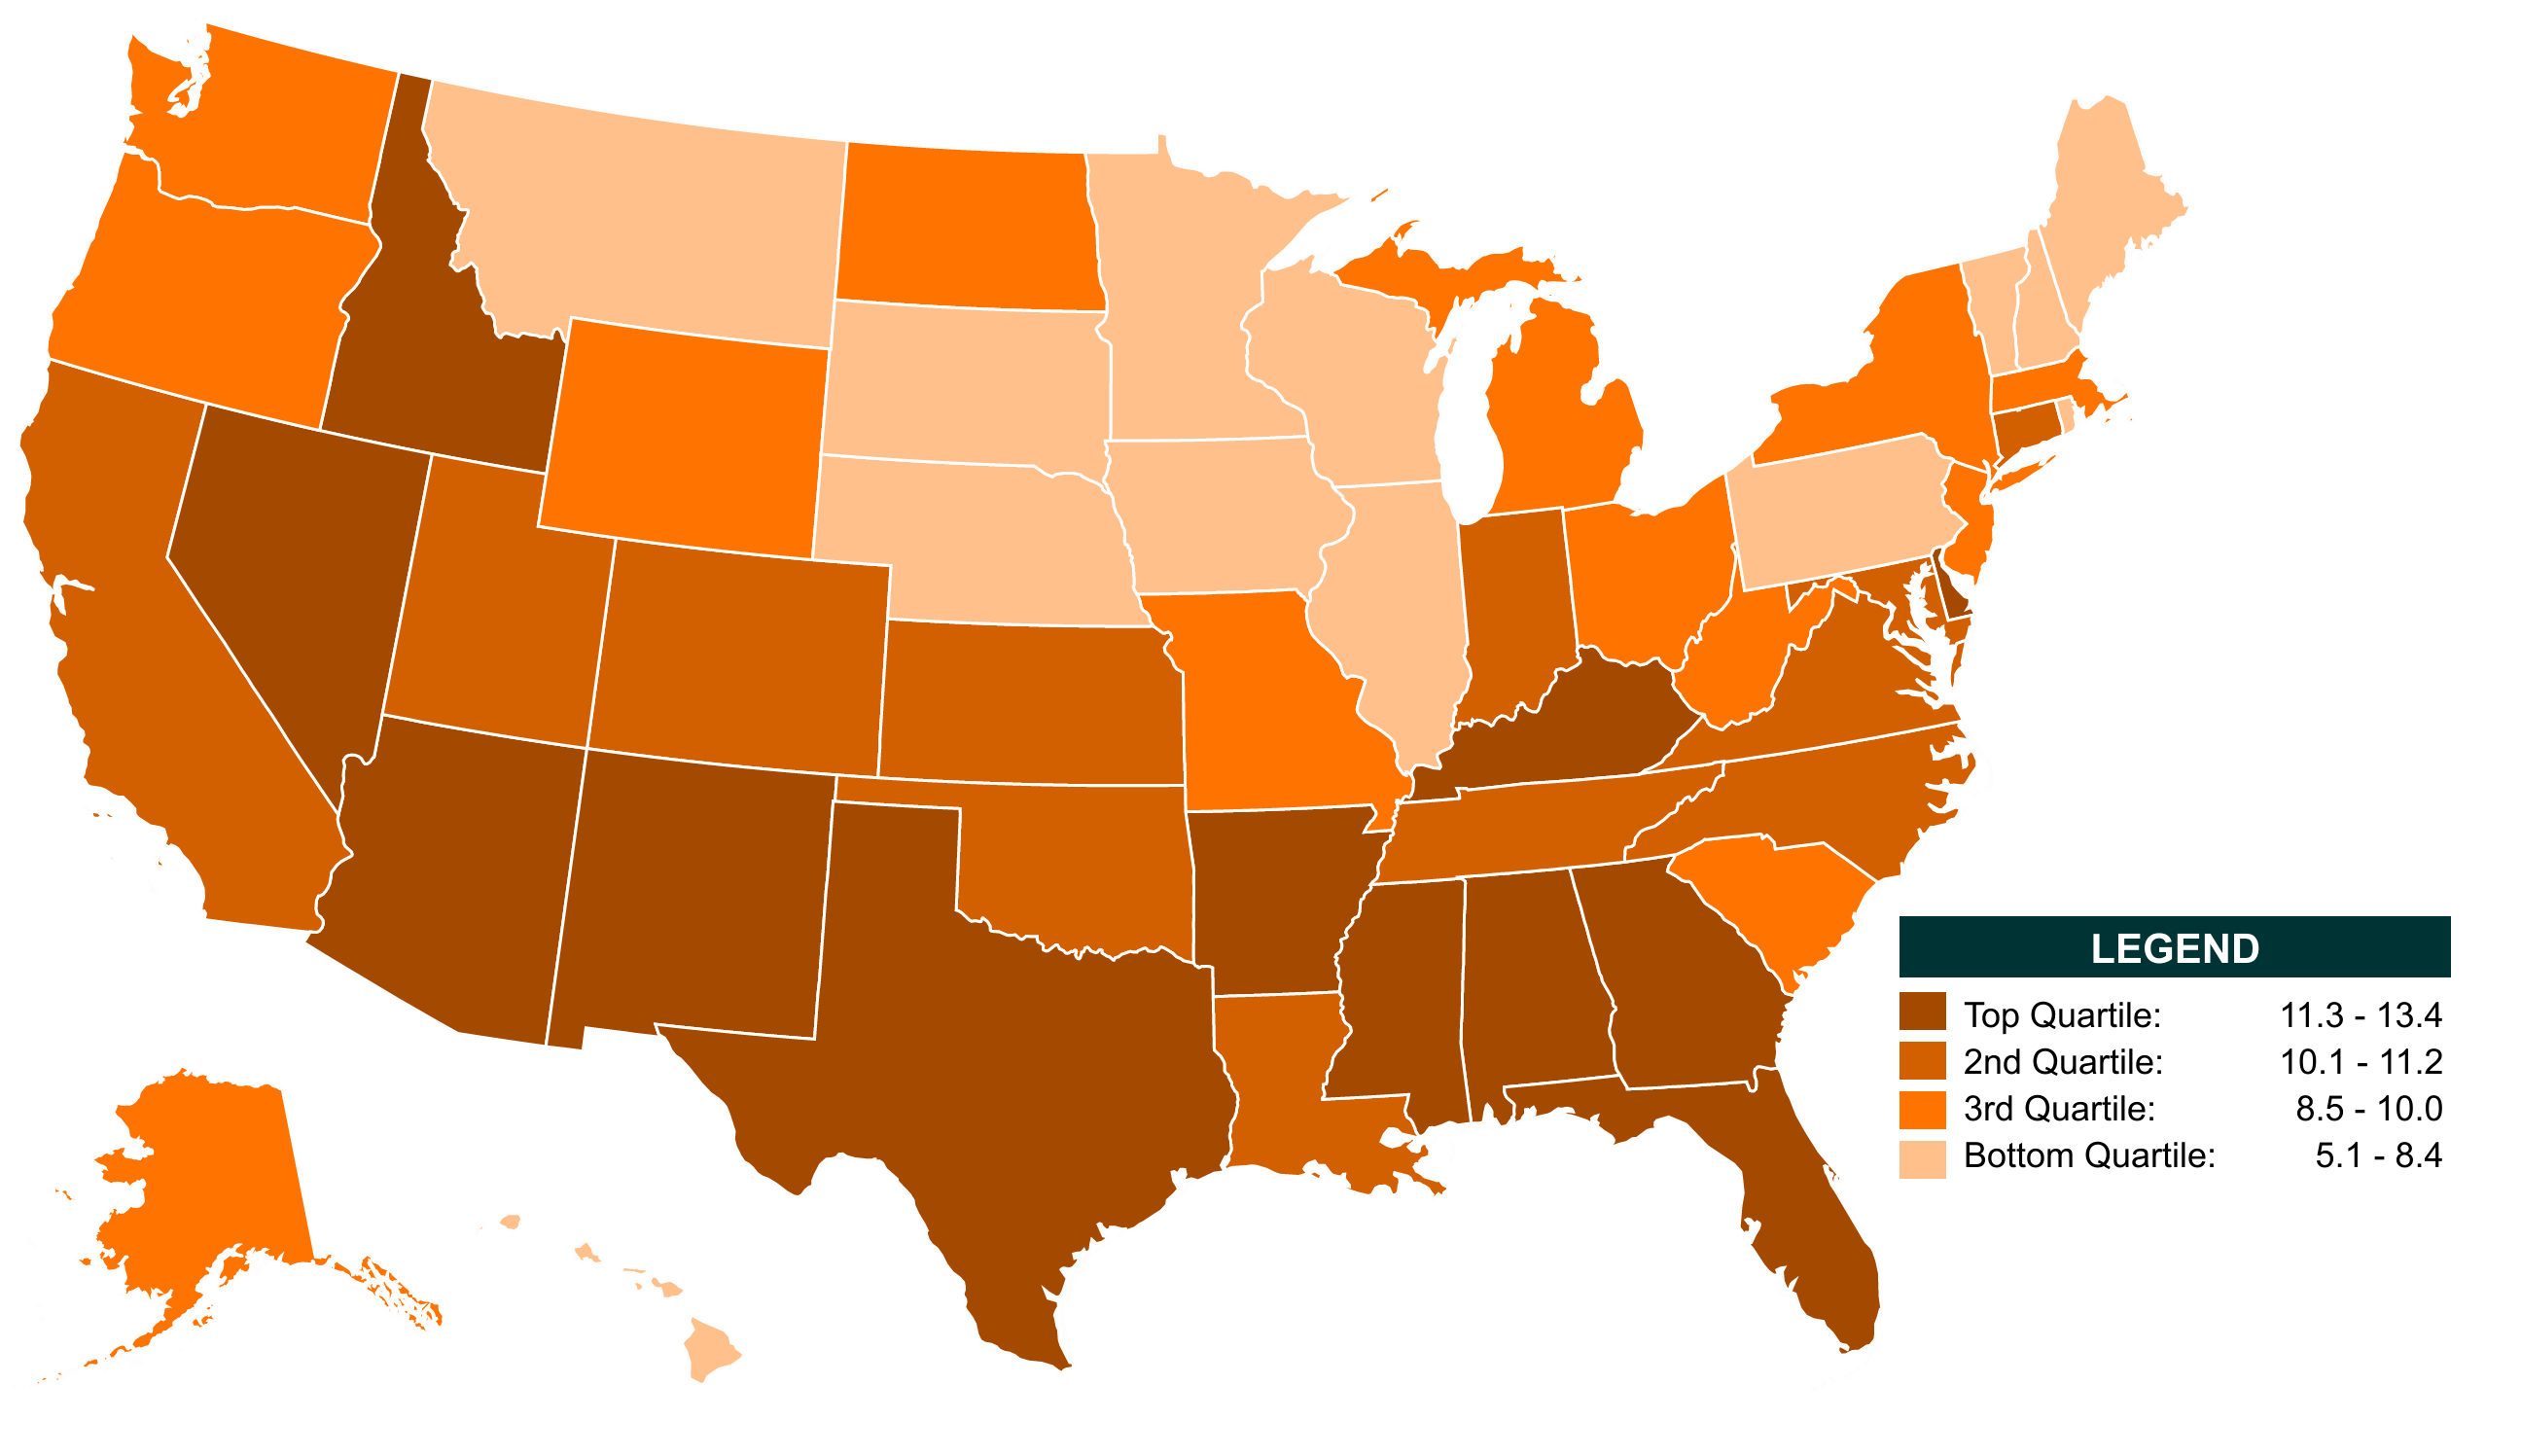
- States with the highest gray divorce rates (in the 1st or 2nd quartile) were predominantly found in the Southern and Western regions of the country.
- Exceptions include Washington, Oregon, Montana, Wyoming, West Virginia, and South Carolina, which experienced gray divorce rates in the 3rd or 4th quartiles.
- States with the lowest gray divorce rates (in the 3rd or 4th quartiles) were located in the Midwest and Northeast regions of the United States.
- Exceptions include Kansas, Indiana, and Connecticut, which were in the first two quartiles of gray divorce rates.
Figure 4. Geographic Variation of Women’s Gray Divorce Rate, 2017

Source: NCFMR analyses of U.S. Census Bureau, 2017 American Community Survey, 5-yr est.
Data Sources
- Clarke. S. C. (1995). Advanced report of final marriage statistics, 1989 and 1990. Monthly Vital Statistics Report, 42(12). National Center for Health Statistics. https://www.cdc.gov/nchs/data/mvsr/supp/mv43_12s.pdf
- Ruggles, S., Flood, S., Goeken, R., Grover, J., Meyer, E., Pacas, J., & Sobek, M. (2019). IPUMS USA: Version 9.0 [2013-2017, ACS 5-yr]. Minneapolis, MN: IPUMS. https://doi.org/10.18128/D010.V9.0
- Ruggles, S., Flood, S., Goeken, R., Grover, J., Meyer, E., Pacas, J., & Sobek, M. (2019). IPUMS USA: Version 9.0 [2017 ACS]. Minneapolis, MN: IPUMS. https://doi.org/10.18128/D010.V9.0
References
- Allred, C. (2019). Age variation in the divorce rate, 1990 & 2017. Family Profiles, FP-19-13. Bowling Green, OH: National Center for Family & Marriage Research.
- Brown, S. L., & Lin, I.- F., (2012). The gray divorce revolution: rising divorce among middle-aged and older adults, 1990–2010. Journals of Gerontology Series B: Psychological Sciences and Social Sciences, 67(6), 731-741.
- Hemez, P. (2017). Divorce rate in the U.S.: Geographic variation, 2016. Family Profiles, FP-17-24. Bowling Green, OH: National Center for Family & Marriage Research. https://doi.org/10.25035/ncfmr/fp-17-24.
- Schweizer, V. (2018). Divorce rate in the U.S.: Geographic variation, 2017. Family Profiles, FP-18-21. Bowling Green, OH: National Center for Family & Marriage Research. https://doi.org/10.25035/ncfmr/fp-18-21.
Suggested Citation
- Allred, C. (2019). Gray divorce rate in the U.S.: Geographic variation, 2017. Family Profiles, FP-19-20. Bowling Green, OH: National Center for Family & Marriage Research. https://doi.org/10.25035/ncfmr/fp-19-20.
Updated: 11/07/2025 02:32PM

