“Solo” and “Nonsolo” Single-Parent Households in the U.S., 2021
Family Profile No. 17, 2022
Author: Corrine E. Wiborg
Many parents are single parents; that is, raising a child but not living with the child’s other biological parent or a romantic partner. Being a single parent, though, does not mean that parents are living alone with their children. They may be living with other family members or roommates. In this Family Profile, we focus on resident mothers and fathers (i.e., living with at least one minor child) who are single (not married or cohabiting). We distinguish between “single, solo parents – single parents who are raising their minor children alone (with no spouse, cohabiting partner, parent, sibling, adult child, or roommate in their home) – and “single, nonsolo parents” – single parents who are living with another individual over the age of 18. Using data from the 2021 ASEC Current Population Survey from IPUMS-CPS, we identify the prevalence of solo parenthood and examine demographic characteristics including parental gender, marital history, educational attainment, and race and ethnicity (FP-17-17; FP-18-06; FP-21-26). For brevity, throughout this profile resident single, nonsolo parents will be referred to as "nonsolo" and resident single, solo parents will be referred to as "solo."
Resident Single Parents
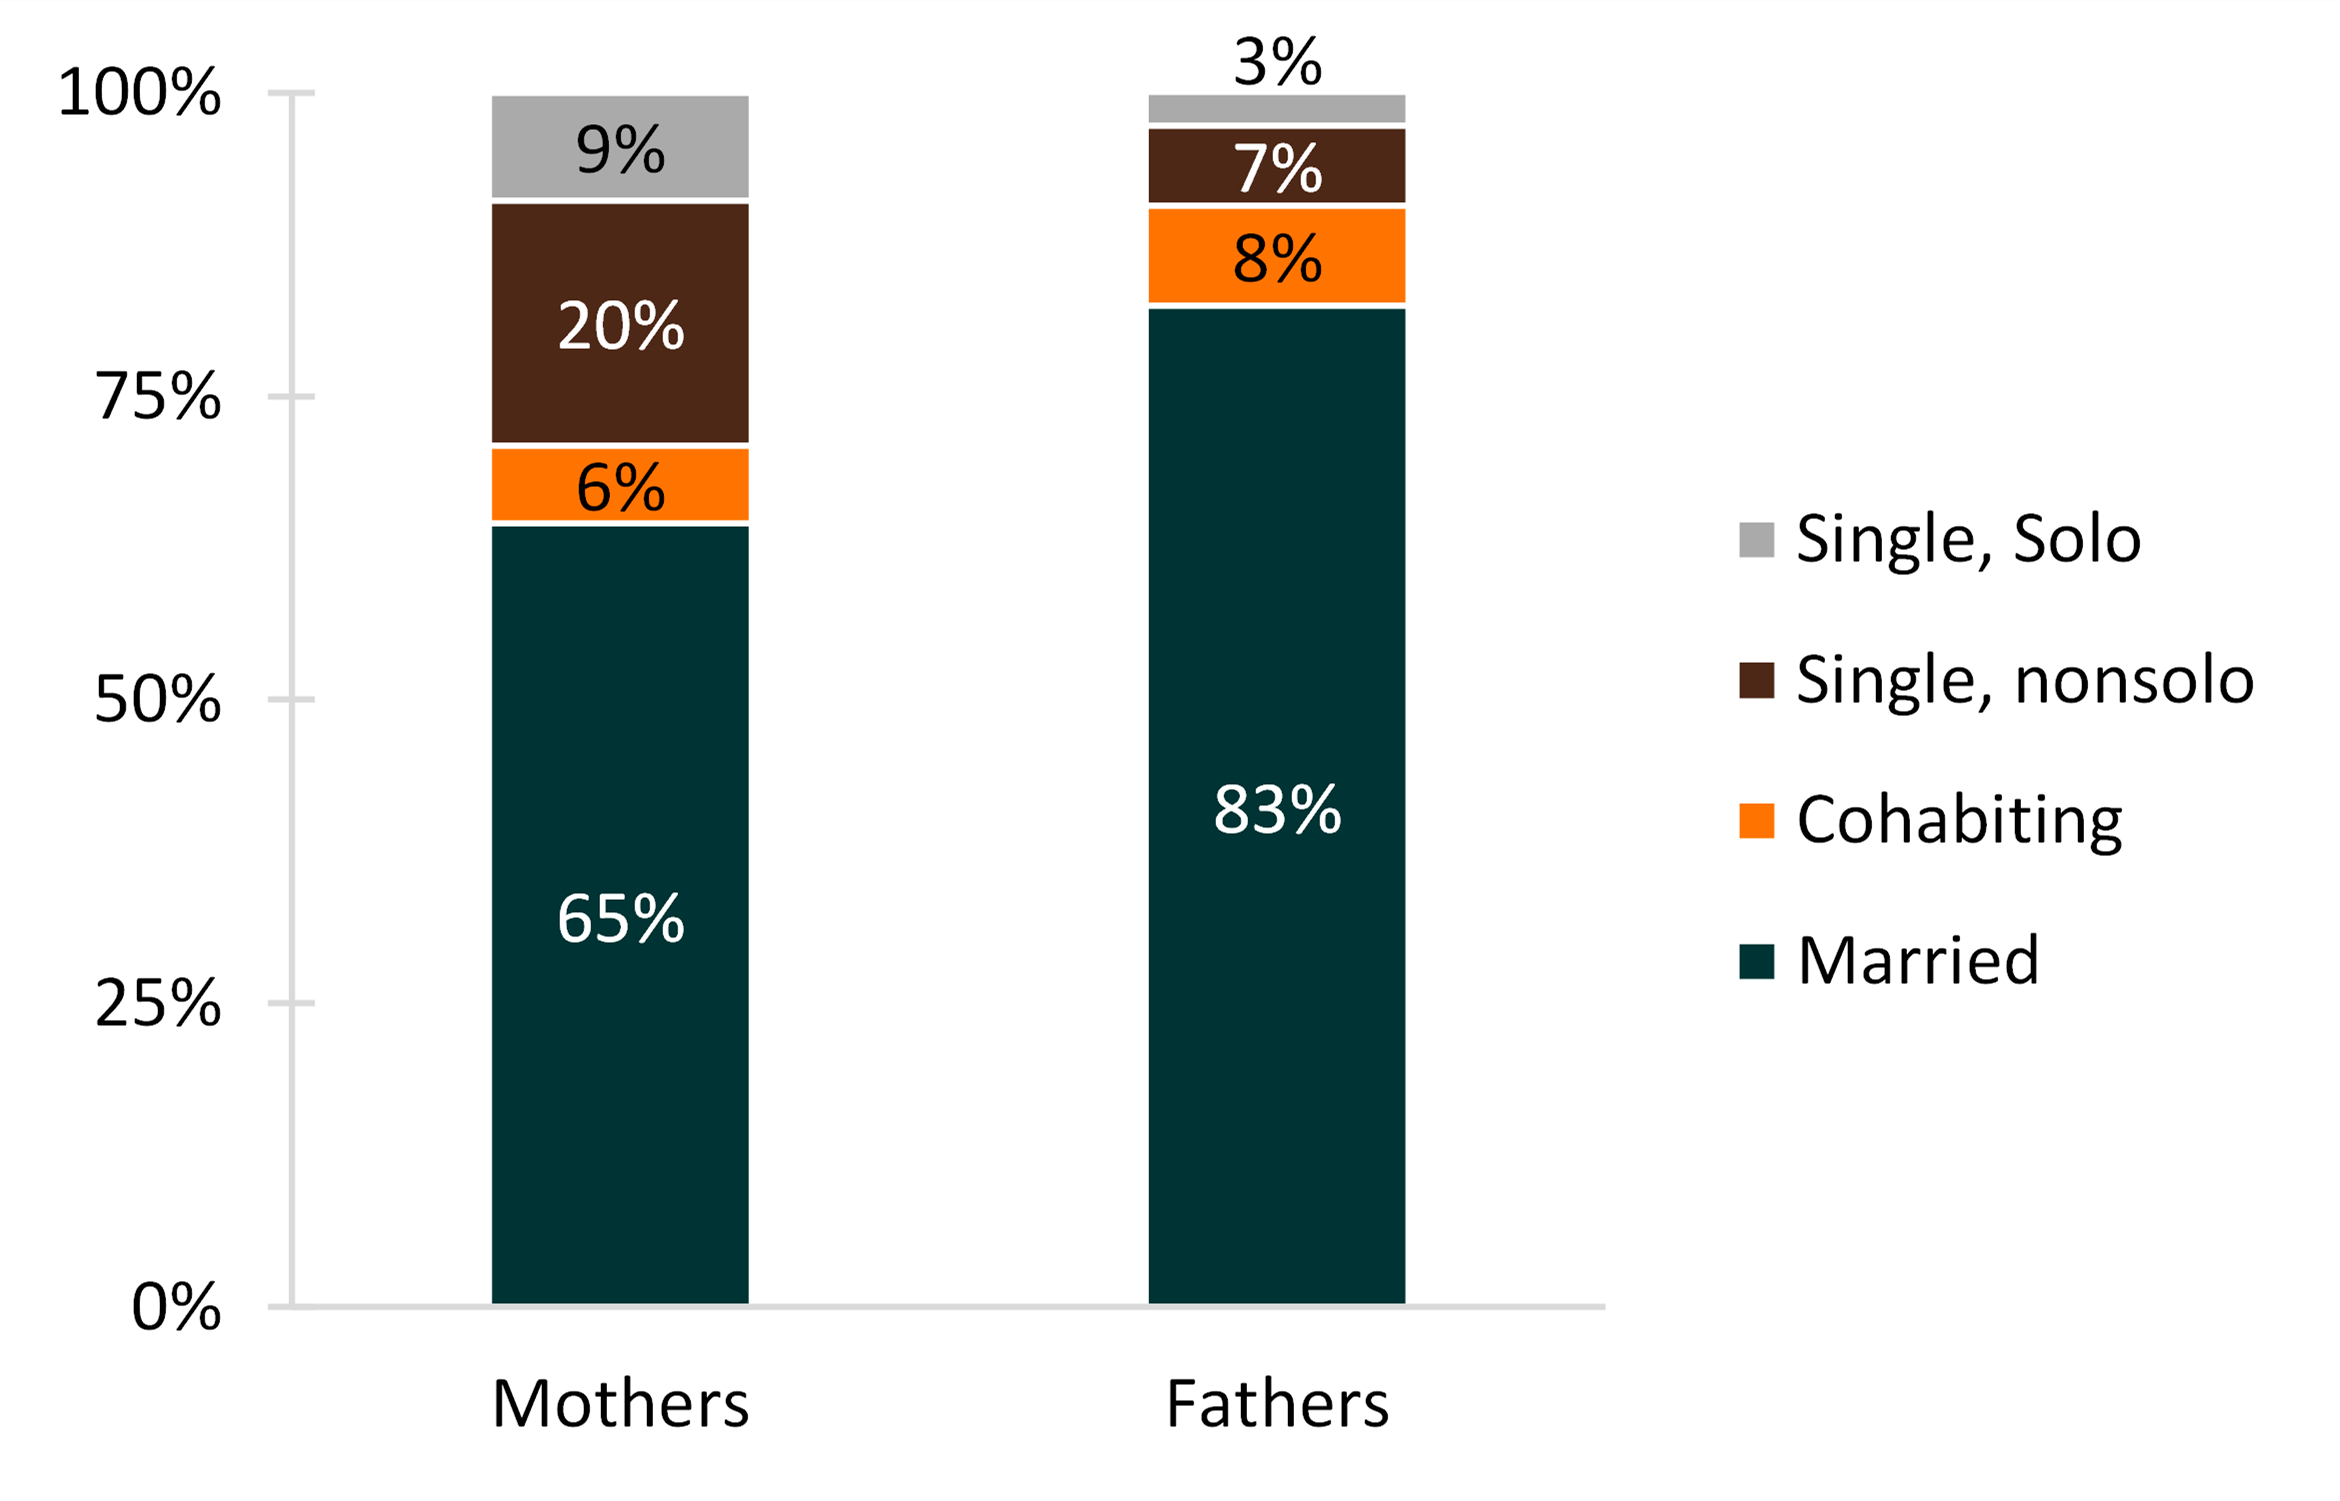
- About three out of ten (29%) resident mothers and one in ten (10%) resident fathers are what are traditionally classified as single parents in that they live with at least one biological/adoptive child but no partner.
- Among all mothers, 20% were single and living with someone else (nonsolo) and 9% were single and living alone (solo).
- Among all fathers, 7% were single and living with someone else (nonsolo) and 3% were single and living alone (solo).
- Most single parents were not living solo (i.e., with no other adults).
- Just under one third (9% / 29% = 31%) of single mothers and single fathers (3% / 10% = 29%) were living solo.
Figure 1. Parents’ Living Arrangements in the United States, 2021

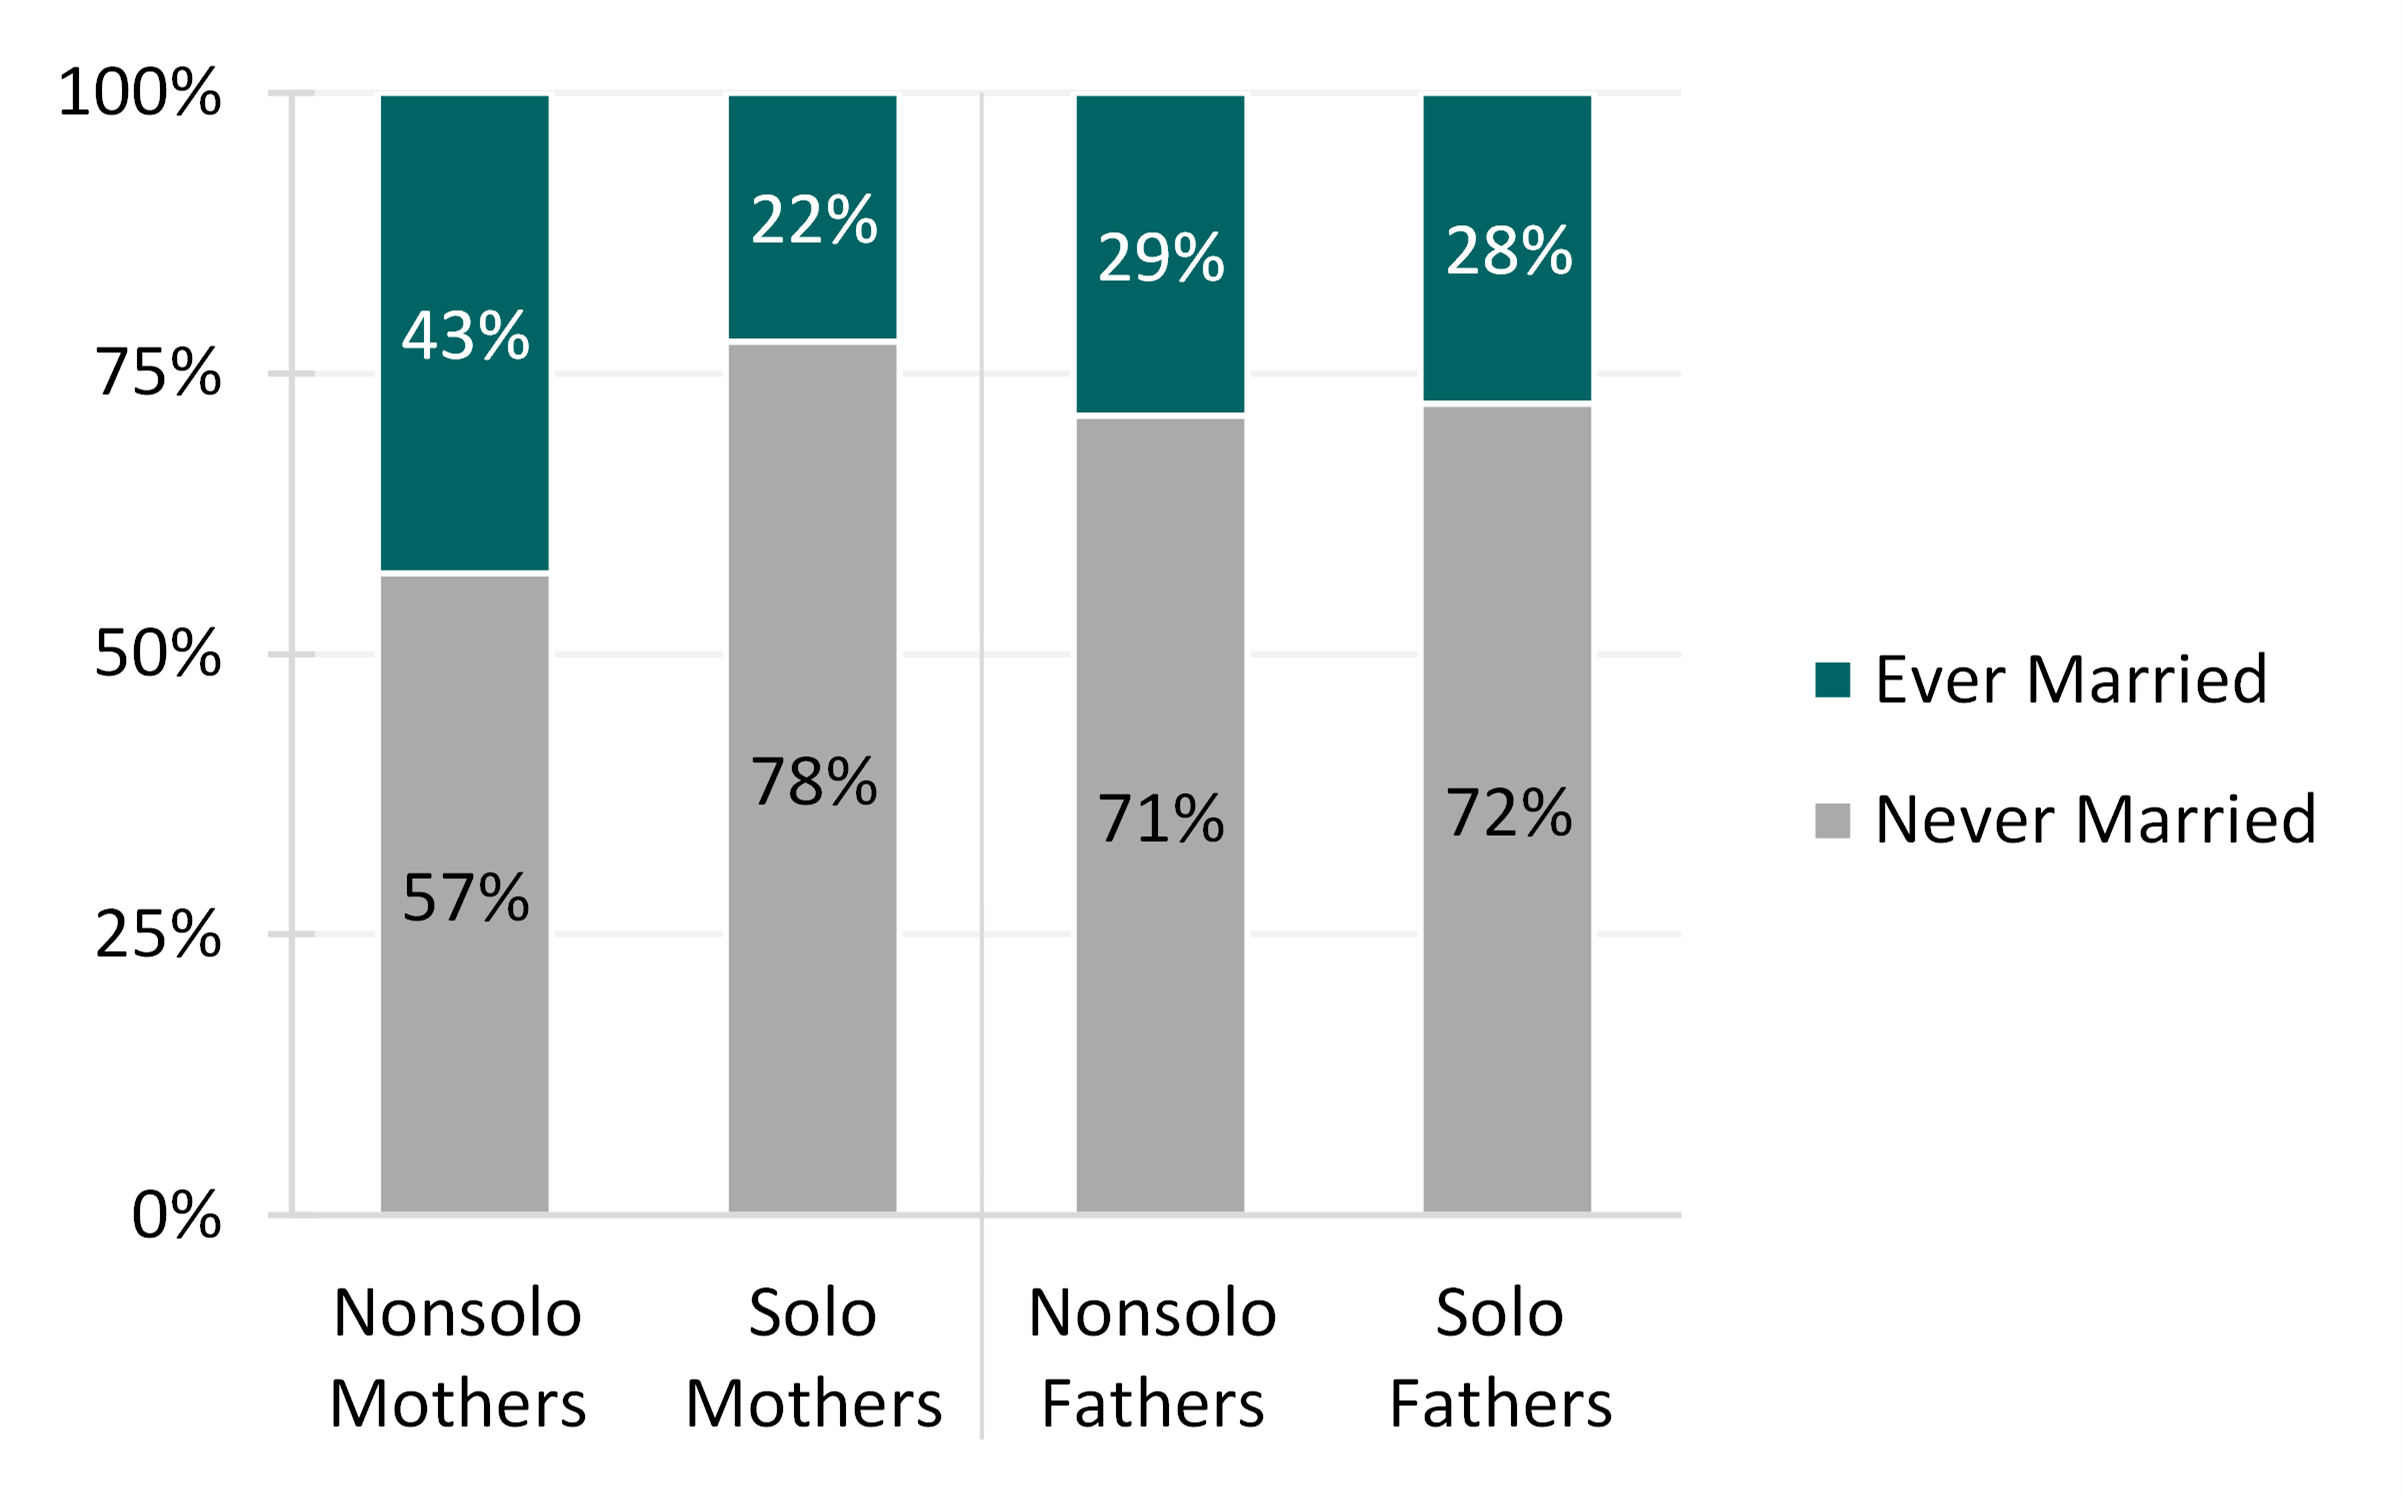
Resident Single Parents Marital History
Figure 2. Parents’ Marital History in the United States, 2021

Resident Single Parents by Educational Attainment
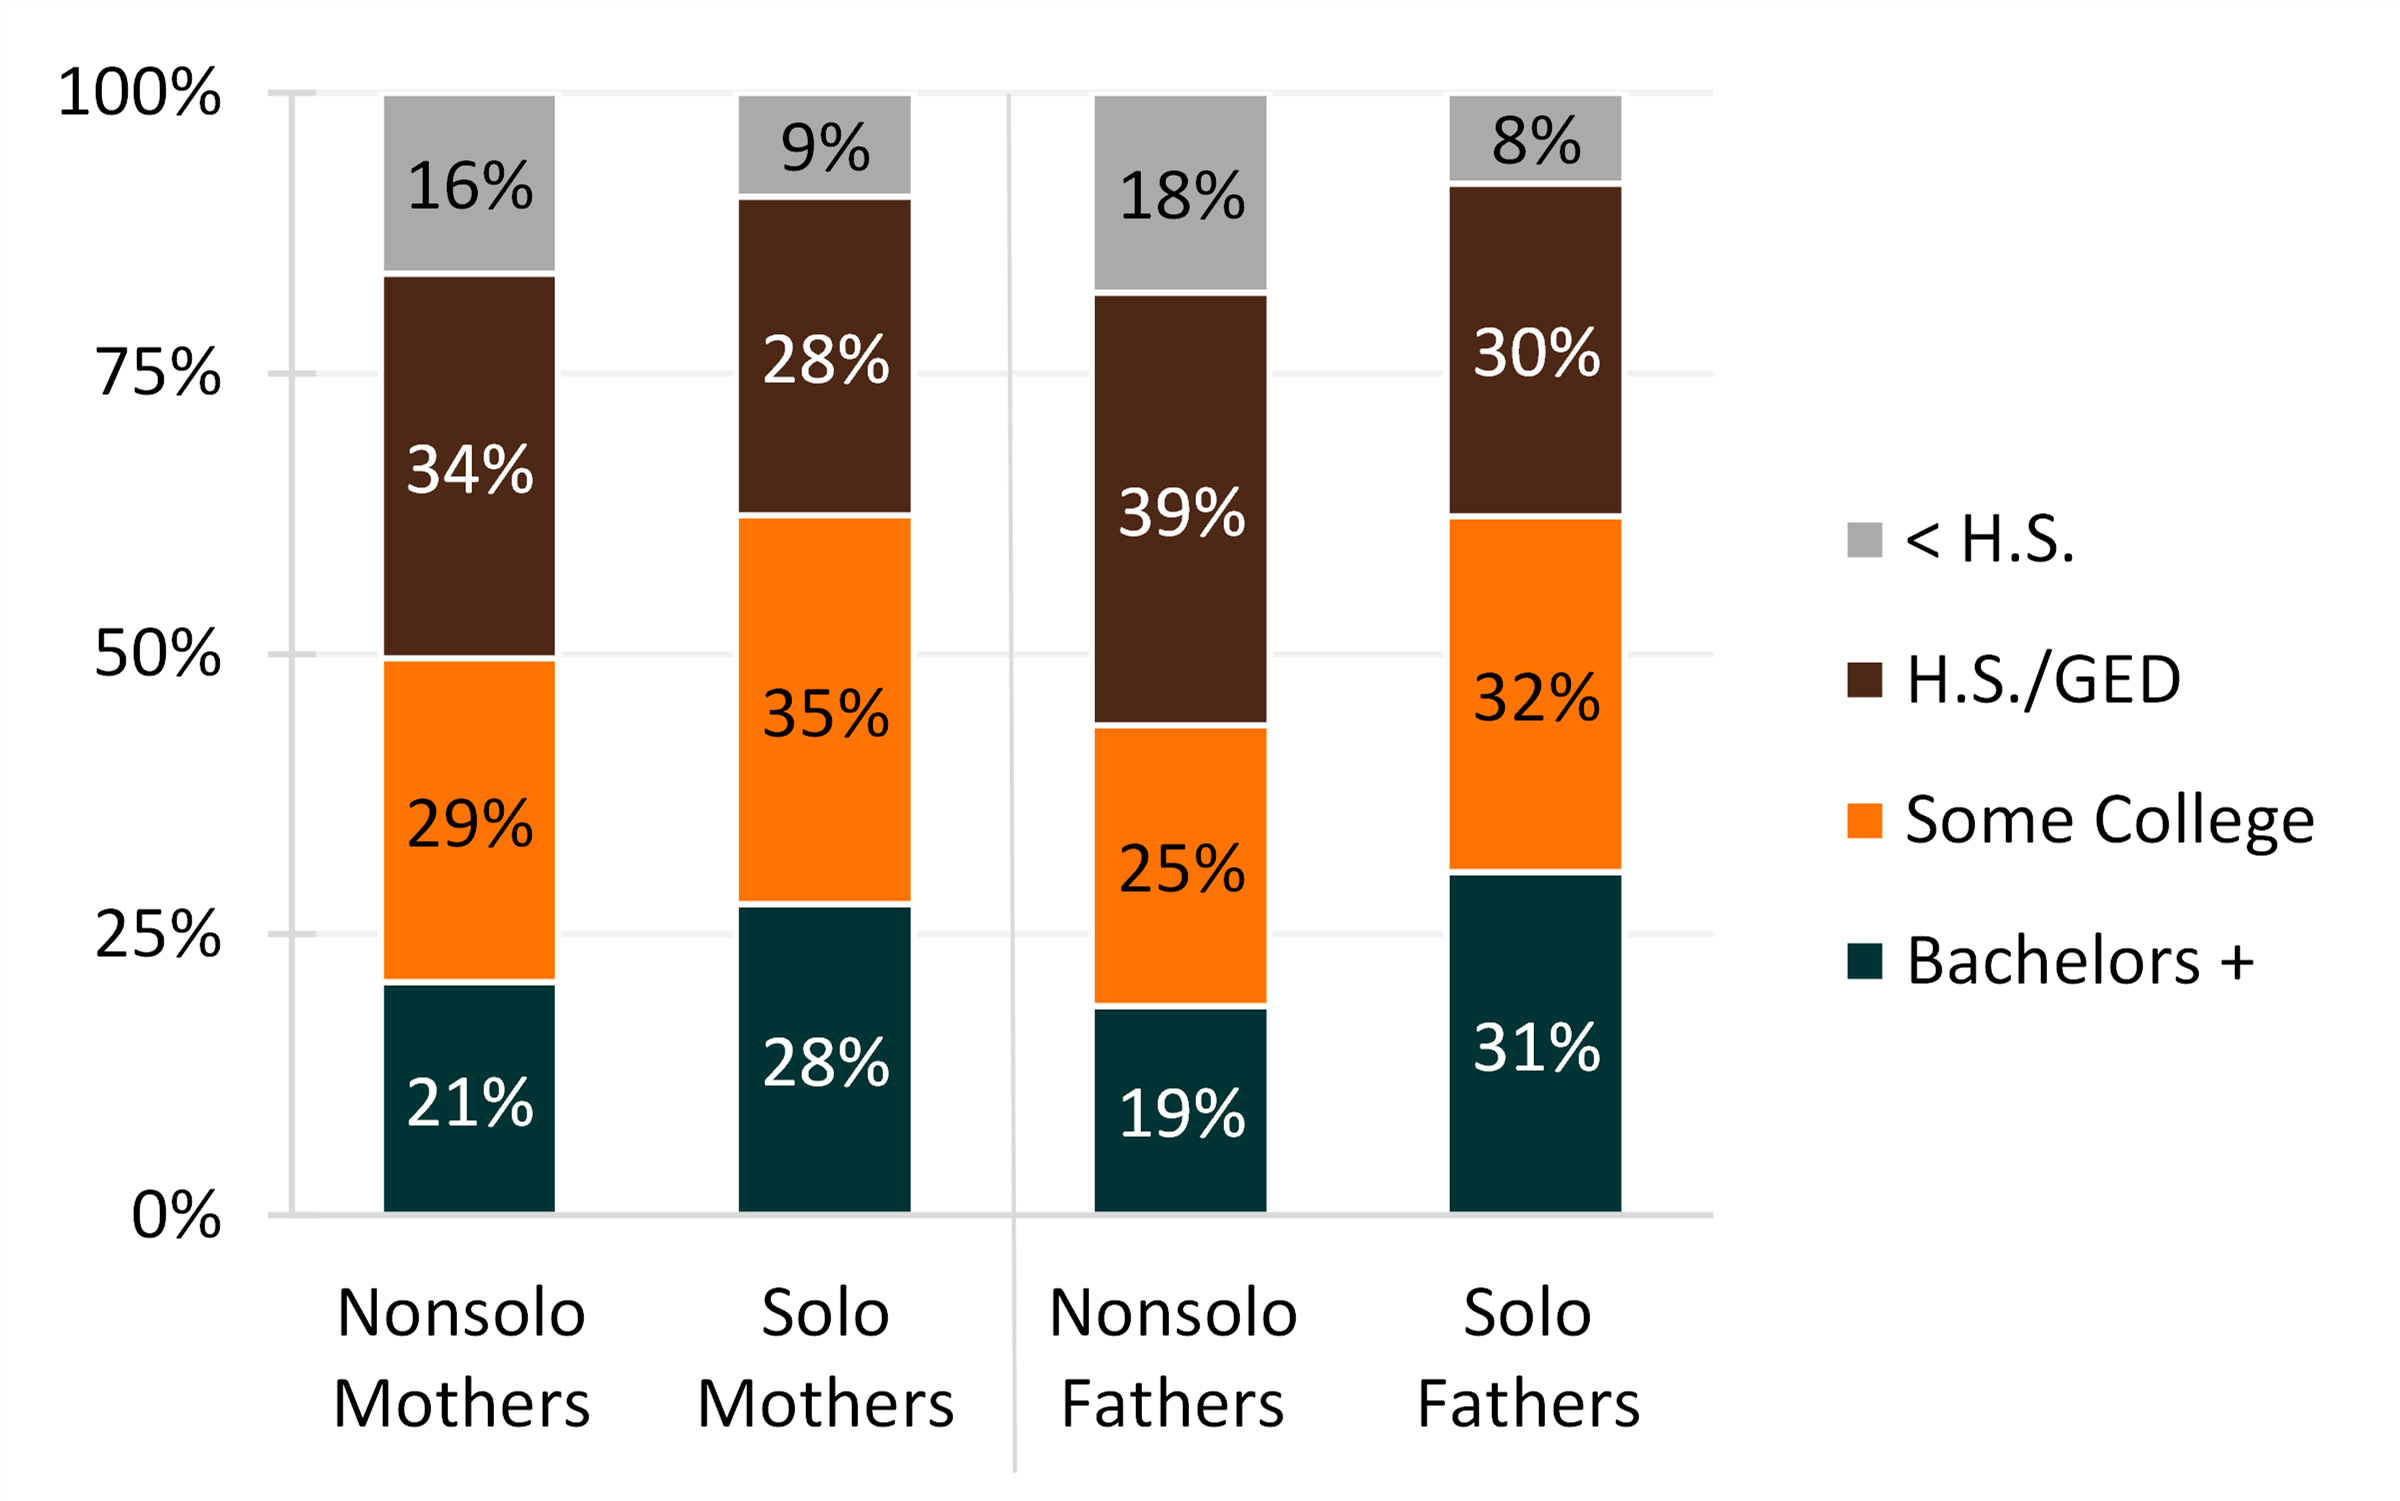
- Solo parents had higher levels of educational attainment compared to nonsolo parents. About three in ten solo parents (28% of mothers and 31% of fathers) had a college degree in contrast to two in ten single, nonsolo parents (21% of mothers and 19% of fathers).
- A greater share of nonsolo parents had not graduated from high school than solo parents among both mothers and fathers.
Figure 3. Parents’ Educational Attainment in the United States, 2021

Resident Single Parents by Race & Ethnicity
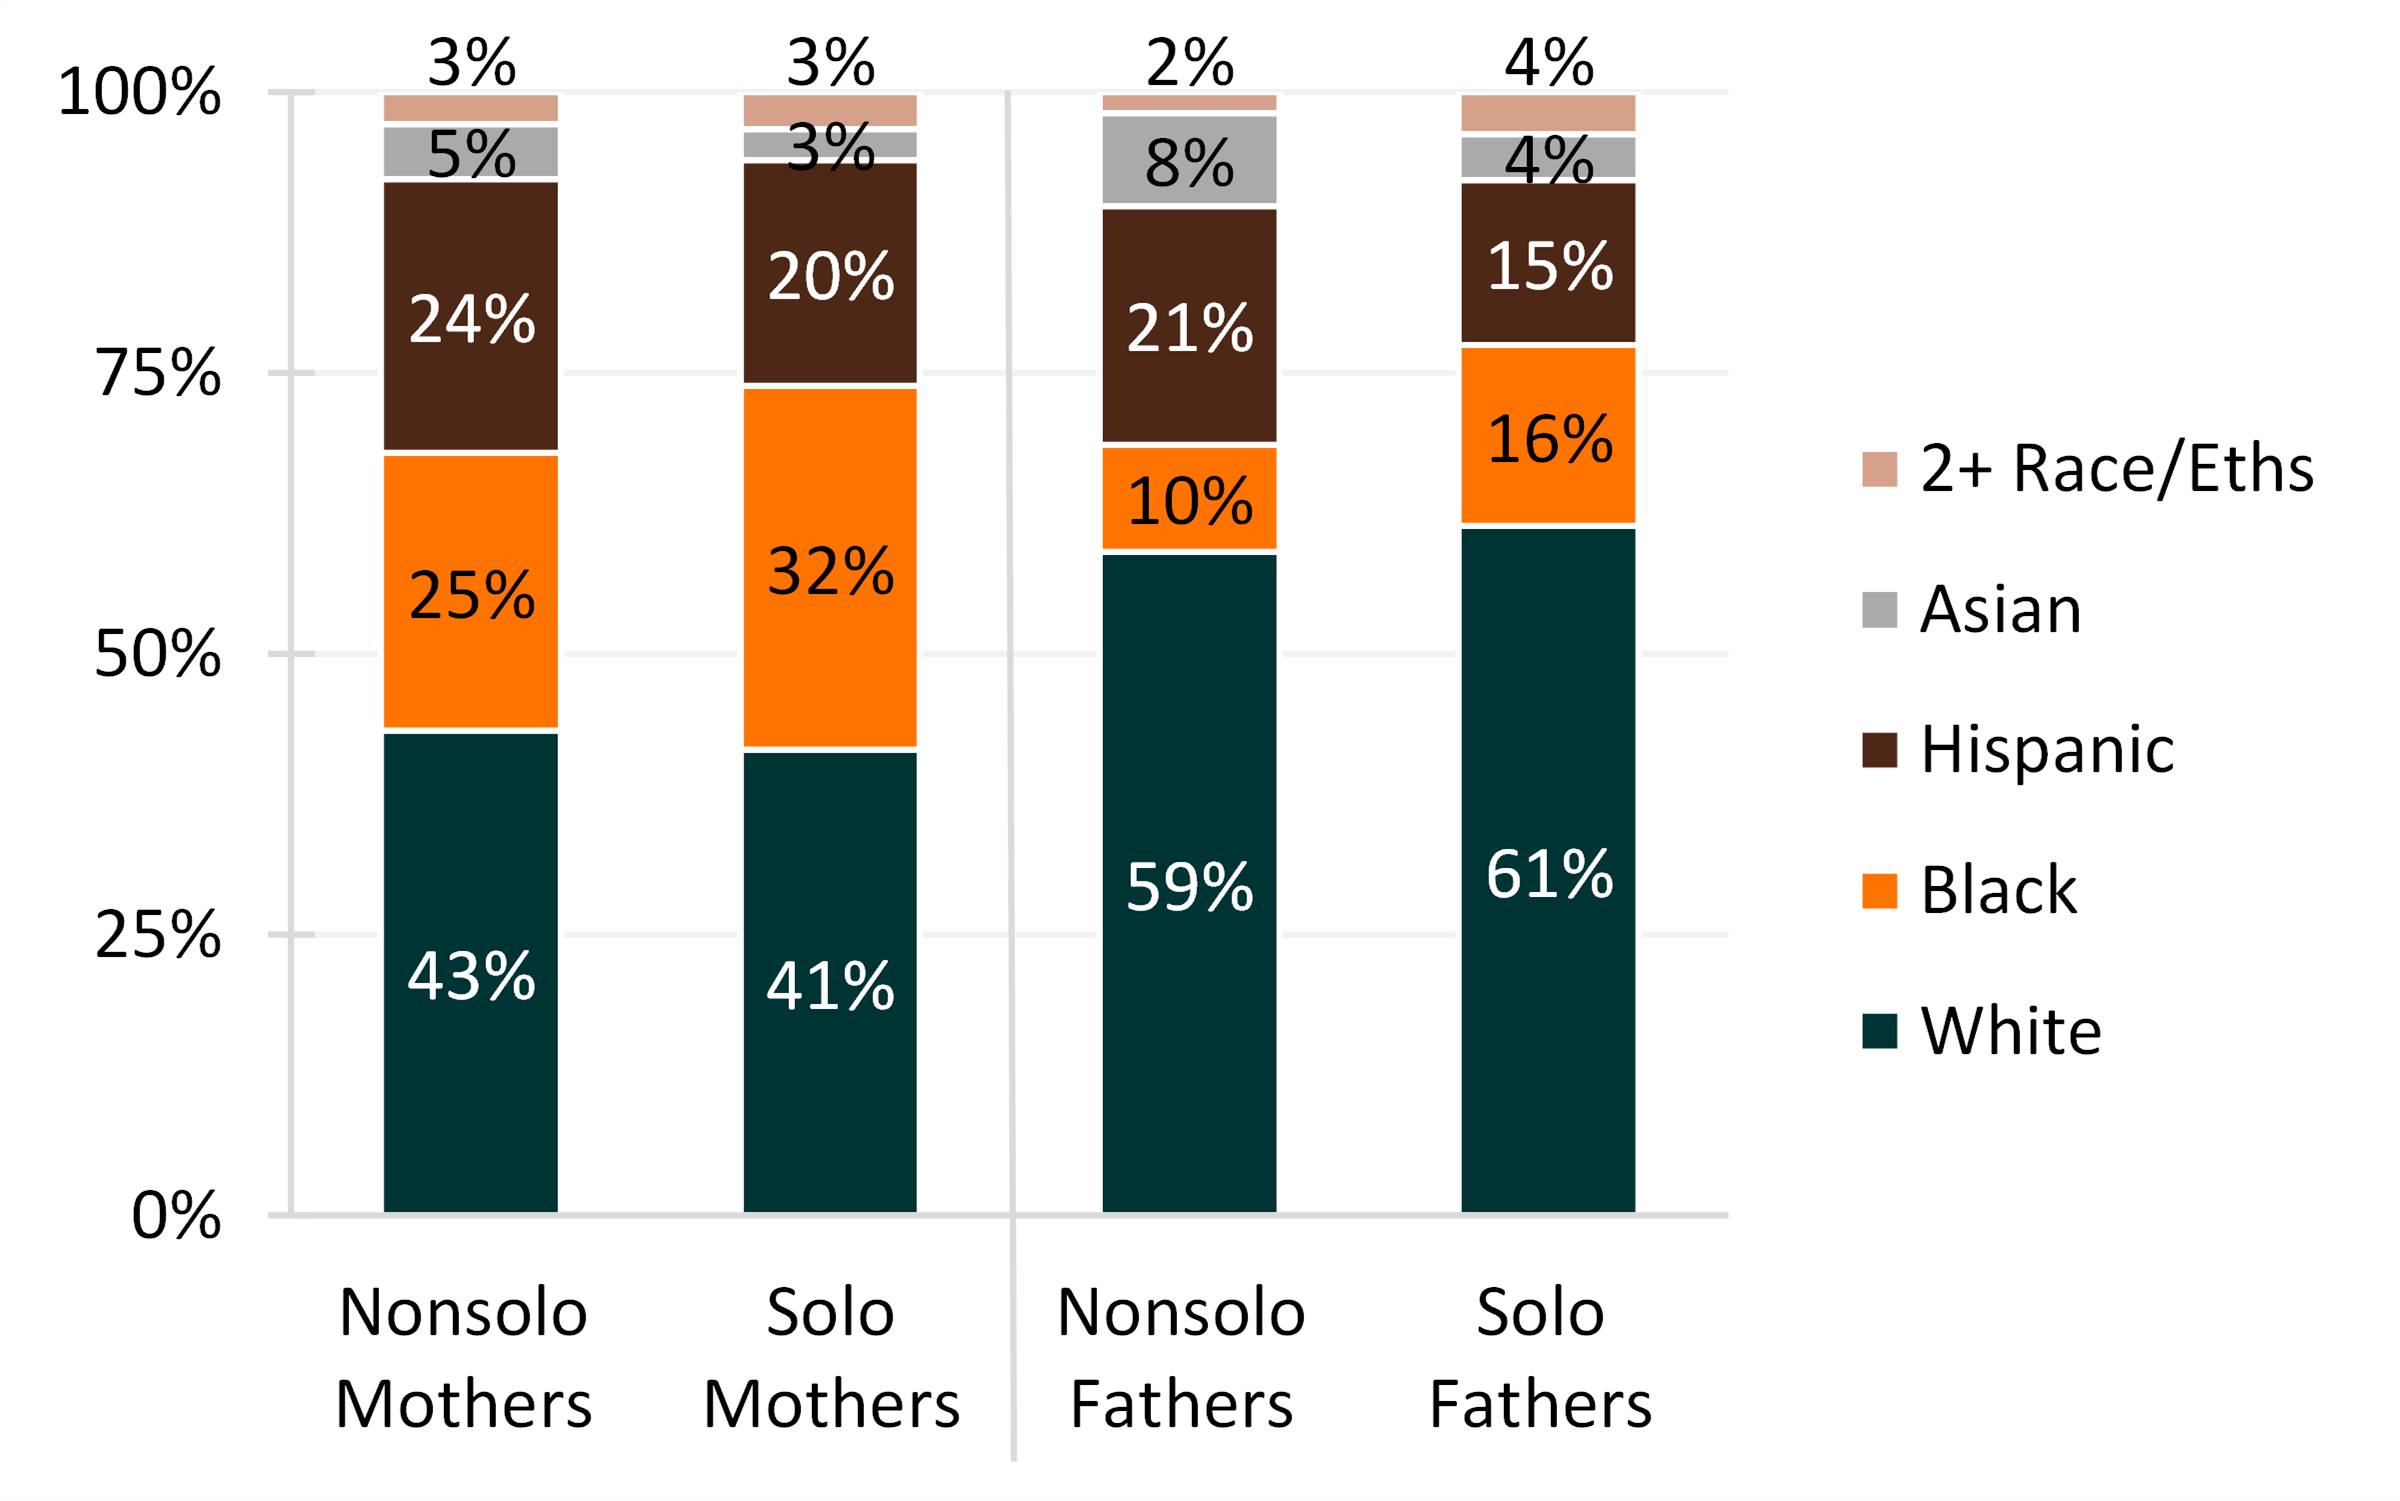
- About three in five solo fathers and two in five solo mothers identified as White, non-Hispanic, with minor variation between single parents who do and do not live with other adults.
- Greater shares of solo mothers were Black, non-Hispanic than nonsolo mothers (32% and 25%, respectively), and the difference between solo fathers and nonsolo fathers was similar (16% and 10%, respectively).
- Among nonsolo mothers who lived with both children and other adults, the share (24%) who were Hispanic was slightly larger than the share living only with their children (21%). A similar pattern was observed among single fathers.
Figure 4. Parents’ Race and Ethnicity in the United States, 2021

Data Source:
Flood, S., King, M., Rodgers, R., Ruggles, S., Warren, J. R., & Westberry, M. (2021). Integrated Public Use Microdata Series: Current Population Survey: Version 9.0 [dataset]. Minneapolis, MN: IPUMS. https://doi.org/10.18128/D030.V9.0
References:
Eickmeyer, K. J. (2017). American children’s family structure: Single-parent families. Family Profiles, FP-17-17. Bowling Green, OH: National Center for Family & Marriage Research. https://www.bgsu.edu/ncfmr/resources/data/family-profiles/eickmeyer-single-parentfamilies-fp-17-17.html
Eickmeyer, K. J. (2018). Fathers with resident minor children, 2016. Family Profiles, FP-18-06. Bowling Green, OH: National Center for Family & Marriage Research. https://doi.org/10.25035/ncfmr/fp-18-06
Westrick-Payne K. K. & Wiborg, C. E. (2021). Children’s family structure, 2021. Family Profiles, FP-21-26. Bowling Green, OH: National Center for Family & Marriage Research. https://doi.org/10.25035/ncfmr/fp-21-26
Suggested Citation:
Wiborg, C. E. (2022). “Solo” and “nonsolo” single-parent households in the U.S., 2021. Family Profiles, FP-22-17. Bowling Green, OH: National Center for Family & Marriage Research. https://doi.org/10.25035/ncfmr/fp-22-17
Updated: 11/12/2025 10:16AM

