Recent Marriages to Same-Sex and Different-Sex Couples: Mobility, Region, Home Ownership, and Household Income, 2022
Family Profile No. 28, 2023
Authors: Krista K. Westrick-Payne & Wendy D. Manning
In 2015, a U.S. Supreme Court landmark decision ensured that everywhere in the nation, same-sex couples had the legal right to marry. In part two of our installment of Profiles examining the characteristics of recently married couples, this profile looks at differentials in key geographic and economic indicators (mobility, geographic residence, homeownership, and household income) and is an update of a previous profile (Payne & Manning, 2021). A focus on newlywed couples, rather than all married couples, provides insights into their circumstances at the time of marriage. Part one of this installment on newlyweds is Recent Marriages to Same-sex and Different-sex Couples: Marital History and Age at Marriage (Westrick-Payne & Manning 2023). Both profiles use data from the ACS 1-year PUMS files from 2022 to examine individuals who married in the last year disaggregated by the sex/gender composition of the marriage entered into. Analyses are limited to currently married householders and spouses of householders who married in the last year, and we show 95% confidence intervals in some figures. Note that the sequencing cannot be determined for marriage, moves, residence, and homeownership within the last year.
Recent Marriages
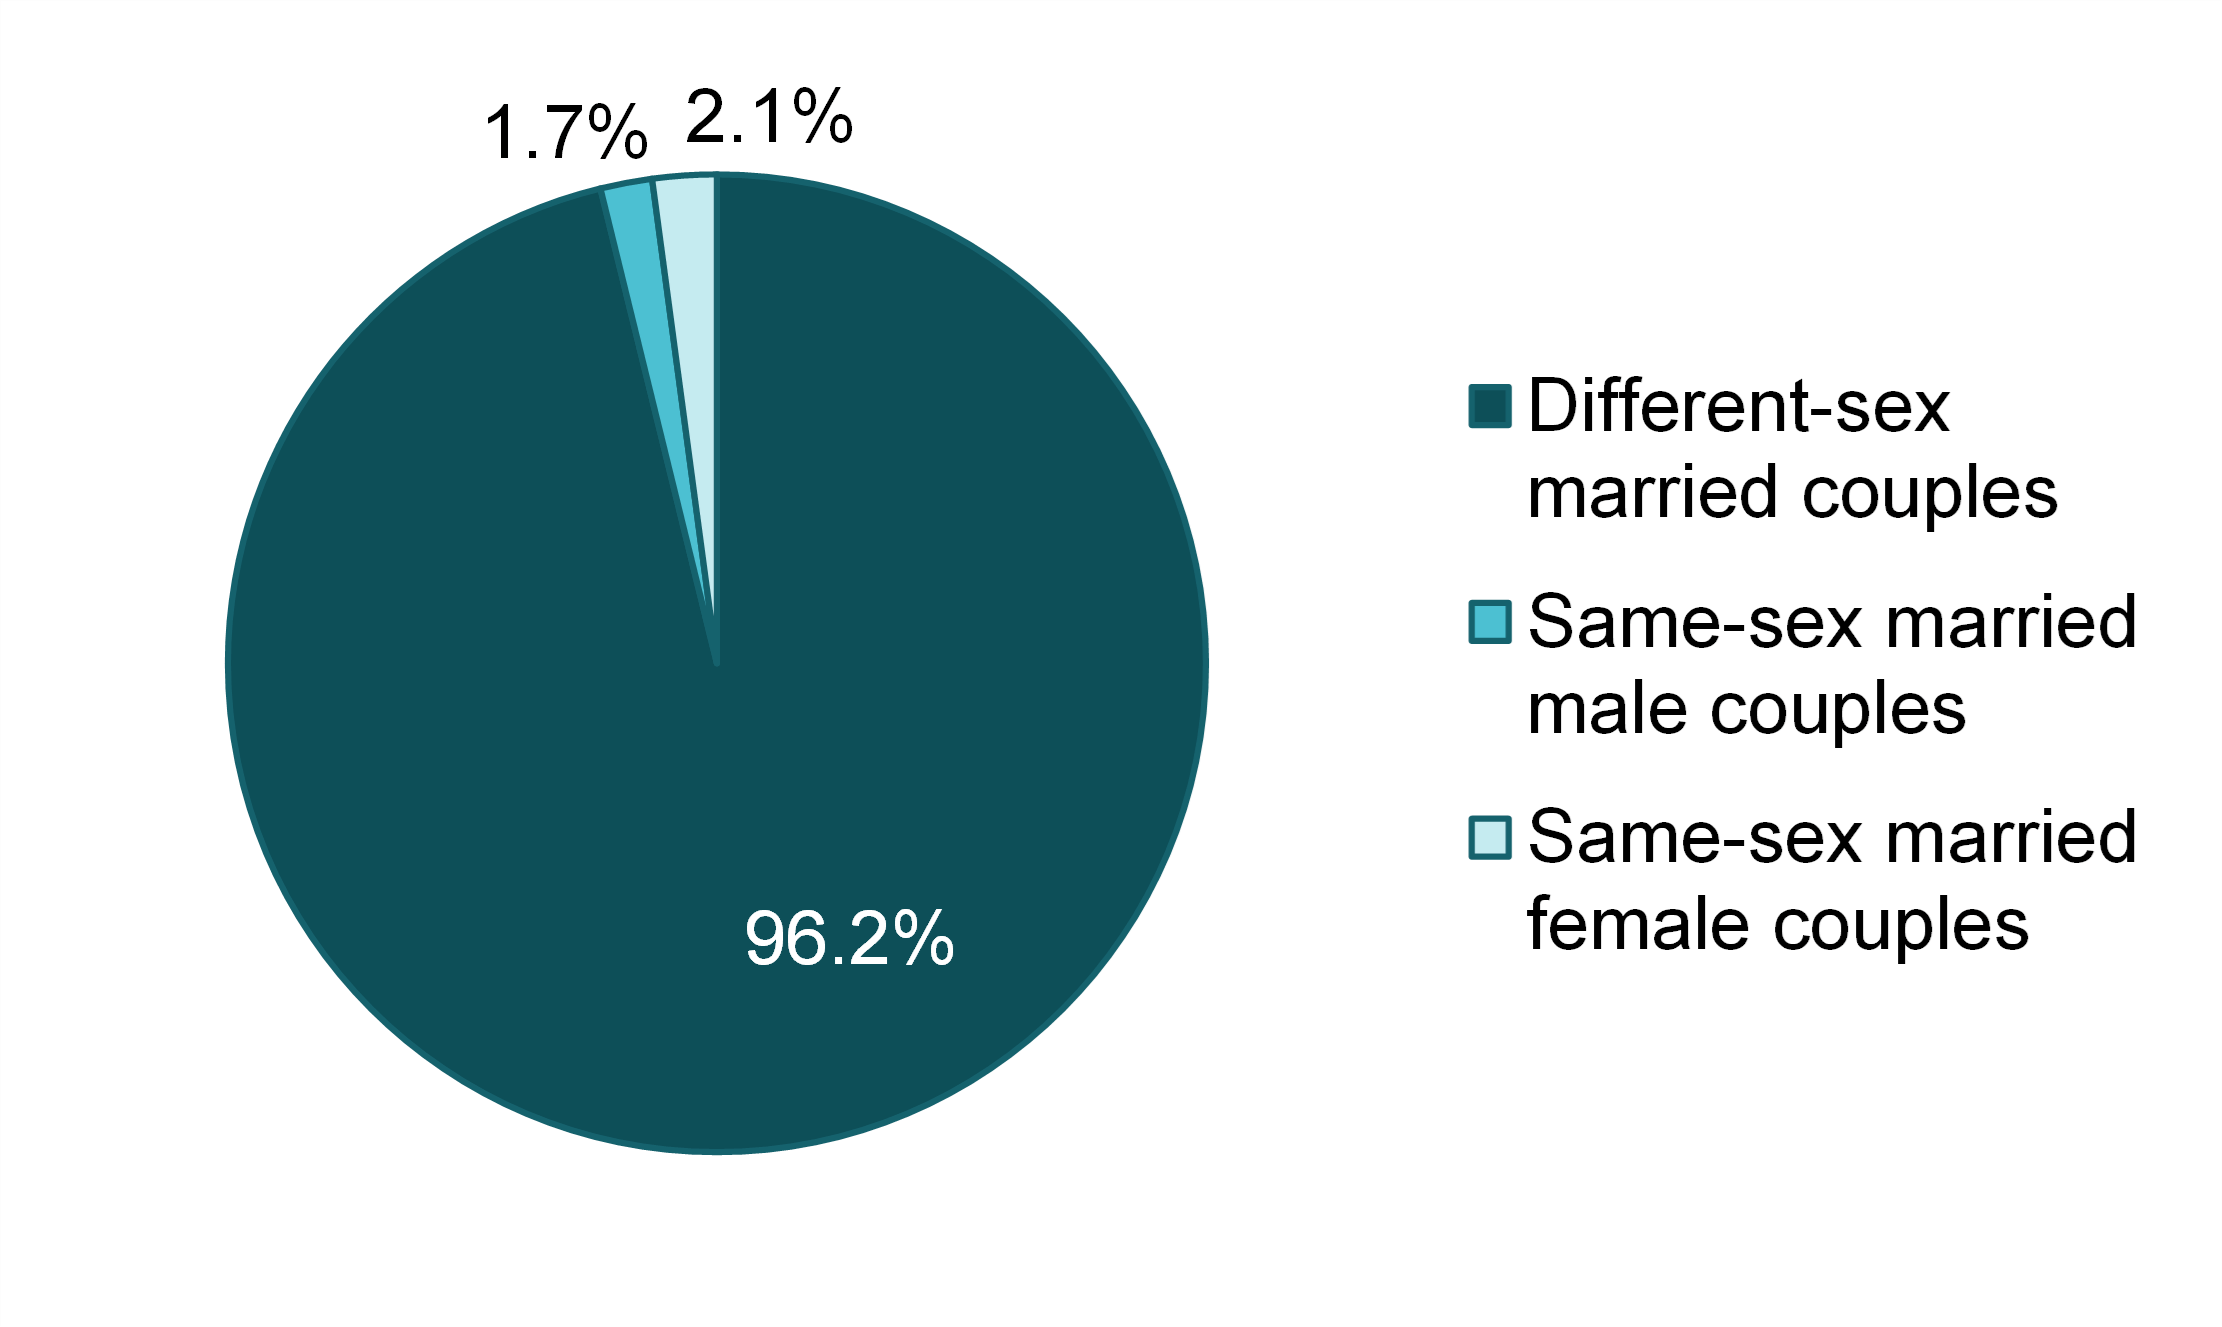
- Based on the ACS, there were over 40,000 marriages to female same-sex couples and nearly 33,000 to male same-sex couples, along with over 1.8 million marriages to different-sex couples in 2022.
- About 2.1% of marriages in 2022 were to female same-sex couples and 1.7% were to male same-sex couples, reflecting similar shares to those in 2019 (FP-21-20).
Figure 1. Composition of Recently Married Couples, 2022
Movers
- Newlyweds in different-sex couple relationships were more like to have moved in the last year than newlyweds in same-sex couple relationships.
- One-third of different-sex newlyweds moved in the last year.
- Similar shares of male and female same-sex newlyweds moved in the last year, 19% and 20%, respectively.
Figure 2. Movers by Composition of Recently Married Couples, 2022
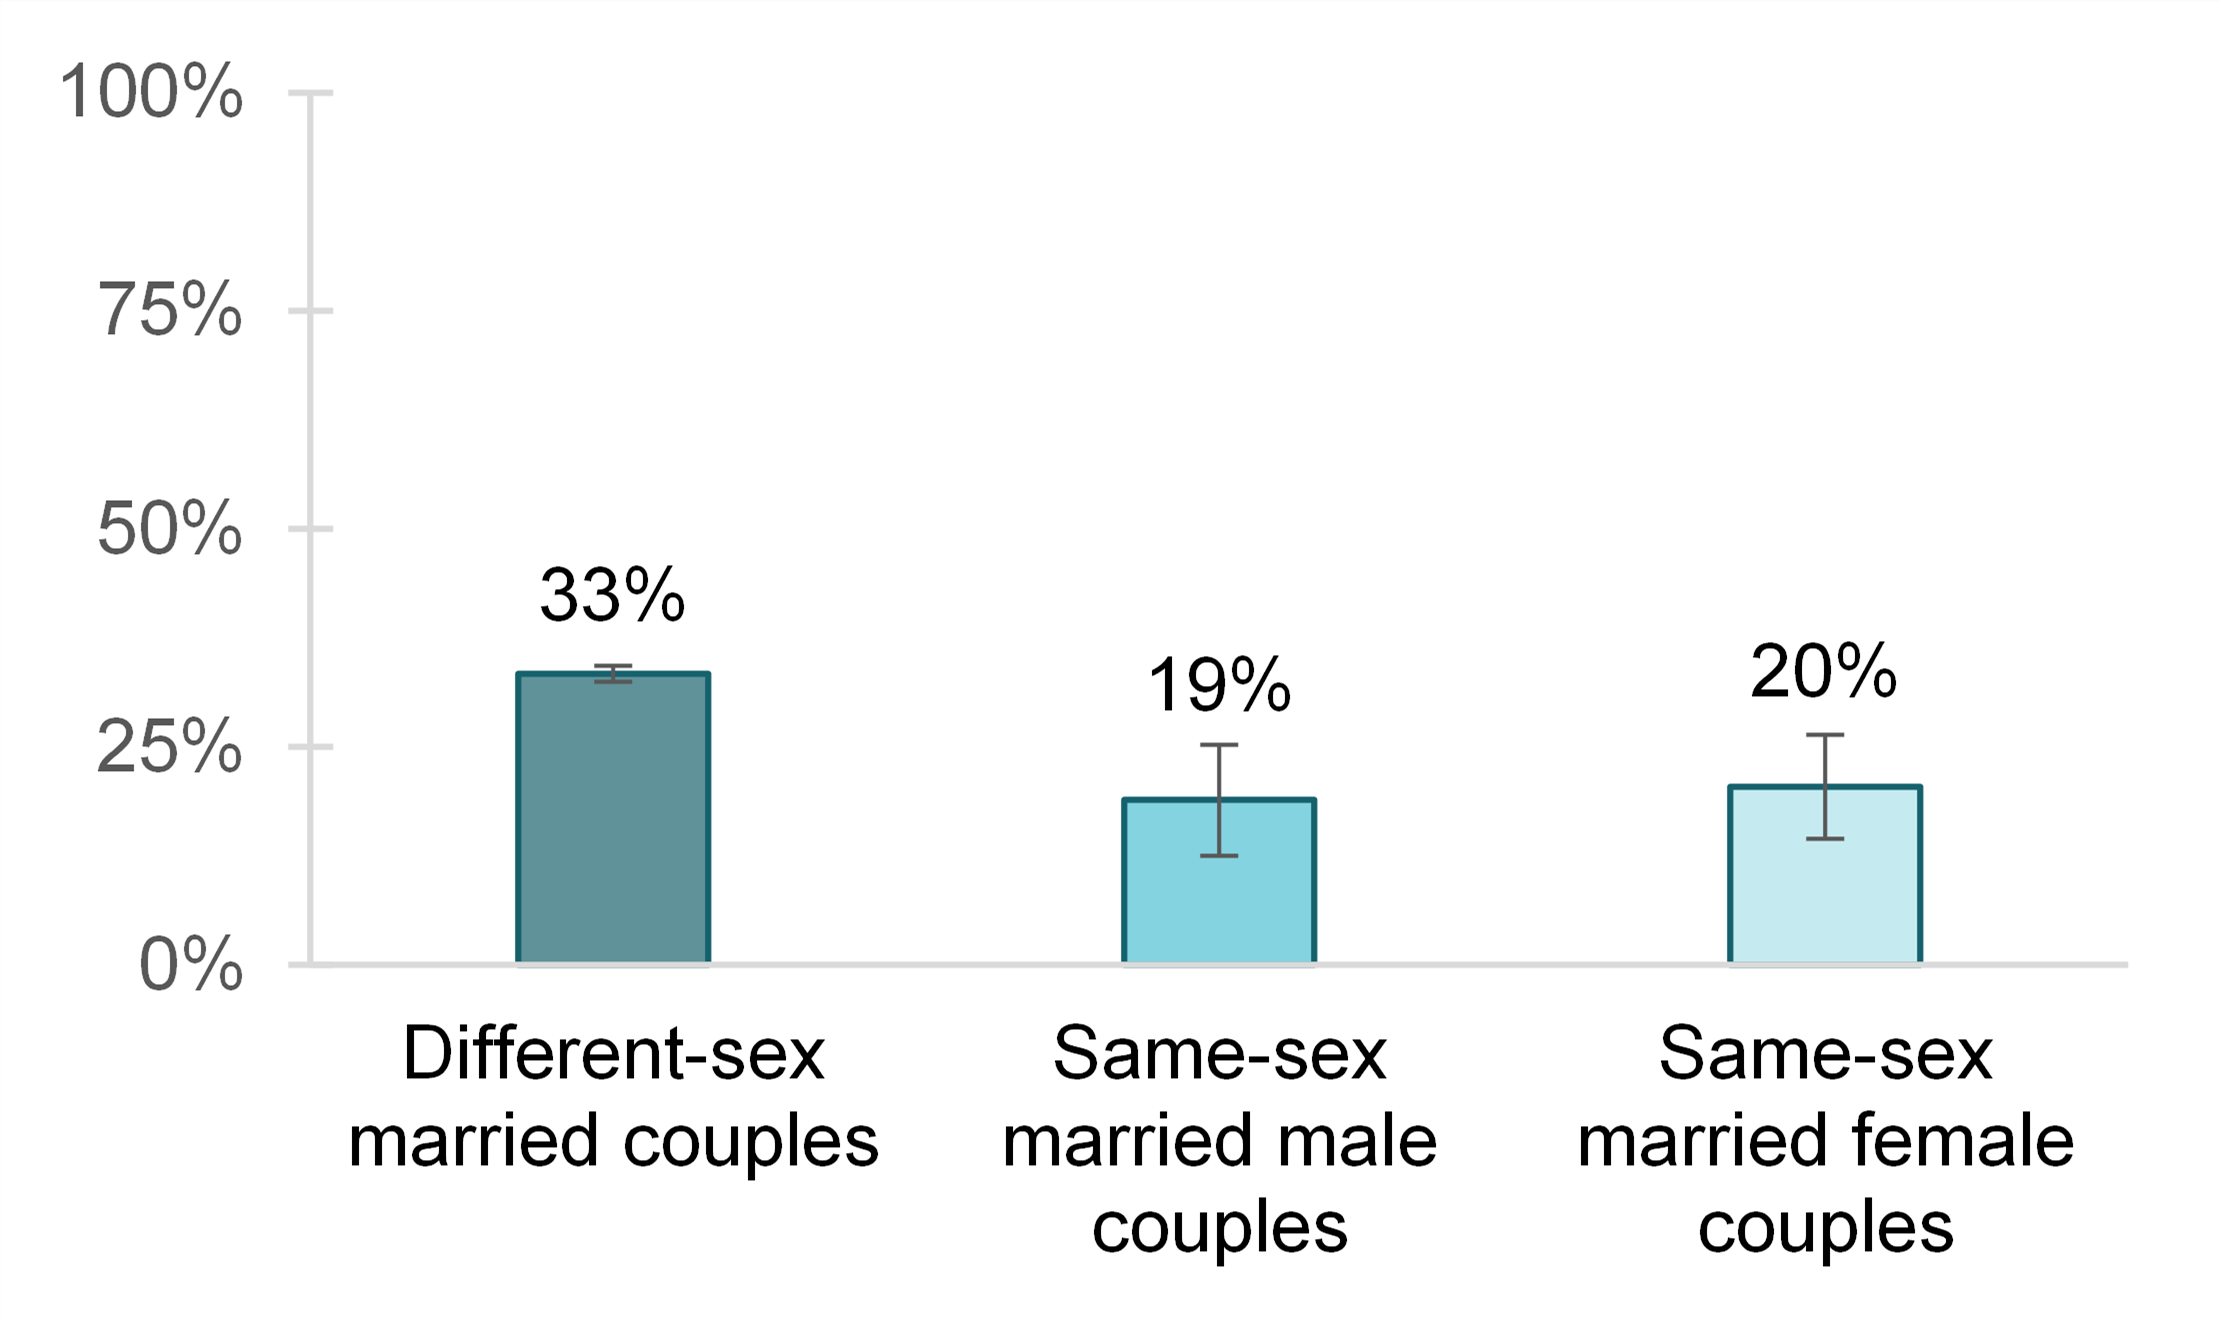
Note: We cannot distinguish the timing of the move and marriage so some moves may have occurred prior to marriage and others after marriage. We report the share who reported they married and moved in the last year.
Source: NCFMR analyses of the American Community Survey PUMS 1-year estimates, 2022
Where are they living now? Region of Current Residence and Recently Married Couples
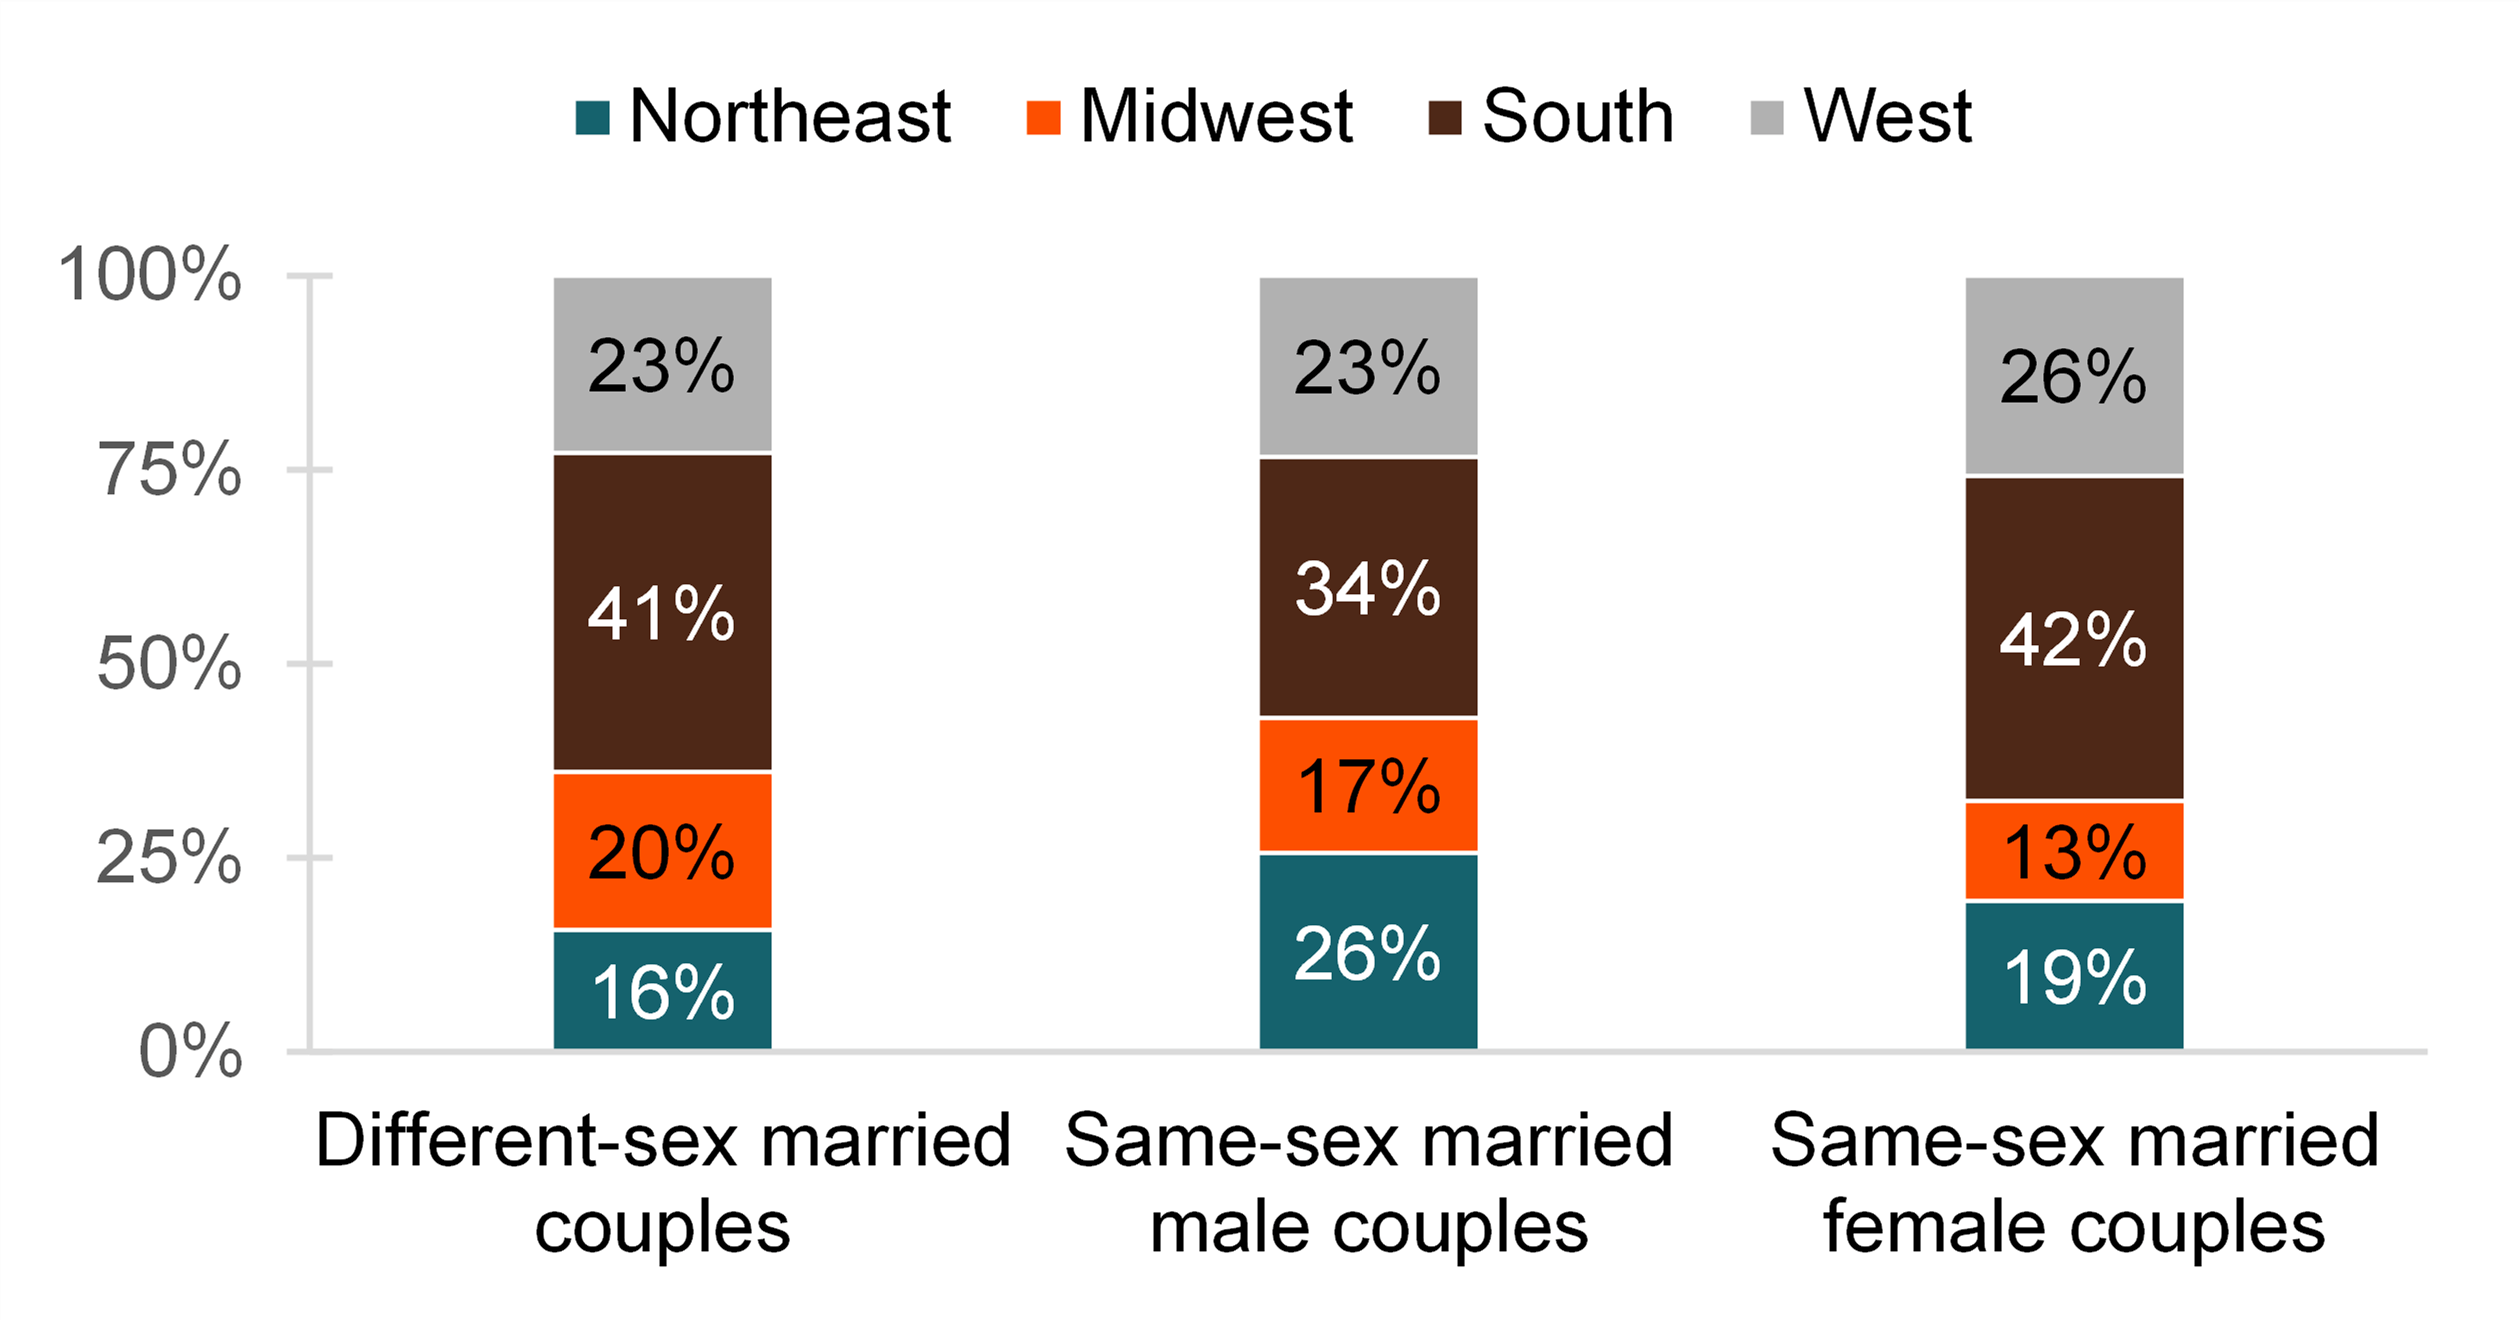
- More newlyweds lived in the South than any other region. About two-fifths of same-sex female couples and different-sex couples and one-third of same-sex male couples lived in the South.
- The Midwest was the least popular region of the country to live among recently married same-sex couples. Among male same-sex couples 17% lived in the Midwest and only 13% of female same-sex couples did so.
- Among recently married different-sex couples, the Northeast had the smallest share at 16%, whereas nearly one-fifth of female same-sex couples and over one-quarter of male same-sex couples lived there.
Figure 3. Region of Residence by Composition of Recently Married Couples, 2022
Homeownership and Household Income Among Recently Married Couples
- Over half of all newlyweds are homeowners regardless of the gender composition of their marriage.
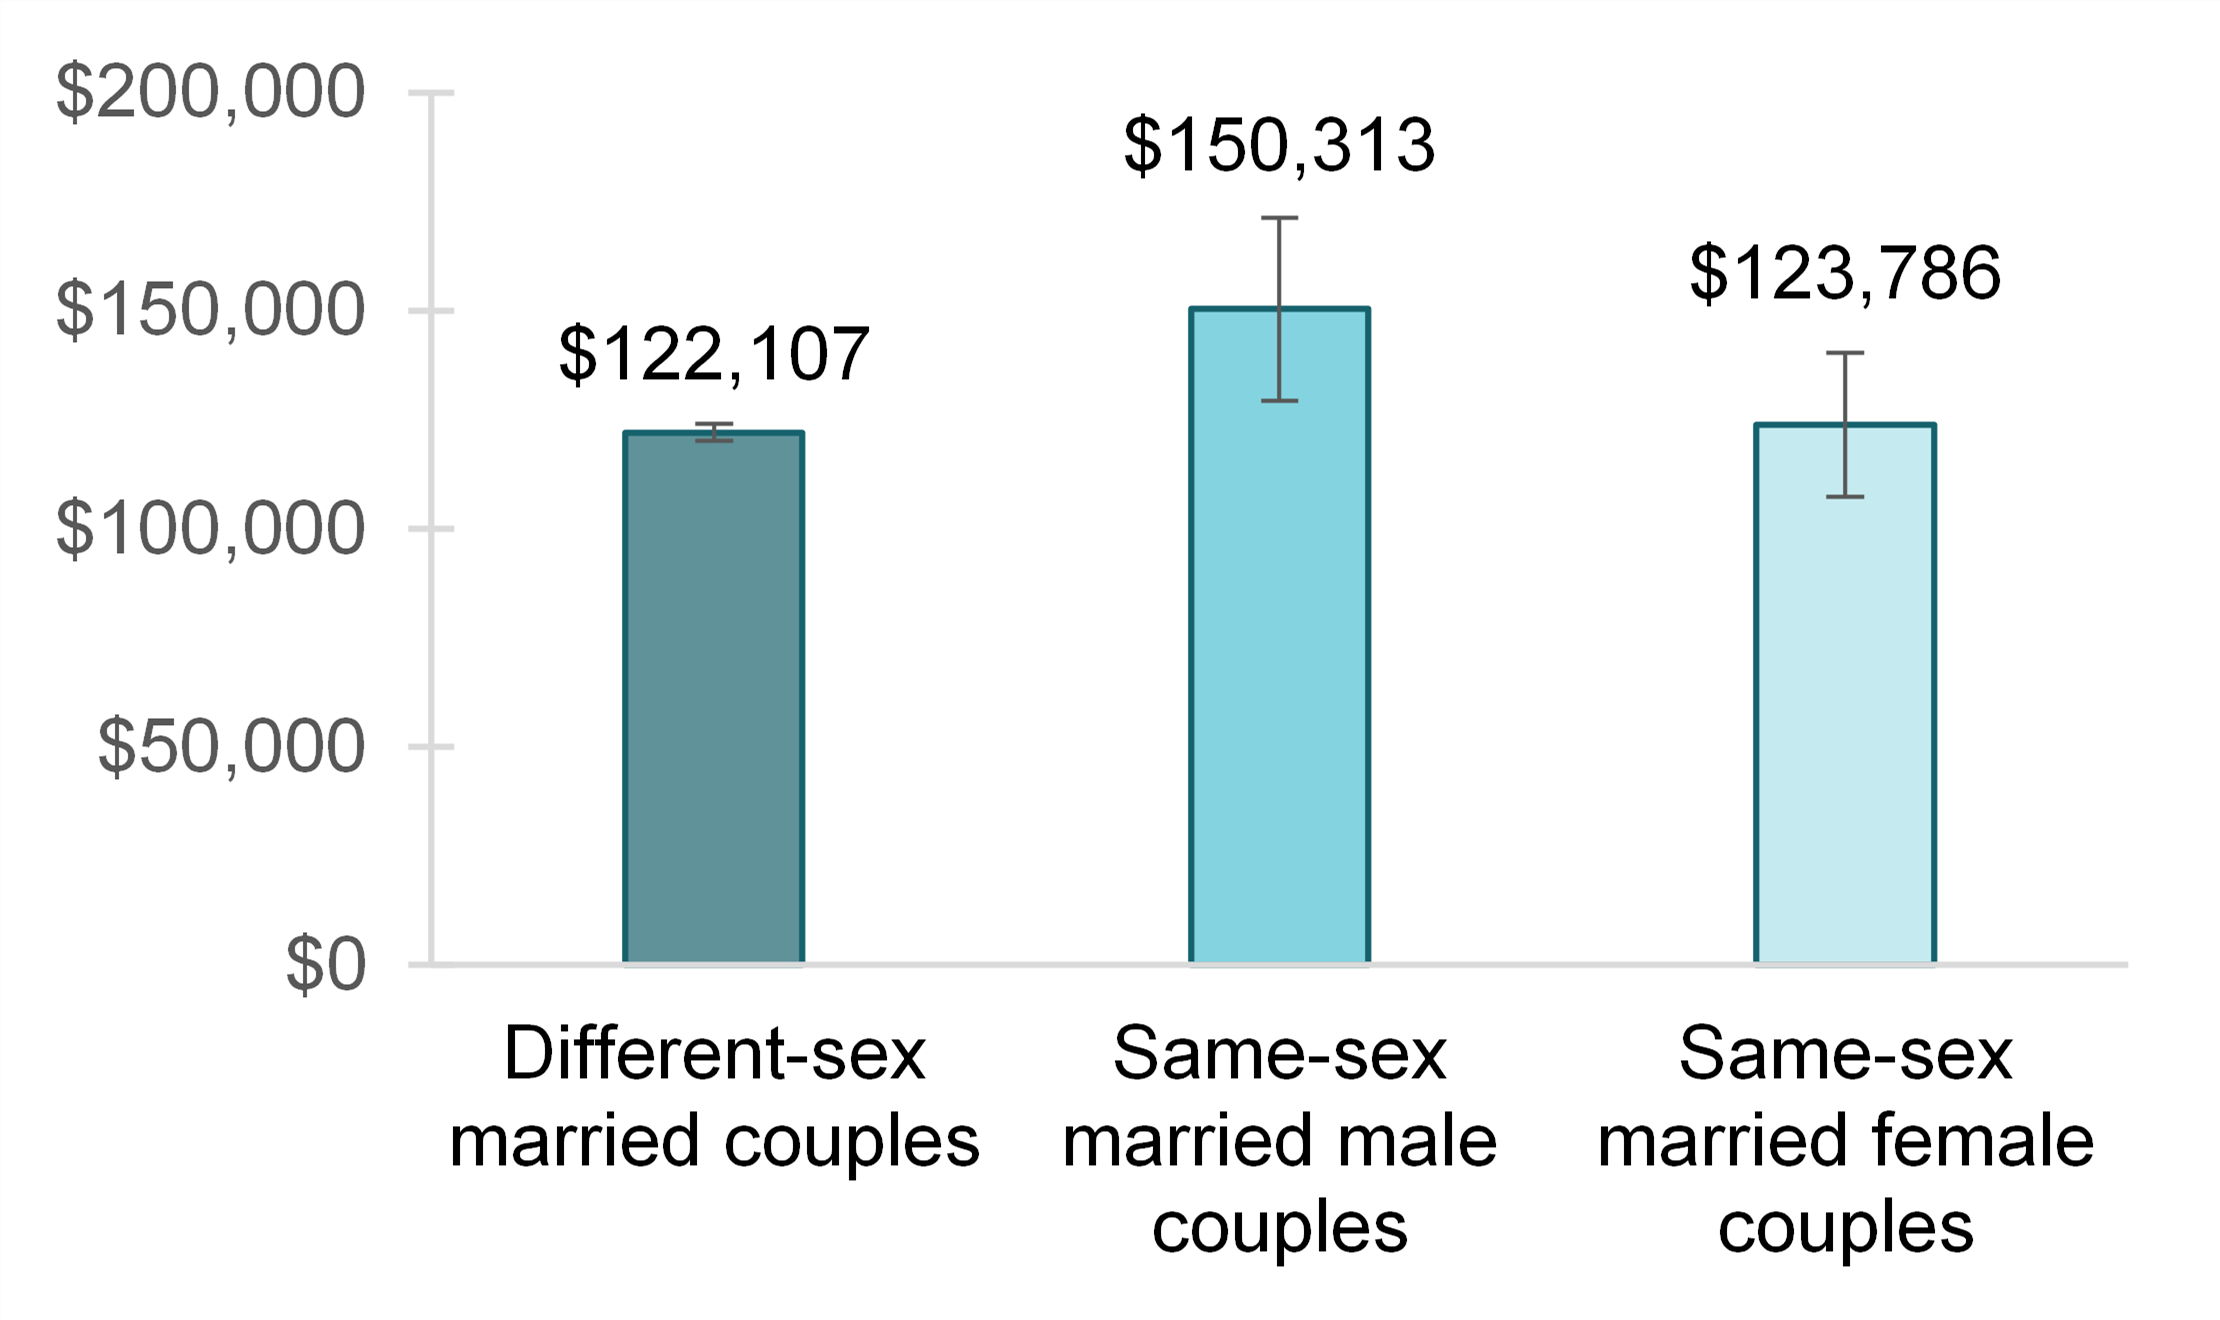
- Despite similar homeownership among recently married couples, median household income varies significantly by the gender composition of the couple.
- The highest household income was found among men who recently married men. At an average of about $150,000 a year, this is significantly higher (p<0.05) than men and women who recently entered into a marriage with a different-sex spouse ($122,000), but not signifcantly higher than women who recently entered into a marriage with a same-sex spouse ($124,000).
Figure 4. Homeowners by Composition of Recently Married Couples, 2022
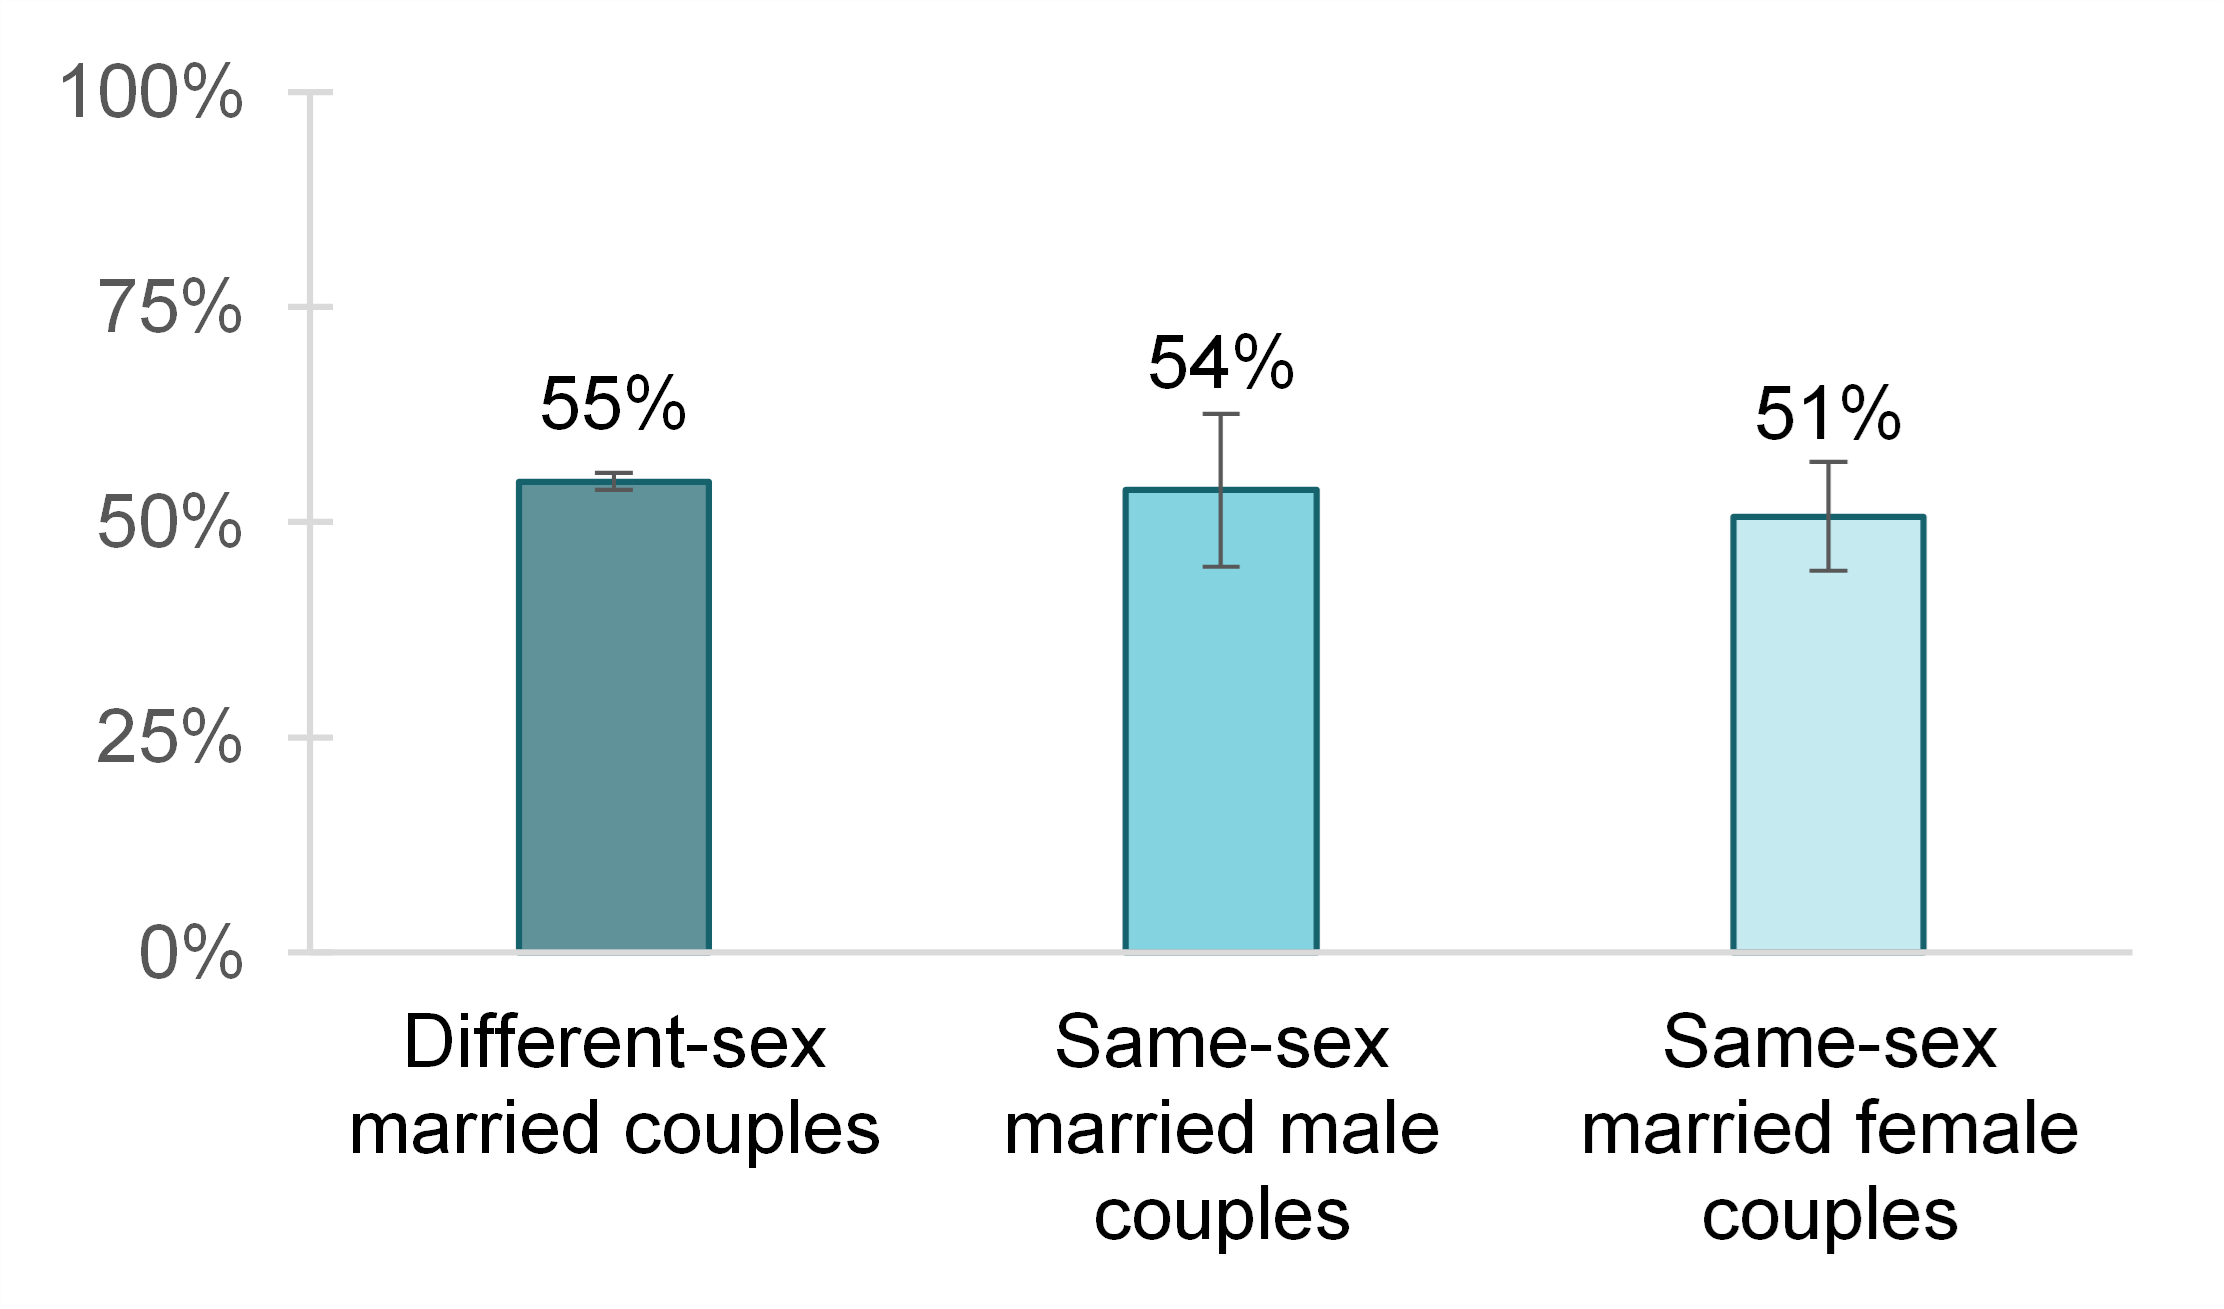
Figure 5. Mean Household Income by Composition of Recently Married Couples, 2022
Source: NCFMR analyses of the American Community Survey PUMS 1-year estimates, 2022
Data Source:
U.S. Census Bureau, American Community Survey PUMS 1-year estimates, 2022.
References:
Payne, K. K. & Manning, W. D. (2021). Recent marriages to same-sex and different-sex couples: Mobility, region, home ownership, and household income. Family Profiles, FP-21-20. Bowling Green, OH: National Center for Family & Marriage Research. https://doi.org/10.25035/ncfmr/fp-21-20
Westrick-Payne, K. K. & Manning, W. D. (2023). Recent marriages to same-sex and different-sex couples: Marital History and Age at Marriage. Family Profiles, FP-23-27. Bowling Green, OH: National Center for Family & Marriage Research. https://doi.org/10.25035/ncfmr/fp-23-27
Suggested Citation:
Westrick-Payne, K. K. & Manning, W. D. (2023). Recent marriages to same-sex and different-sex couples: Mobility, region, home ownership, and household income, 2022. Family Profiles, FP-23-28. Bowling Green, OH: National Center for Family & Marriage Research. https://doi.org/10.25035/ncfmr/fp-23-28
Updated: 11/12/2025 10:07AM

