Women Who Gave Birth Within the Past 12 Months, 2018
Family Profile No. 17, 2020
Author: Valerie Schweizer
The link between marriage and childbearing has become weaker over time (Hayford, Guzzo, & Smock, 2014). In fact, the share of births to unmarried women accounted for almost 40% of all births in 2018 (Martin et al., 2019). Using 2018 American Community Survey (ACS) data, this profile examines the demographic characteristics of currently married and unmarried women aged 15 to 50 who had a birth within the last 12 months. This profile is an update to FP-13-10.
Marital Status and Marital Histories
- The share of women who gave birth in the last year who were unmarried remained essentially unchanged over the past decade (37% in 2008, 36% in 2018, not shown).
- The majority of these recent unmarried mothers have never been married (82%, not shown).
- Among currently married women who had a recent birth, most were in first marriages (91%), and only 7% both married and had a birth within the past year (not shown).
Educational Attainment
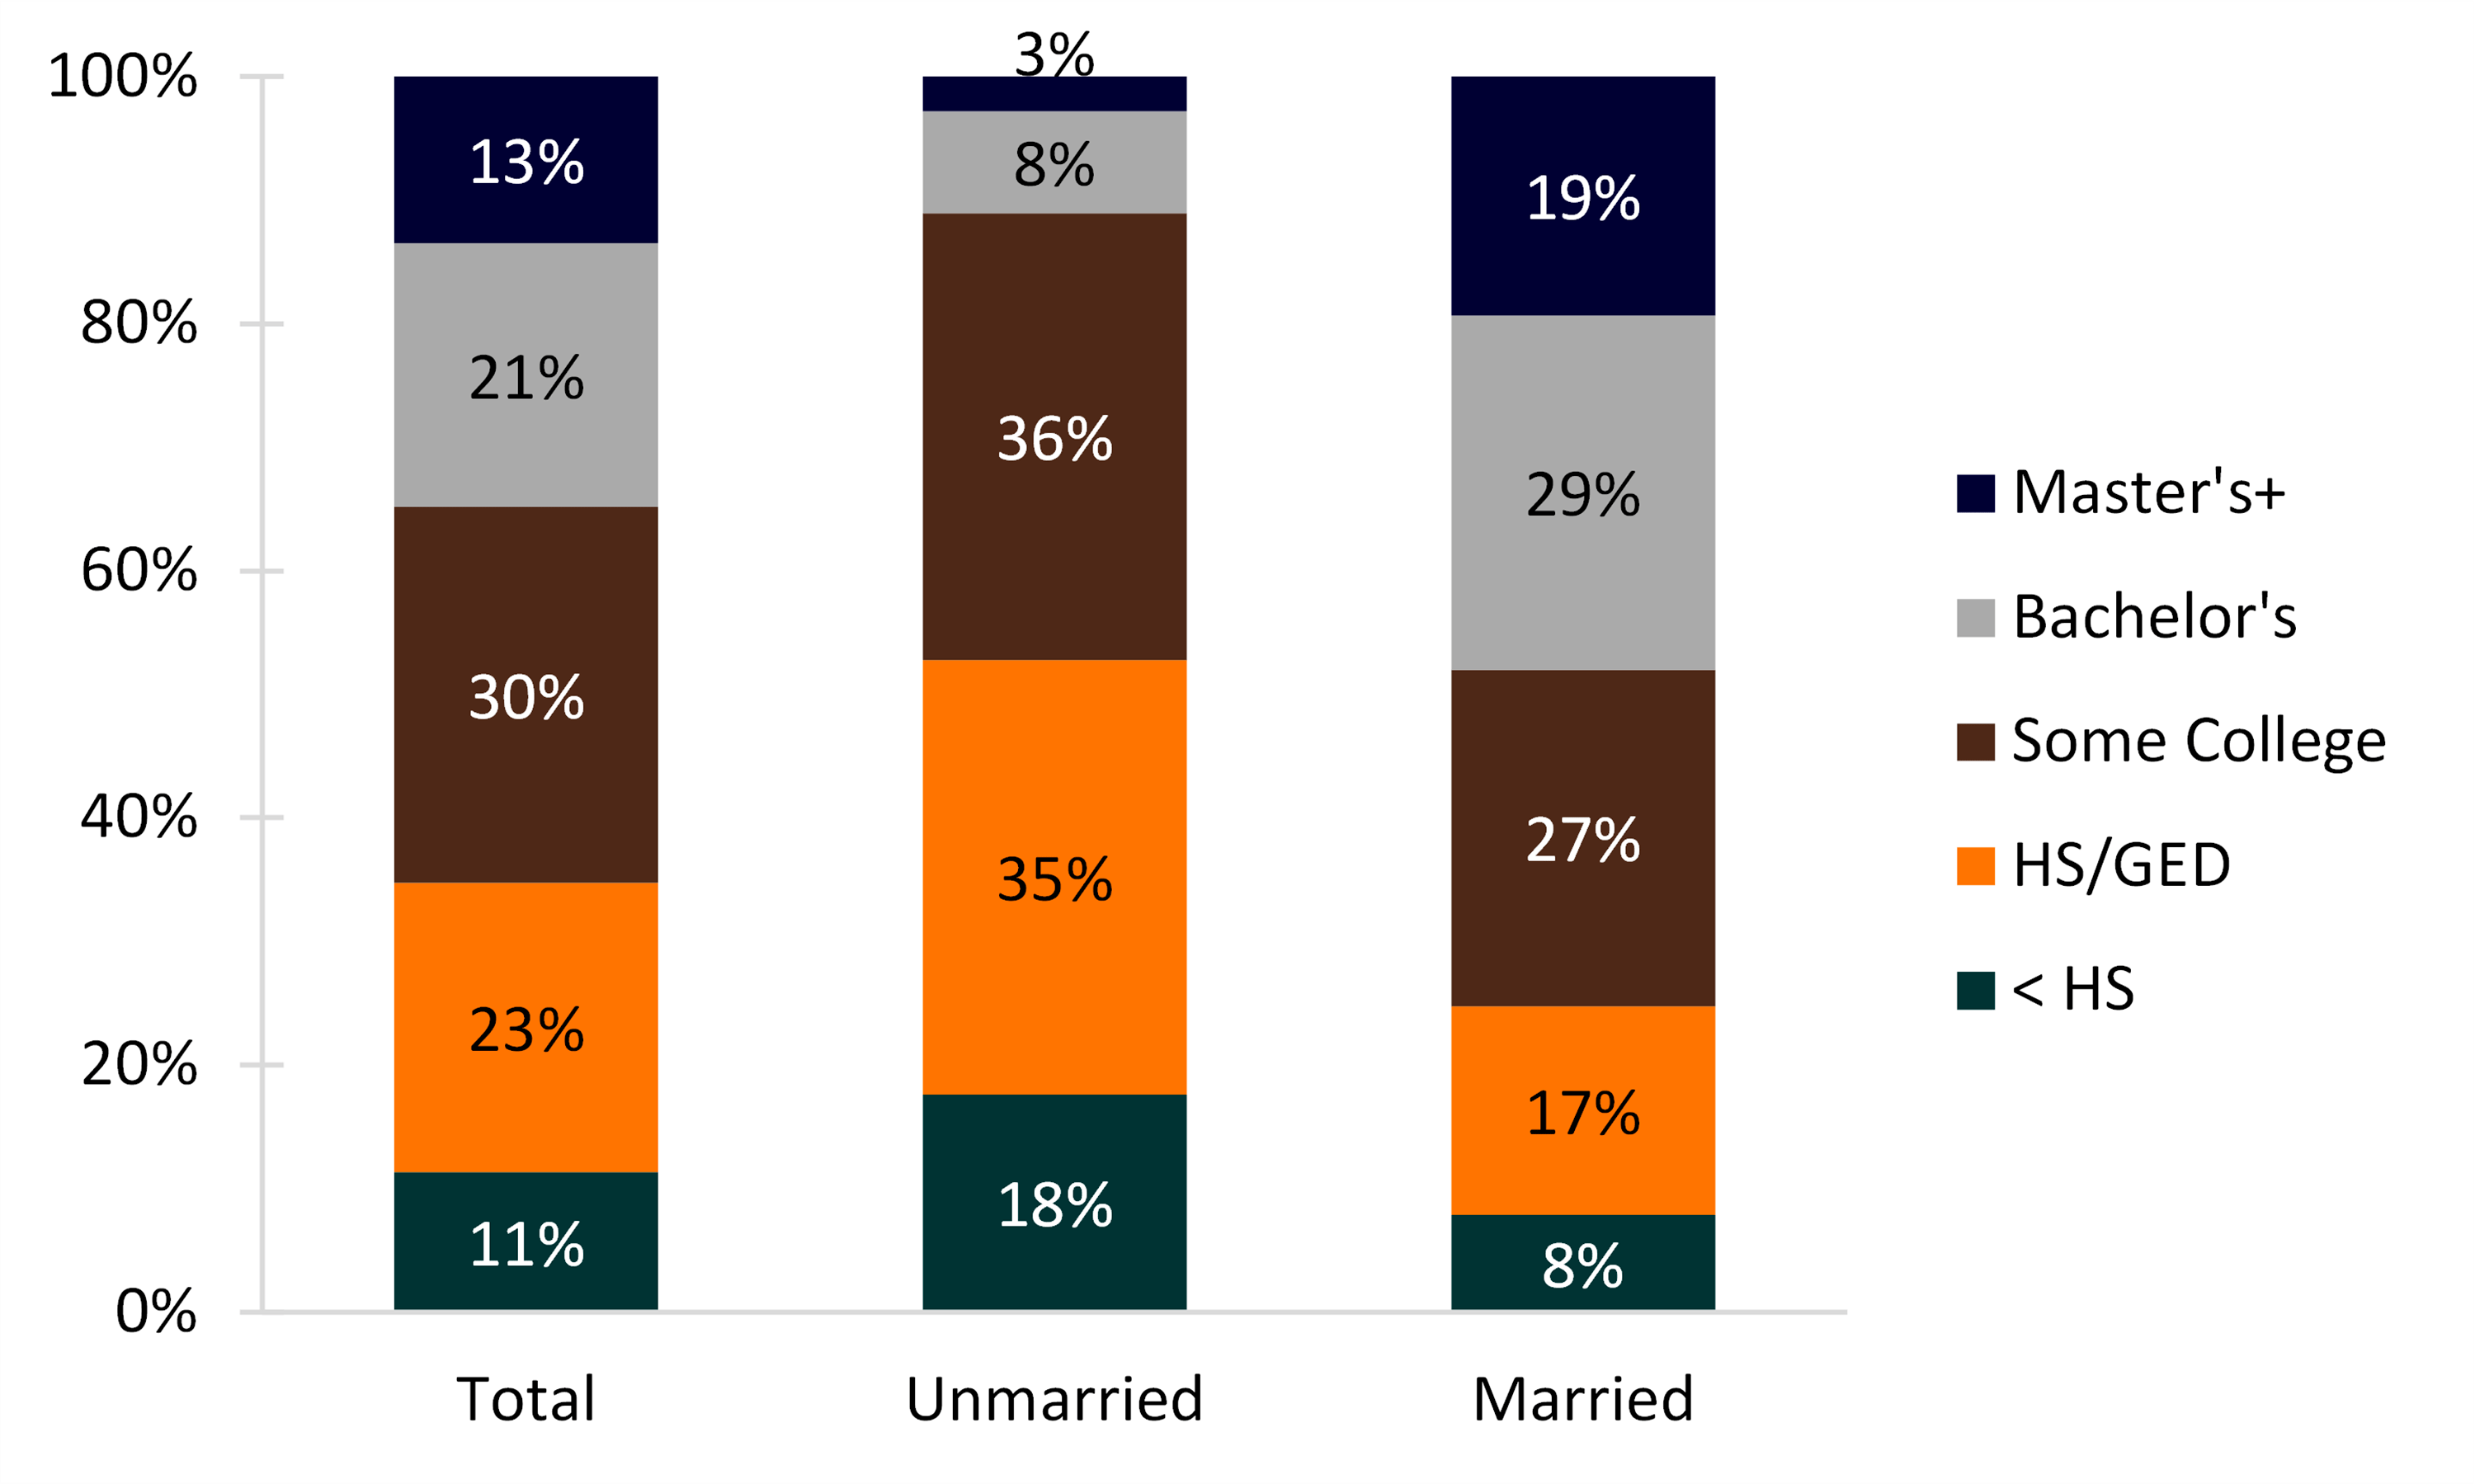
Married women who had a child in the last 12 months typically had higher levels of education than their unmarried counterparts.
- Only 8% of unmarried women had a bachelor’s degree and 3% had a master’s degree or higher, while 29% and 19% of married women had these degrees, respectively.
- Nearly one-fifth (18%) of unmarried women who had a birth in the last 12 months had less than a high school education compared to only 8% of married women.
Figure 1. Marital Status by Educational Attainment, 2018

Race/Ethnicity
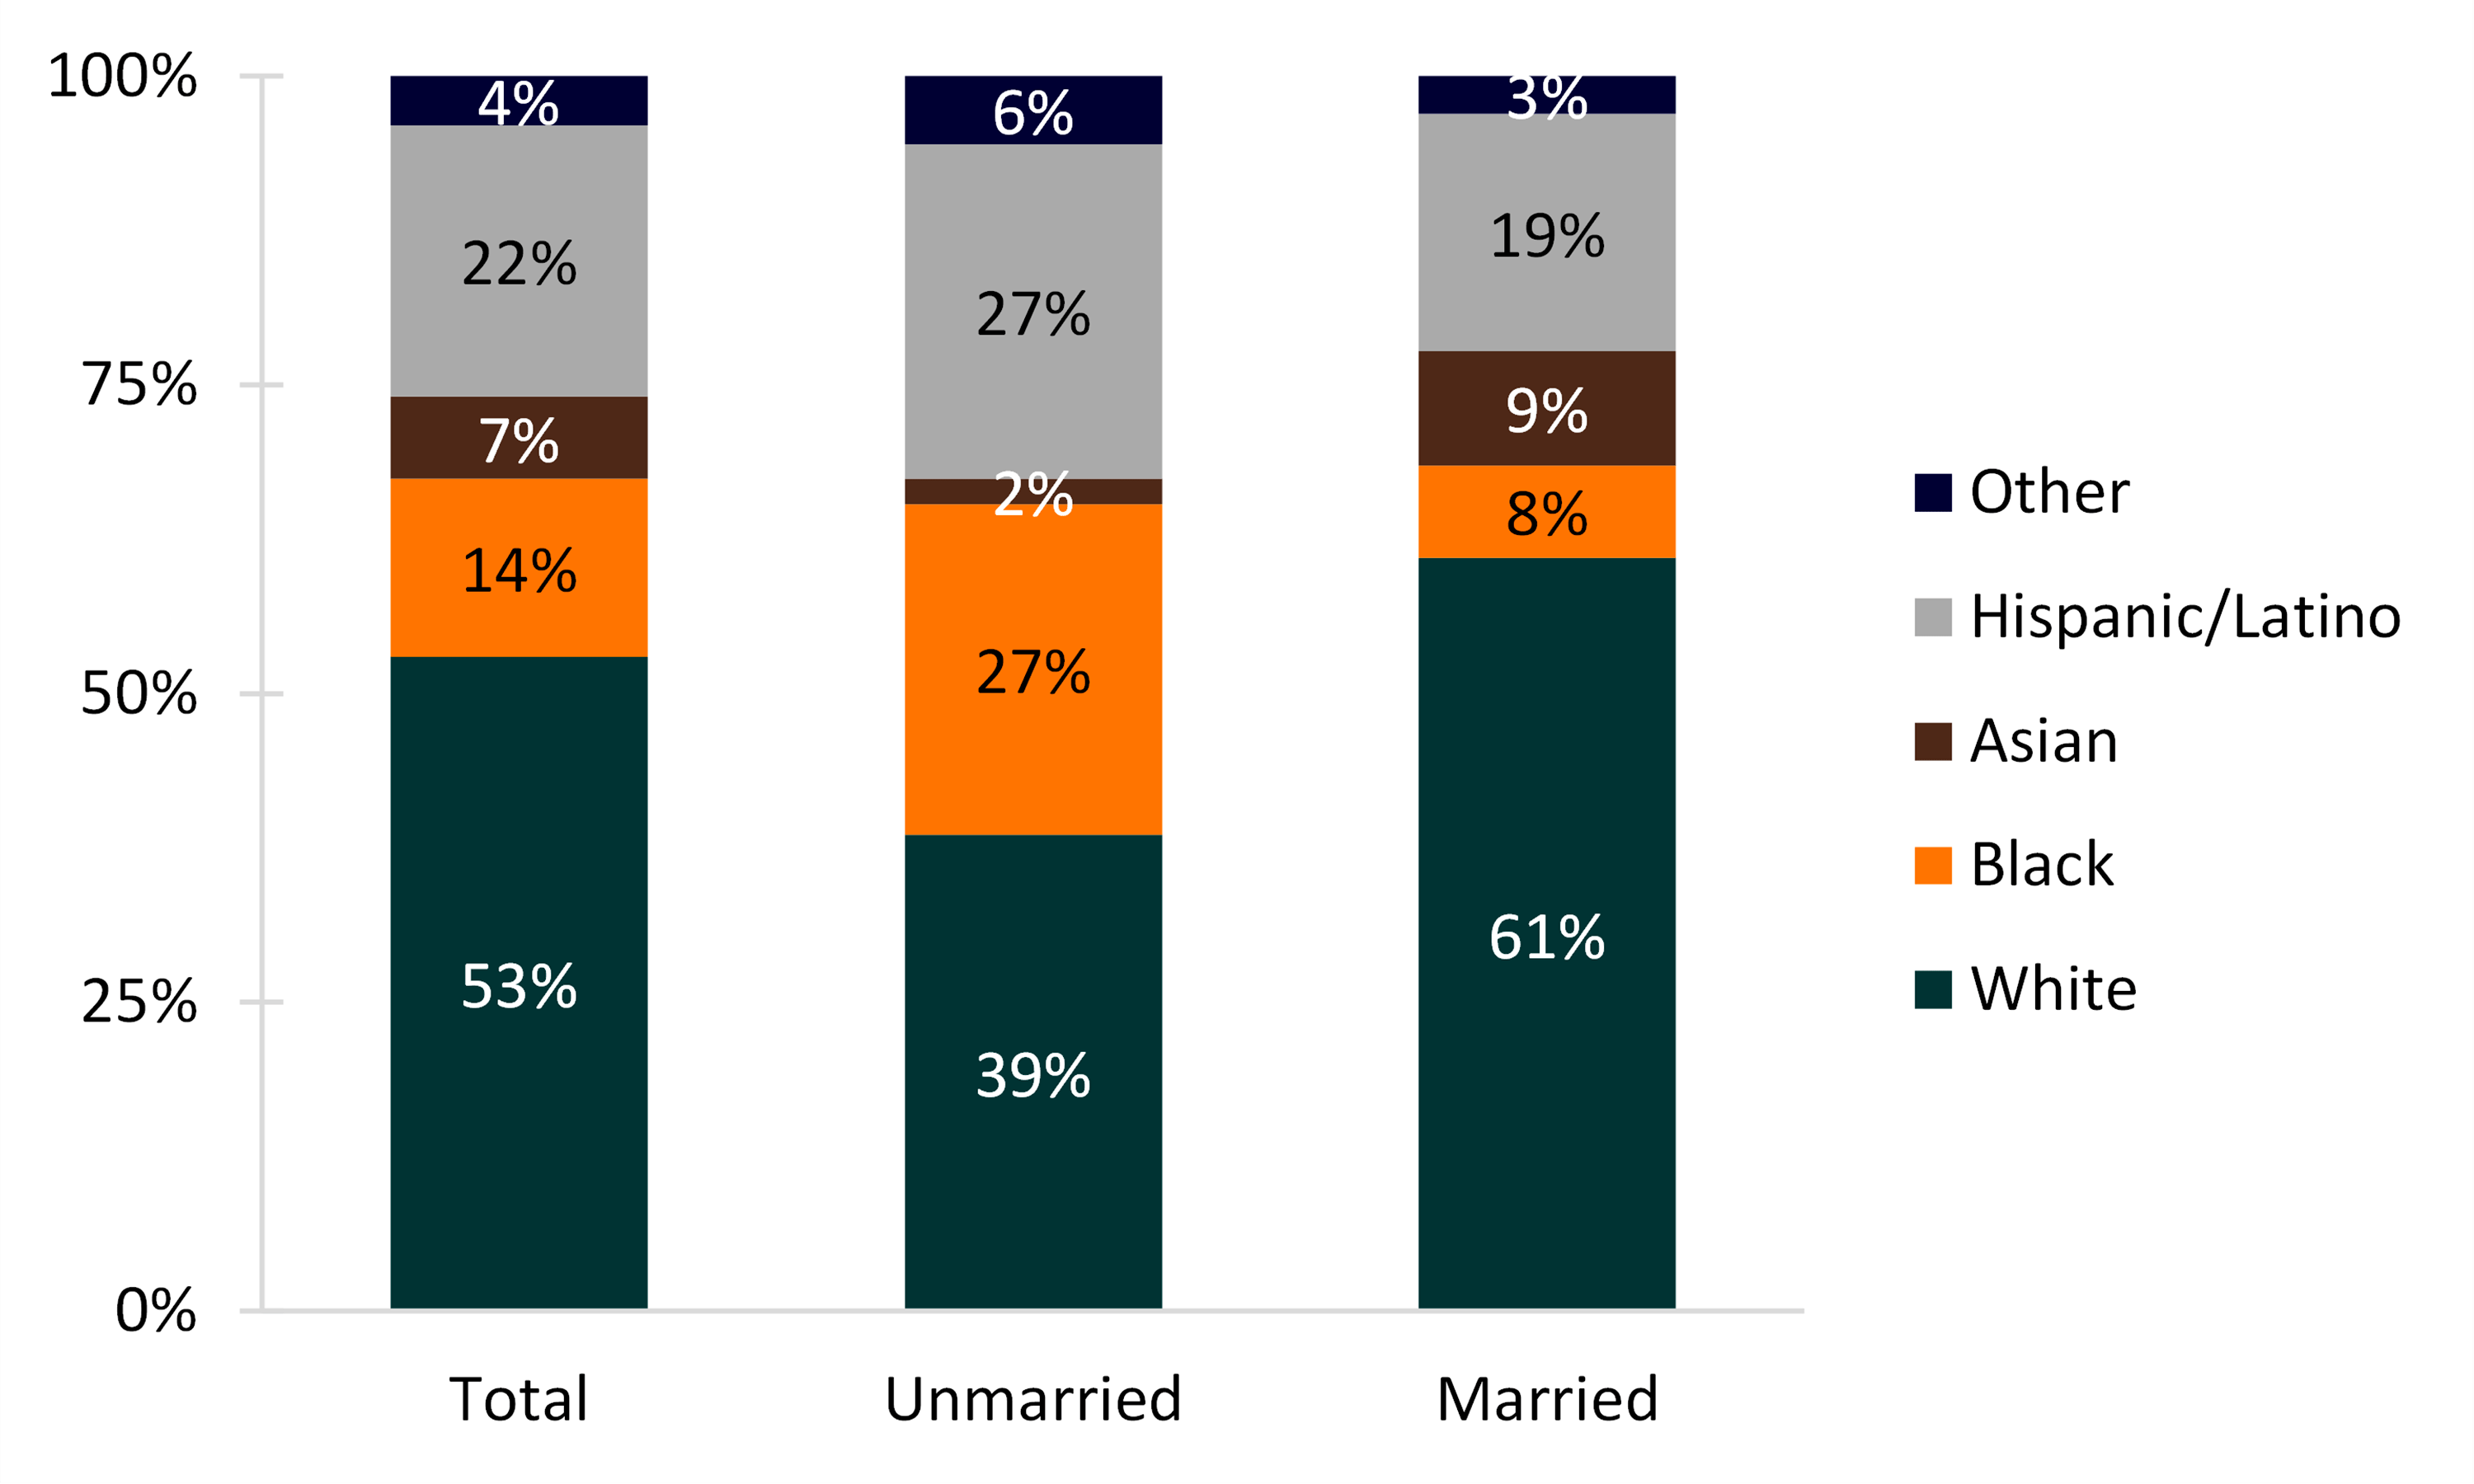
- There is notable racial variation in the marital statuses of women who gave birth in the last year.
- Among women with a recent birth, 39% of unmarried women and 61% of married women were White.
- Among unmarried women with a recent birth, Blacks and Hispanics made up over one-fourth (27% each), but among married women they only accounted for 8% and 9%, respectively.
- Asians comprised 2% of unmarried women and 9% of married women with births in the last year.
- Other women represented 6% of unmarried and 3% of married women who had a birth in the past 12 months.
Figure 2. Marital Status by Race/Ethnicity, 2018

Age Group
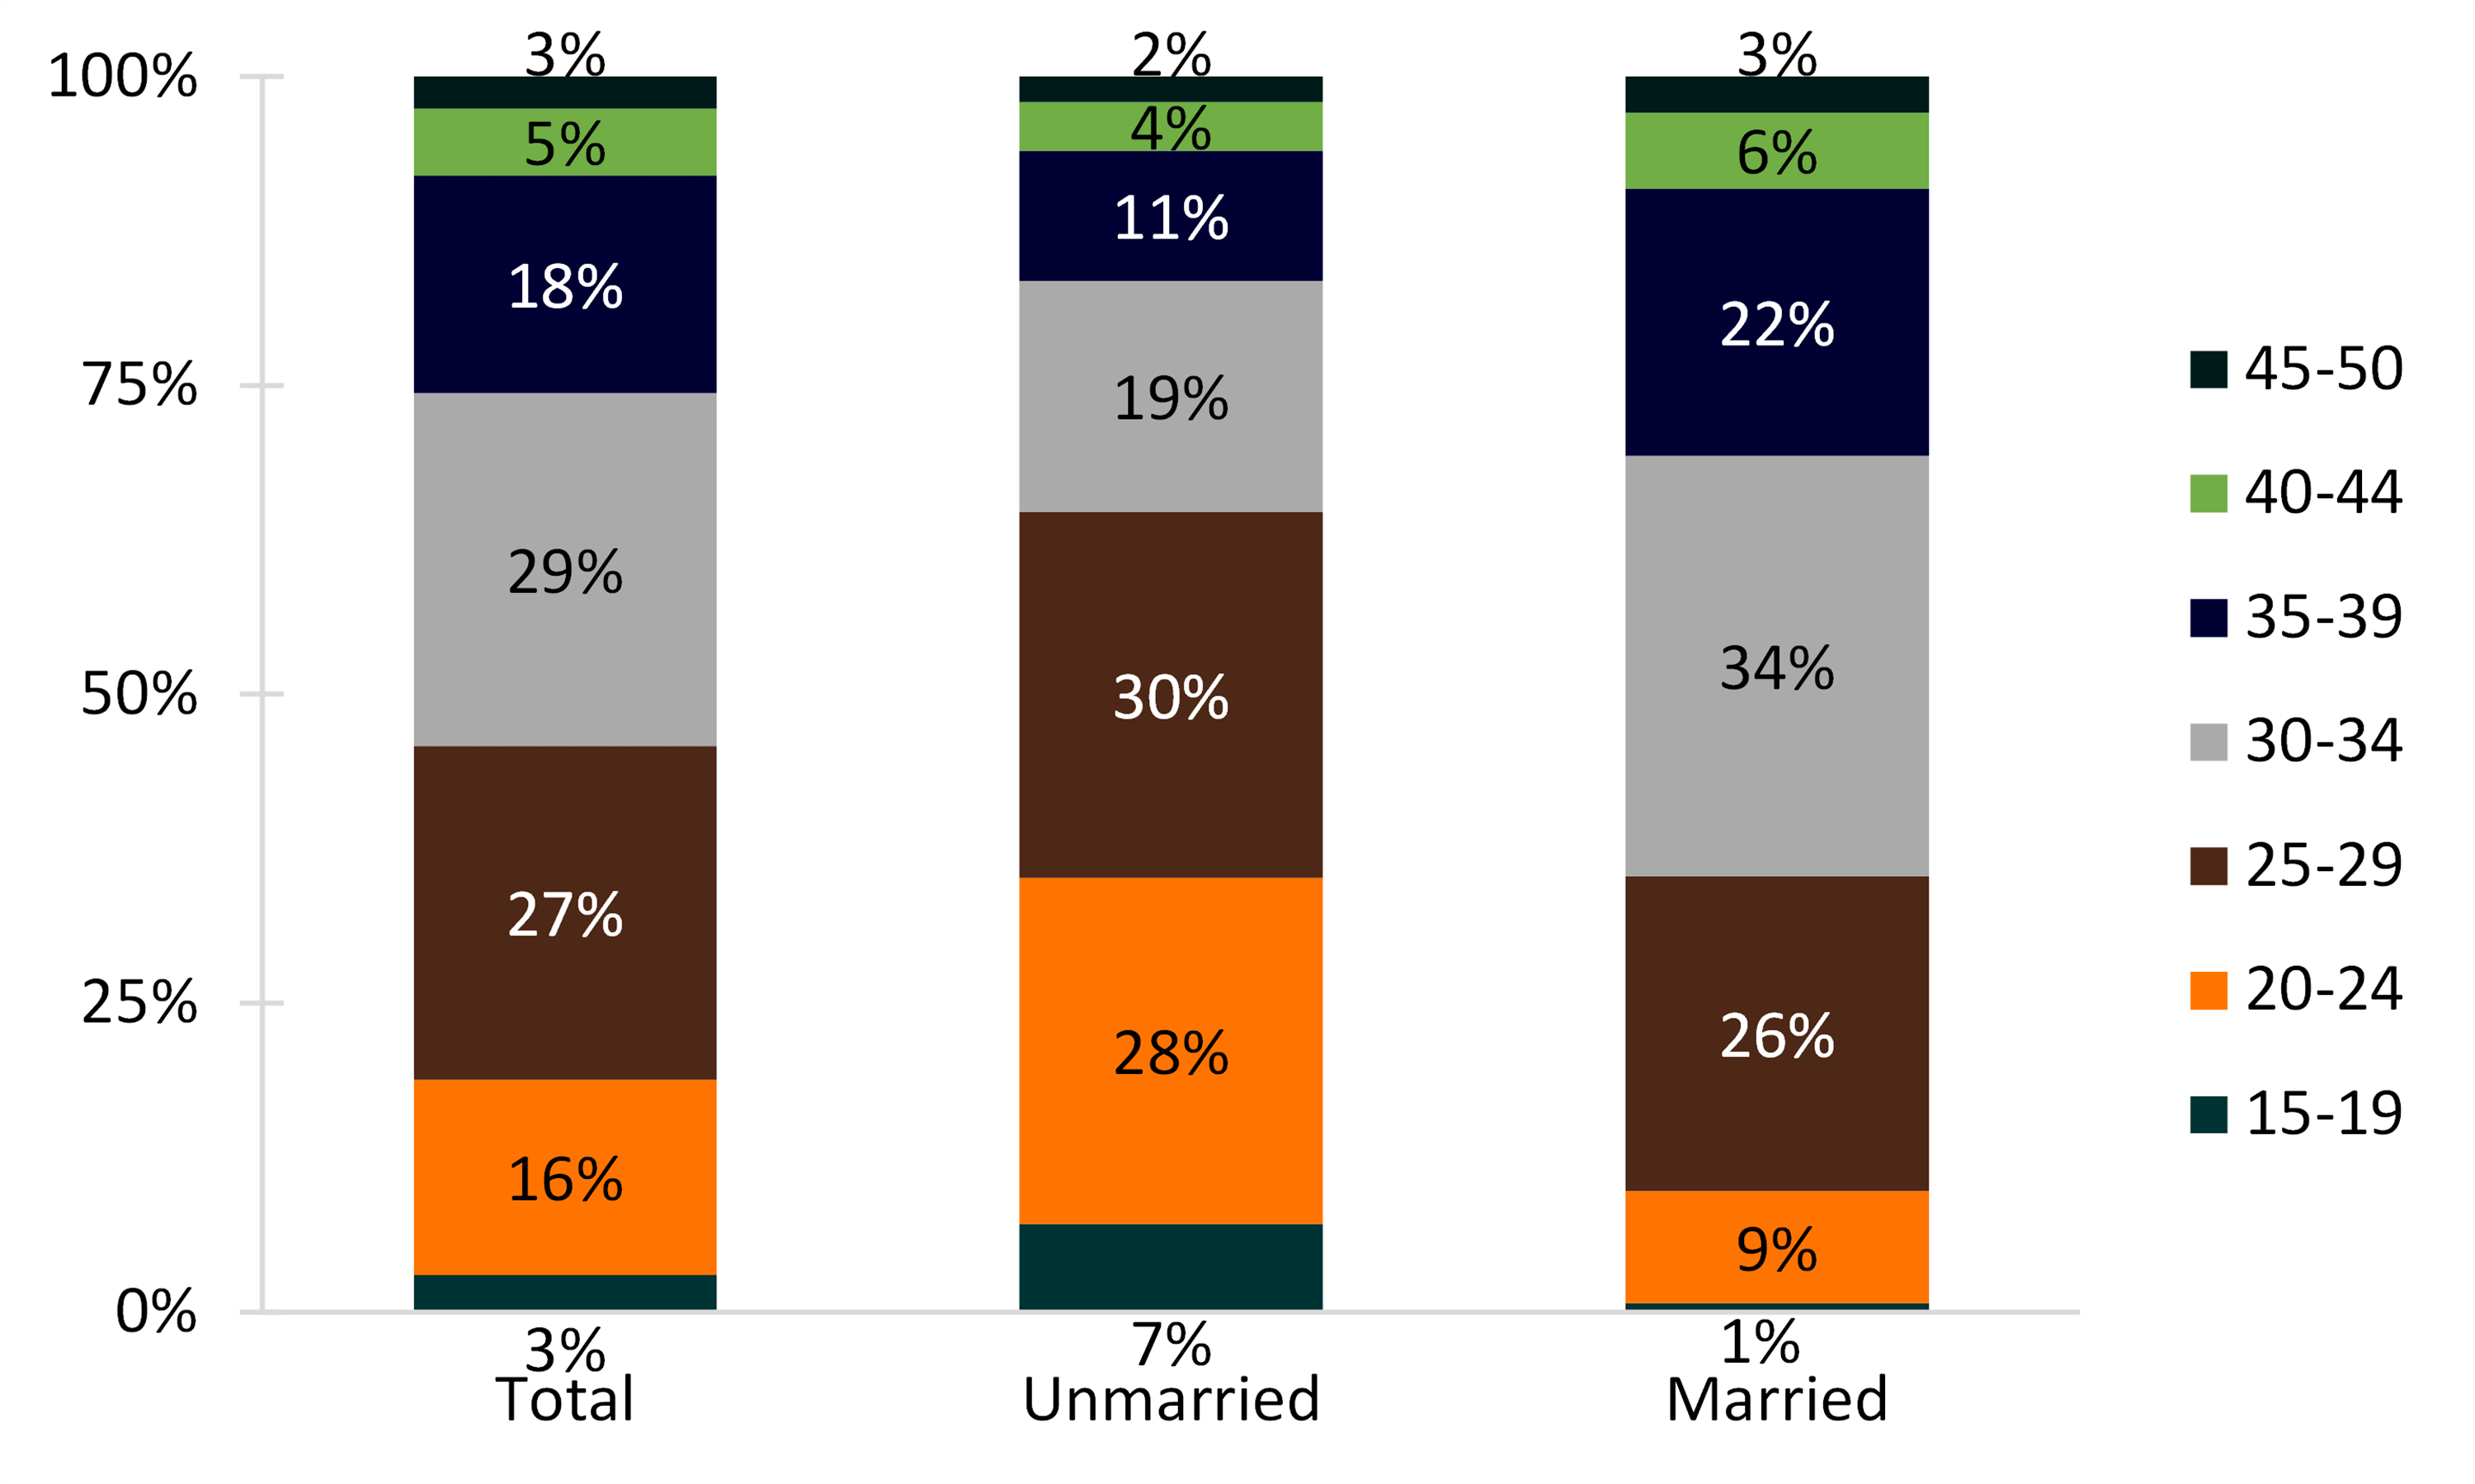
Overall, married women who gave birth in the last year were older than their unmarried counterparts.
- 65% of unmarried women who had a birth in the last year were under age 30. Only 36% of married women were below age 30.
- It was most common for unmarried women who had a birth in the last 12 months to be between ages 25 to 29. For married women, it was most common to be between ages 30 and 34.
Figure 3. Marital Status by Age Group, 2018

Data Source
U.S. Census Bureau; American Community Survey (ACS), One-Year Public Use Microdata Sample (PUMS), 2018.
References
- Cruz, J. (2013). Women who gave birth within the past 12 months, 2011. (FP-13-10). National Center for Family & Marriage Research. Retrieved from http://ncfmr.bgsu.edu/pdf/family_profiles/file126776.pdf
- Hayford, S. R., Guzzo, K. B., & Smock, P. J. (2014). The decoupling of marriage and parenthood? Trends in the timing of marital first births, 1945–2002. Journal of Marriage and Family, 76(3), 520-538.
- Martin J. A., Hamilton, B. E., Osterman, M. J. K., et al. (2019). Births: Final data for 2018. National vital statistics reports; vol. 68 no. 13. Hyattsville, MD: National Center for Health Statistics. https://www.cdc.gov/nchs/data/nvsr/nvsr68/nvsr68_13-508.pdf
Suggested Citation
- Schweizer, V. J. (2020). Women Who Gave Birth Within the Past 12 Months, 2018. Family Profiles, FP-20-17. Bowling Green, OH: National Center for Family & Marriage Research. https://doi.org/10.25035/ncfmr/fp-20-17
Updated: 11/12/2025 09:50AM

