First Marriage vs. Remarriage in the U.S., 2017
Family Profile No. 8, 2019
Author: Valerie Schweizer
This profile compares the demographic characteristics of women 18 and older experiencing a first marriage versus a remarriage in the U.S. in 2017. The overall first marriage rate among women in 2017 was 46 women per 1,000 never married women, while the remarriage rate was 21 per 1,000 previously married. Learn more about recent patterns in first marriage rates (FP-18-14) and remarriage rates (FP-18-16).
Remarriage in the U.S., 2017
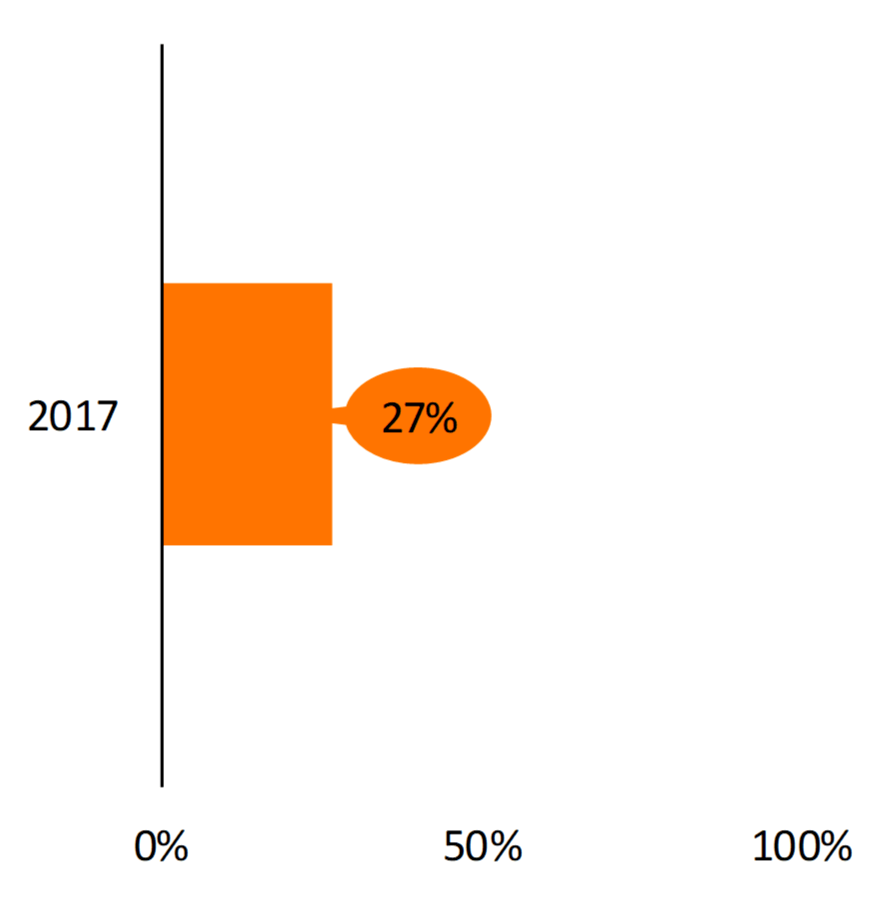
- Among all women who married in 2017, 27% were entering a remarriage.
Figure 1. Share of Women’s Marriages That Were Remarriages, 2017
Educational Attainment of First Married and Remarried Adults, 2017
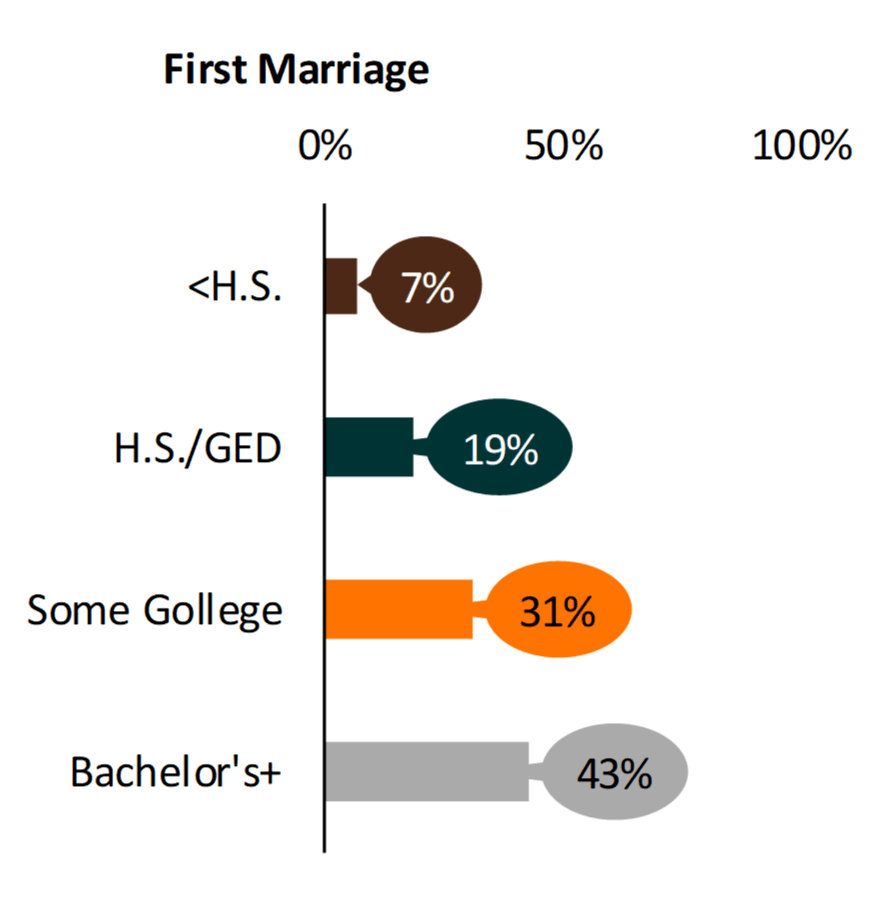
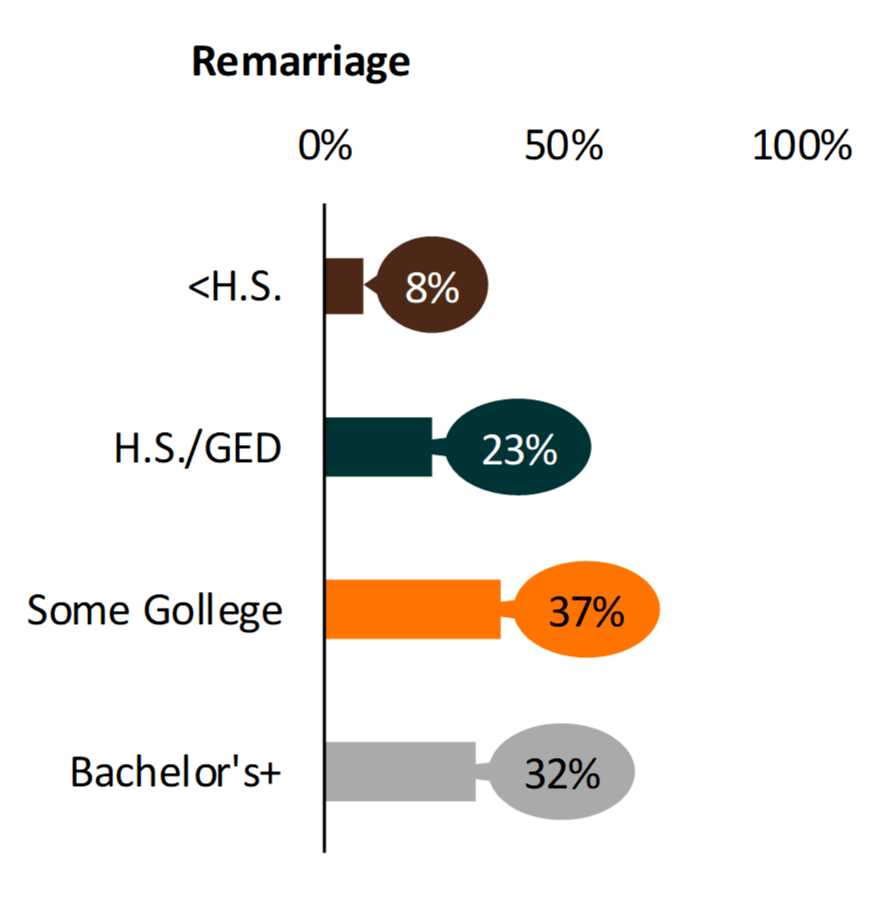
- The largest share of women who entered a first marriage in 2017 earned at least a bachelor’s degree (43%), a larger proportion than those who remarried (32%).
- Among those who remarried, some college is the modal education category (37%), the same category as in 2010 (FP-12-21); although the share of remarrieds with a bachelor’s or more has increased since 2010 (from 24% to 32%).
Figure 2. Marriage Type by Education, 2017
Source: NCFMR analyses of U.S. Census Bureau, American Community Survey, 1-yr. est., 2017
Race and Ethnicity of First Married and Remarried Adults, 2017
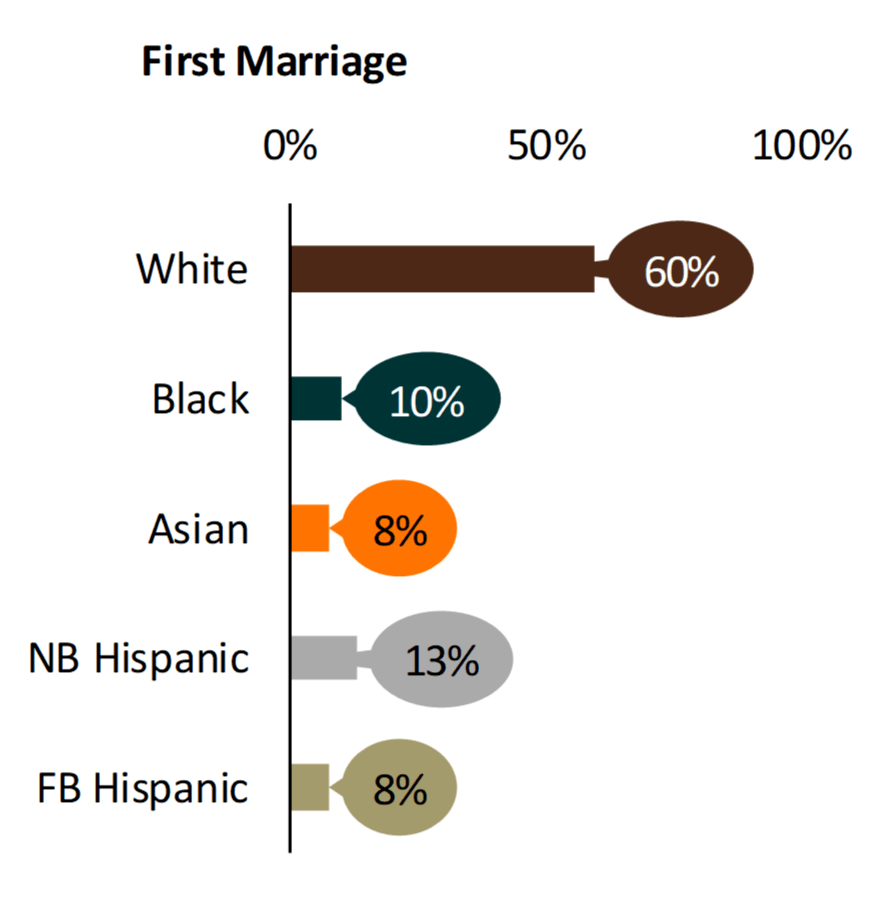
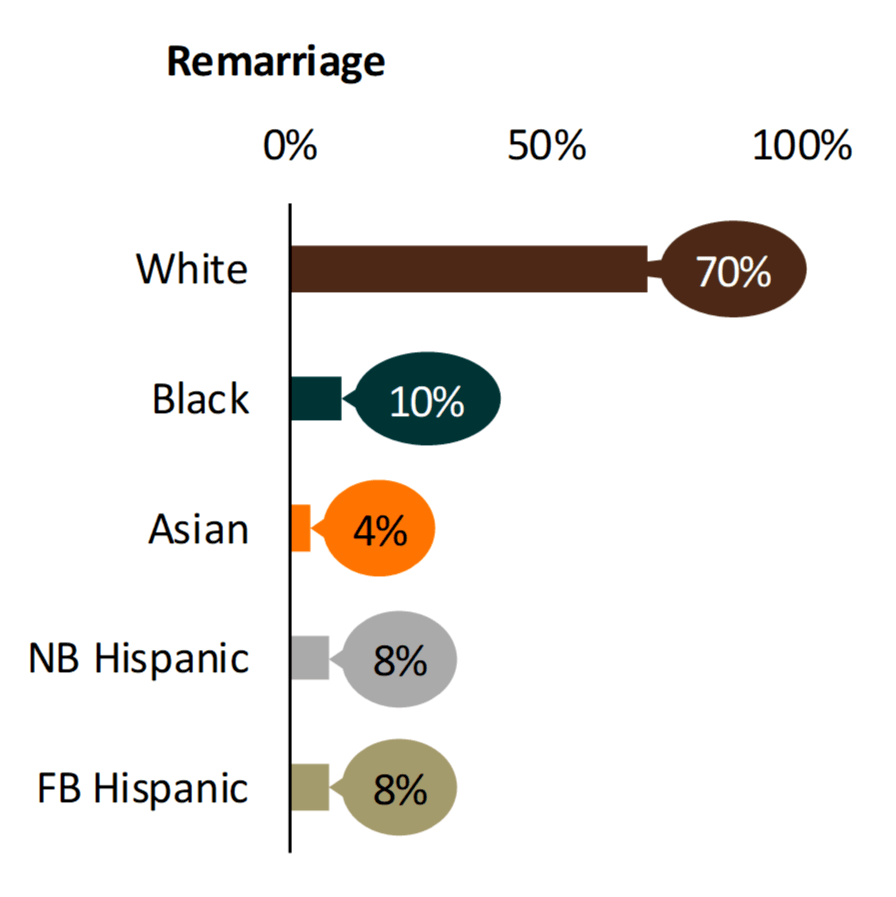
- 60% of women entering a first marriage in 2017 were White compared with over two-thirds (70%) of women who remarried.
- Of women who entered a first marriage in 2017, the second largest share following Whites was native-born Hispanic/Latinas with 13%.
- Foreign-born Hispanic/Latinas comprised 8% of women entering a first marriage and a remarriage in 2017.
- Black women accounted for 10%of those entering a first marriage and remarriage.
Figure 3. Marriage Type by Race and Ethnicity, 2017
Source: NCFMR analyses of U.S. Census Bureau, American Community Survey, 1-yr. est., 2017
Age Distribution of First Married and Remarried Adults, 2017
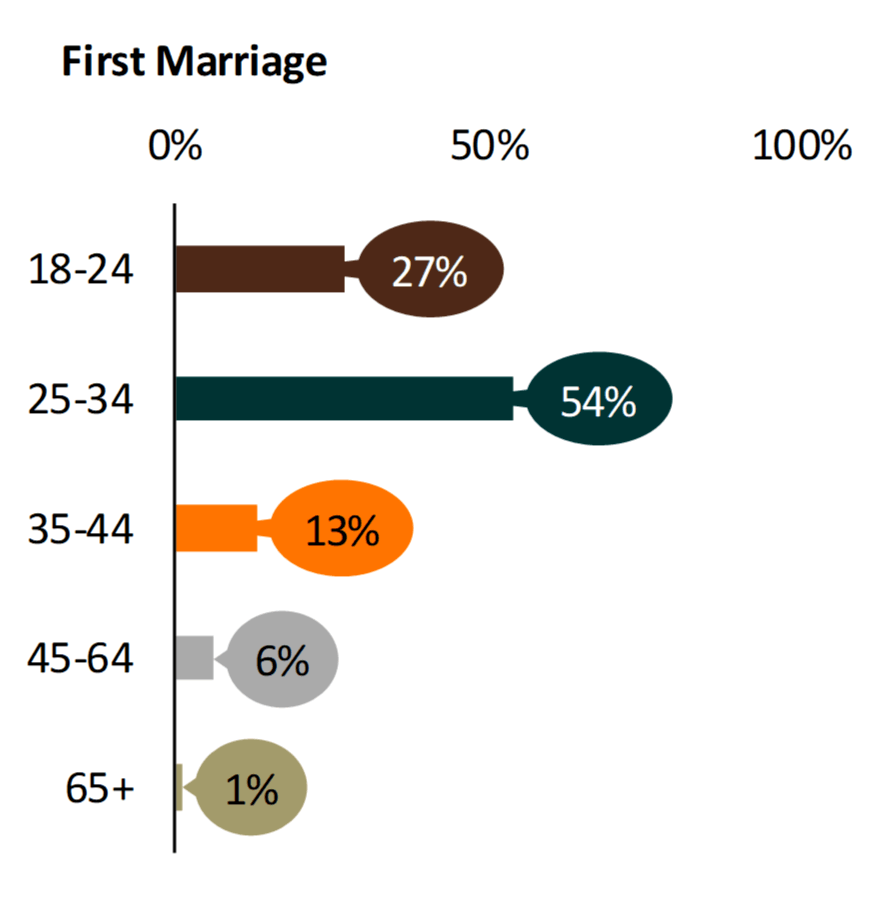
- Most first marriages occur to individuals under the age of 35 (81%). Over half (54%) were to individuals aged 25-34, aligning with the median age at first marriage in 2017, which was 28 for women and 30 for men (FP-19-06).
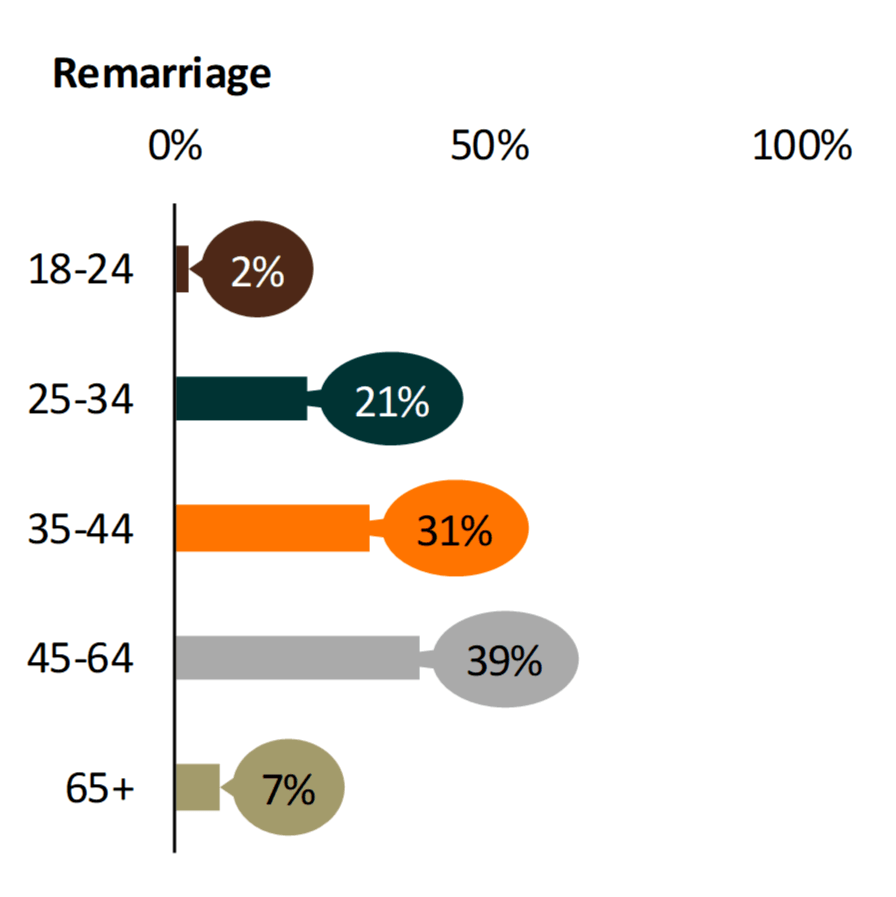
- Individuals who remarry tend to be slightly older than those who marry for the first time. In 2017, 39% of remarriages occurred among 45 to 64- year-olds, making this the largest share of remarriages. The second largest group among remarriages was 35 to 44-year-olds (31%).
- Those 65 and older only comprised 1% of first marriages in 2017, but they represented 7% of remarriages.
Figure 4. Marriage Type by Age, 2017
Source: NCFMR analyses of U.S. Census Bureau, American Community Survey, 1-yr. est., 2017
References
- Cruz, J. (2012). First marriage vs. remarriage in the U.S., 2010. Family Profiles, FP-12-21. Bowling Green, OH: National Center for Family & Marriage Research. https://www.bgsu.edu/content/dam/BGSU/college-of-arts-and-sciences/NCFMR/documents/FP/FP-12-21.pdf
- Payne, K. K. (2018). First marriage rate in the U.S., 2016. Family Profiles, FP-18-14. Bowling Green, OH: National Center for Family & Marriage Research. https://doi.org/10.25035/ncfmr/fp-18-14
- Payne, K. K. (2018). Change in the U.S. remarriage rate, 2008 & 2016. Family Profiles, FP-18-16. Bowling Green, OH: National Center for Family & Marriage Research. https://doi.org/10.25035/ncfmr/fp-18-16
- Payne, K. K. (2019). Median age at first marriage, 2017. Family Profiles, FP-19-06. Bowling Green, OH: National Center for Family & Marriage Research. https://doi.org/10.25035/ncfmr/fp-19-06
Suggested Citation
- Schweizer, V.J. (2019). First marriage vs. remarriage in the U.S. Family Profiles, FP-19-08. Bowling Green, OH: National Center for Family & Marriage Research. https://doi.org/10.25035/ncfmr/fp-19-08.
Updated: 11/12/2025 09:41AM

