Age Variation in the Remarriage Rate, 1990 & 2018
Family Profile No. 13, 2020
Author: Valerie Schweizer
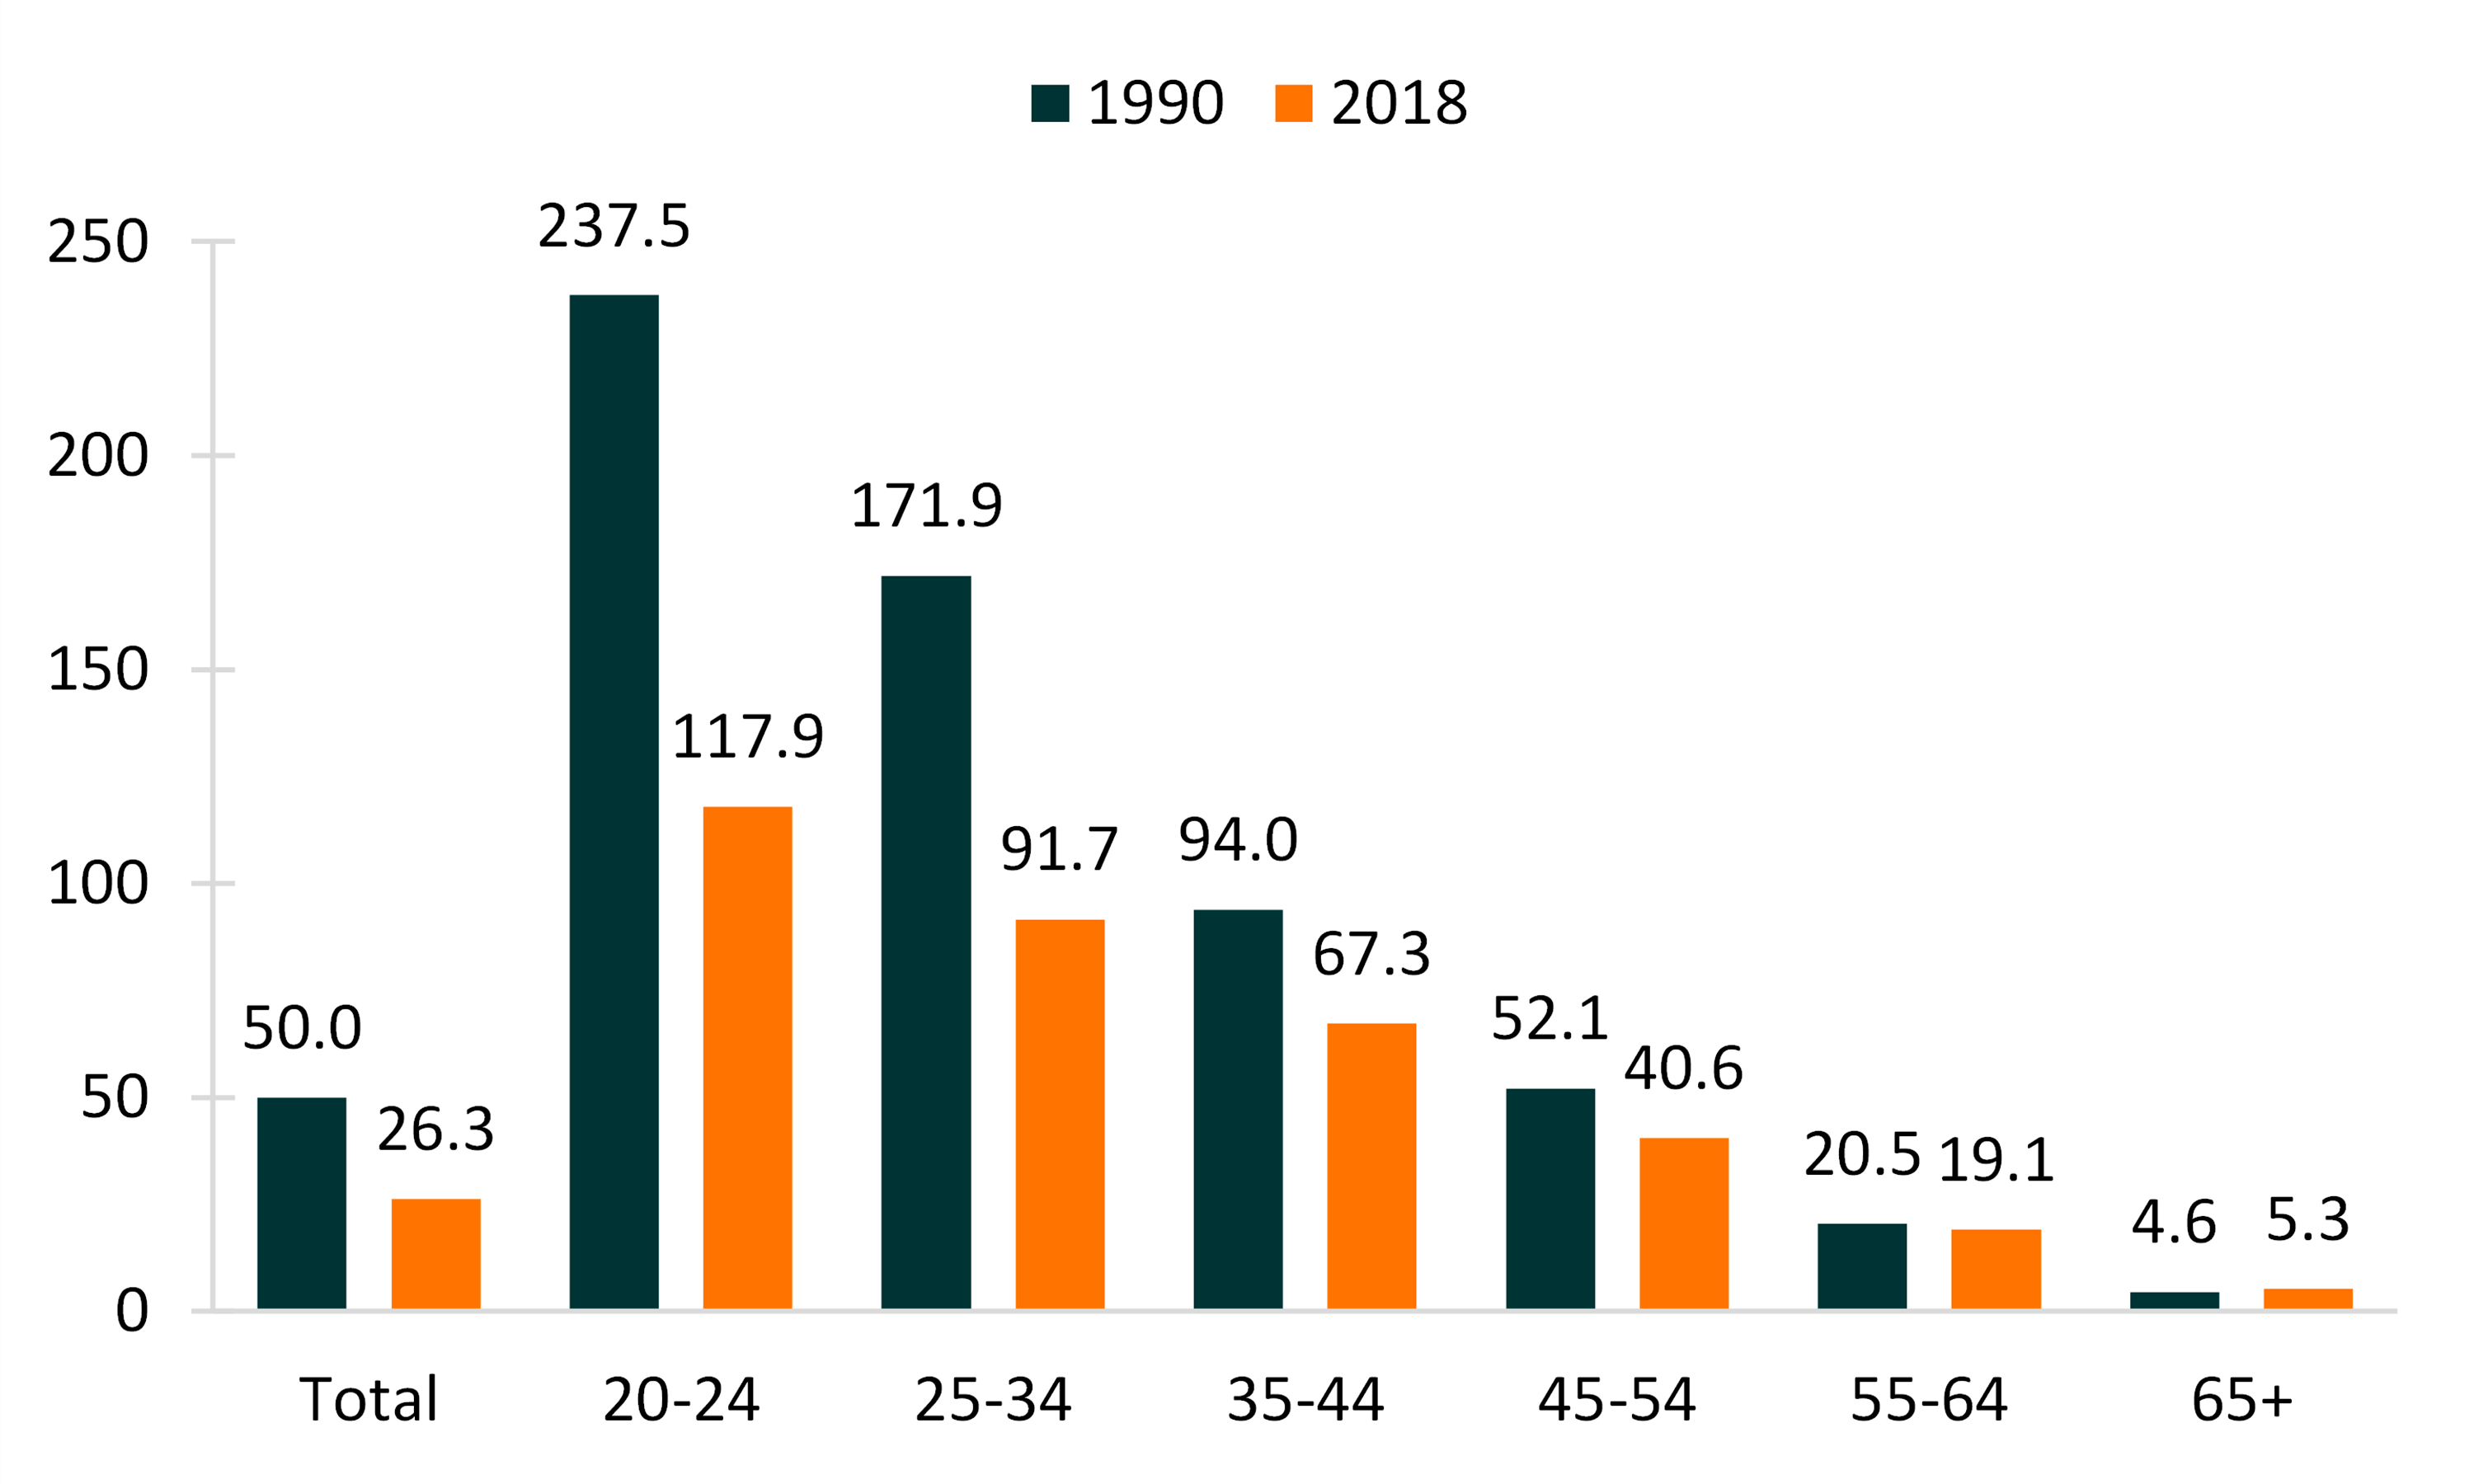
Among all adults who married in 2018, 26% entered a remarriage. The remarriage rate has fallen considerably in the last two decades. In 1990, the remarriage rate was 50 per 1,000 previously married adults (individuals divorced or widowed), falling by 2018 to 26.3 per 1,000. However, shifts in remarriage vary substantially by age group. We use 1990 U.S. Vital Statistics and the 2018 American Community Survey data to examine the change in the remarriage rate from 1990 to 2018. This profile is an update to FP-13-17 and FP-17-21.
The Remarriage Rate
- The drop in the remarriage rate is most notable at younger ages.
- Among those aged 20 to 24, the remarriage rate declined by 50% from 1990 (237.5) to 2018 (117.9).
- The remarriage rate fell about 47% among 25 to 34-year-olds from 1990 (171.9) to 2018 (91.7).
- At older ages, the remarriage rate has remained moderately stable since 1990.
- From 1990 to 2018, the remarriage rate among those aged 55 to 64 decreased marginally from 20.5 to 19.1.
- The remarriage rate for previously married adults 65 and older had increased slightly from 1990 (4.6) to 2018 (5.3).
Figure 1. Remarriage Rates by Age Groups, 1990 & 2018


“At older ages, the remarriage rate has remained moderately stable since 1990.”

Gender
- The remarriage rate has declined for both men and women from 1990 to 2018 across almost every age group.
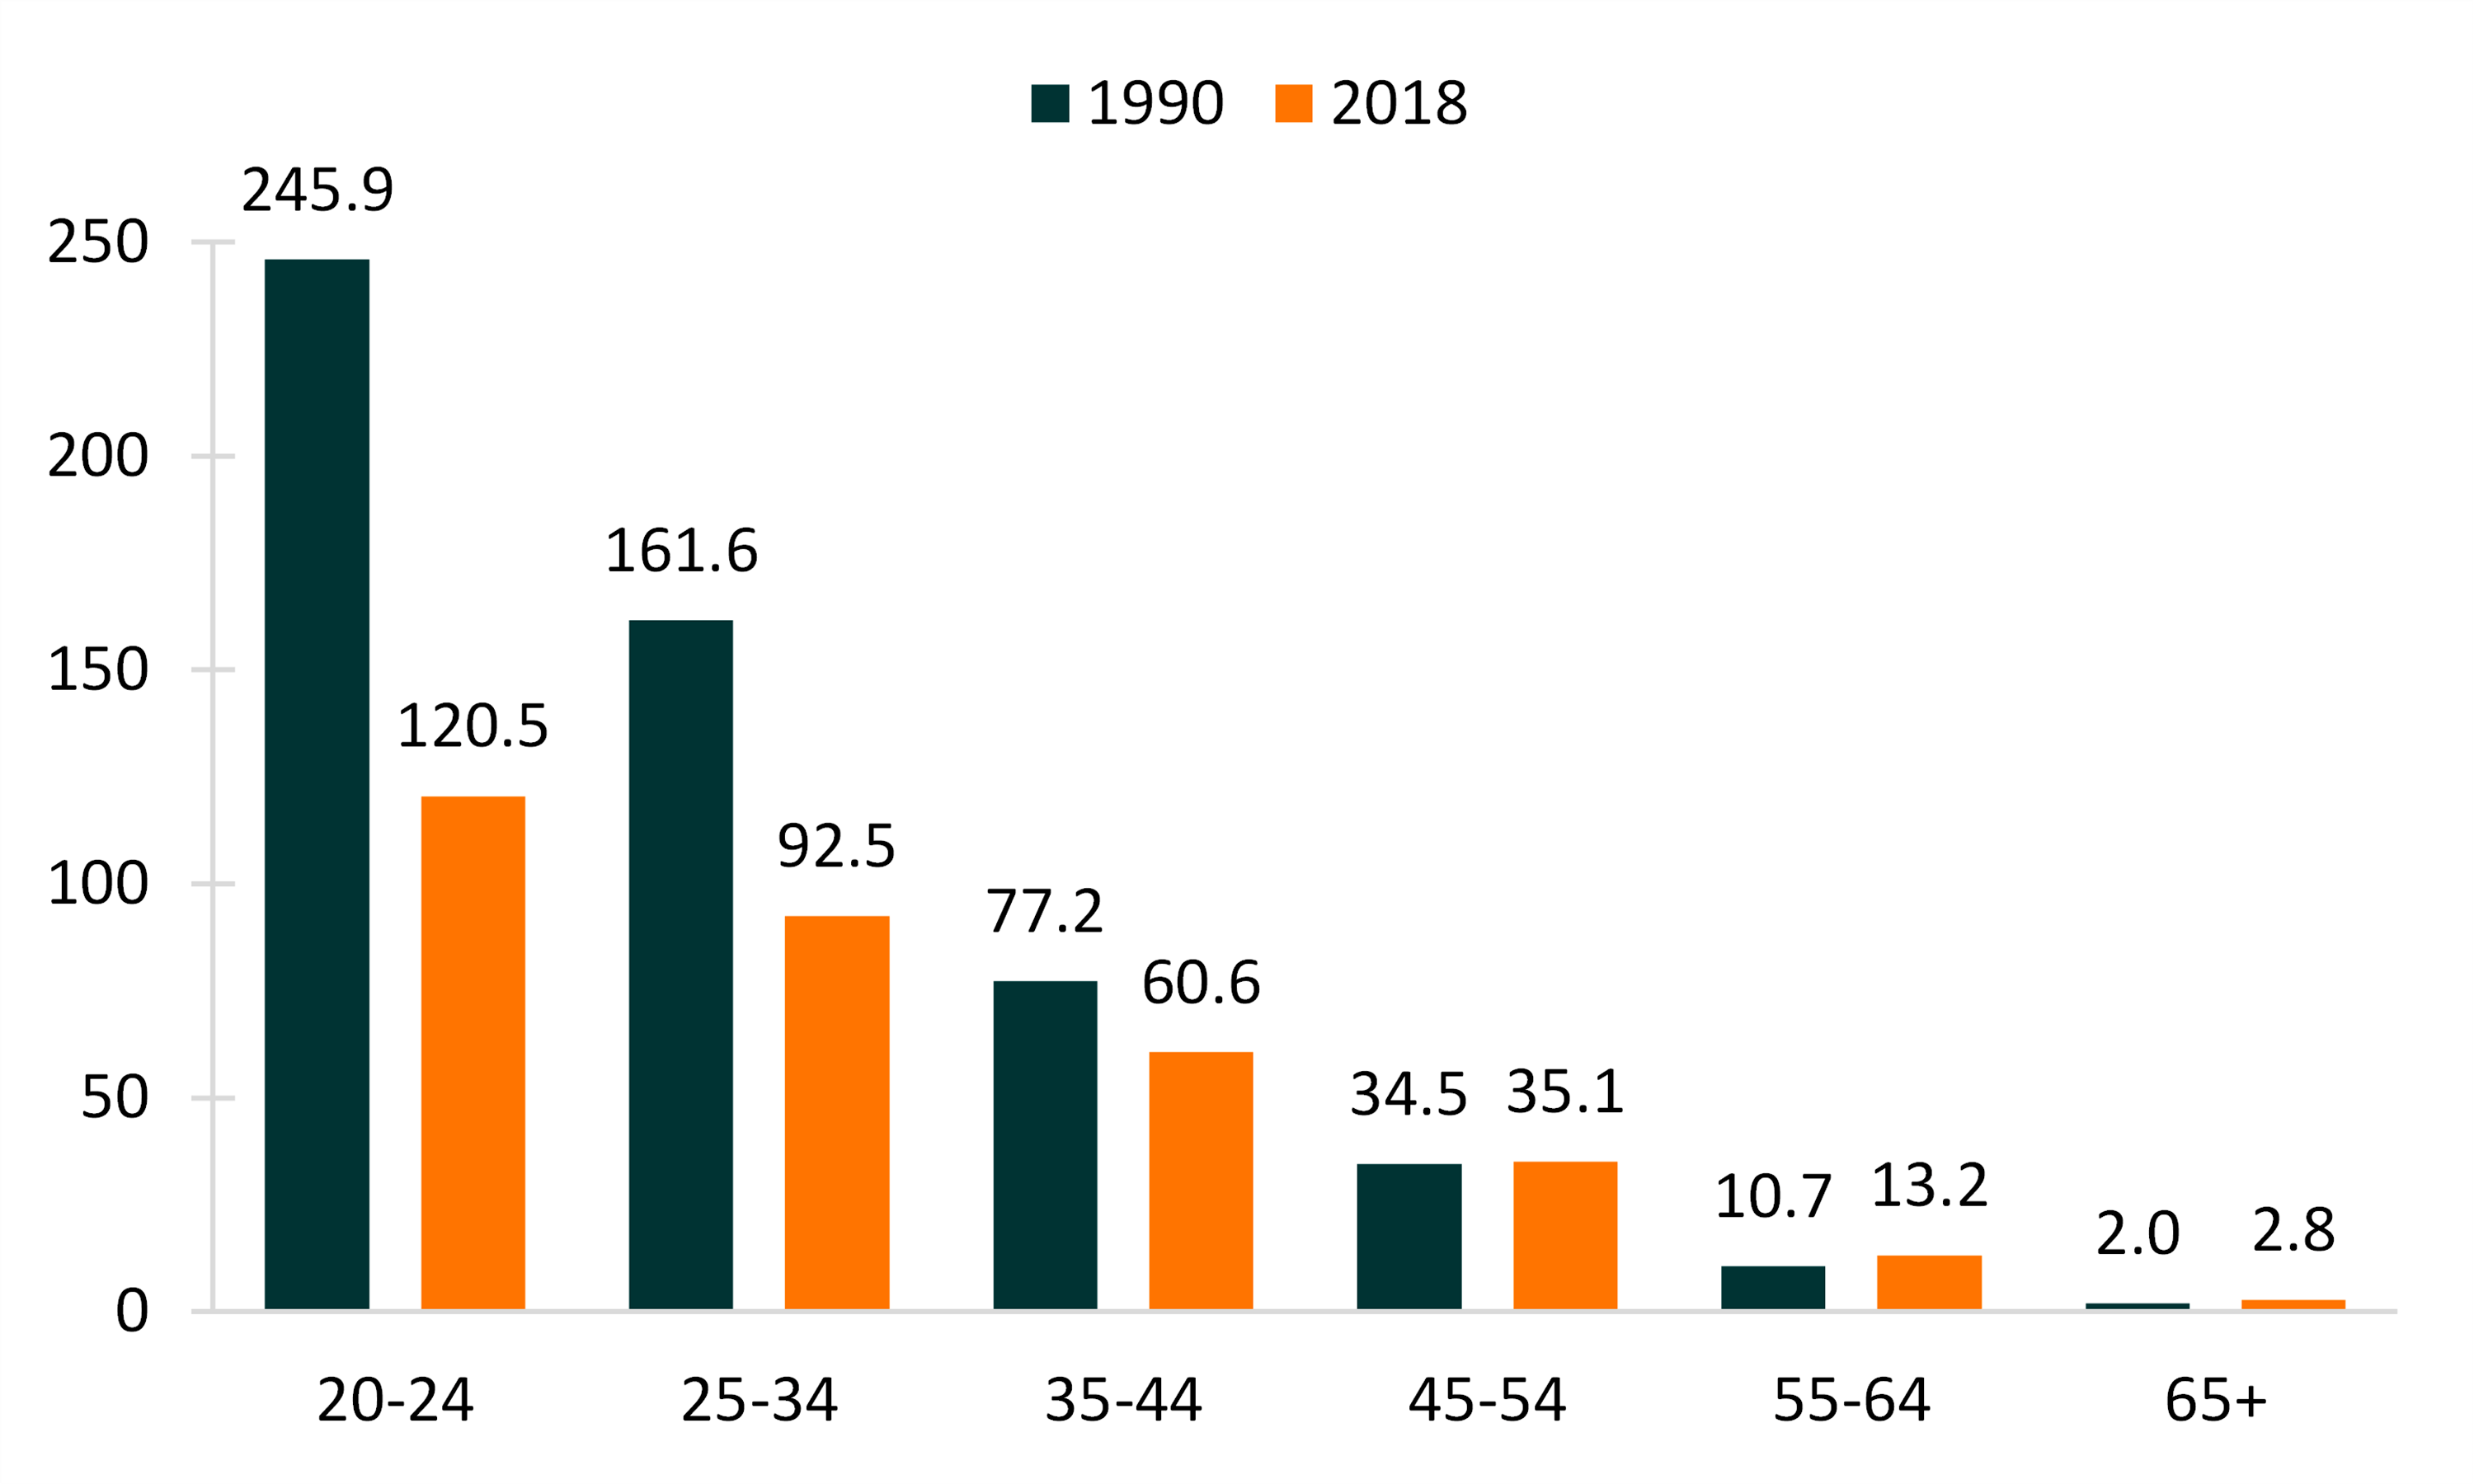
- Among those in the youngest age group (20 to 24), women had higher remarriage rates than men in 1990 (245.9 vs. 220.4) and 2018 (120.5 vs. 113.1).
- Beginning at age 35, men had higher remarriage rates than women at every age group at both time points.
- In 2018, the gender gap in the remarriage rate is largest among those aged 35 to 44, but this gap has narrowed over time for all age groups.
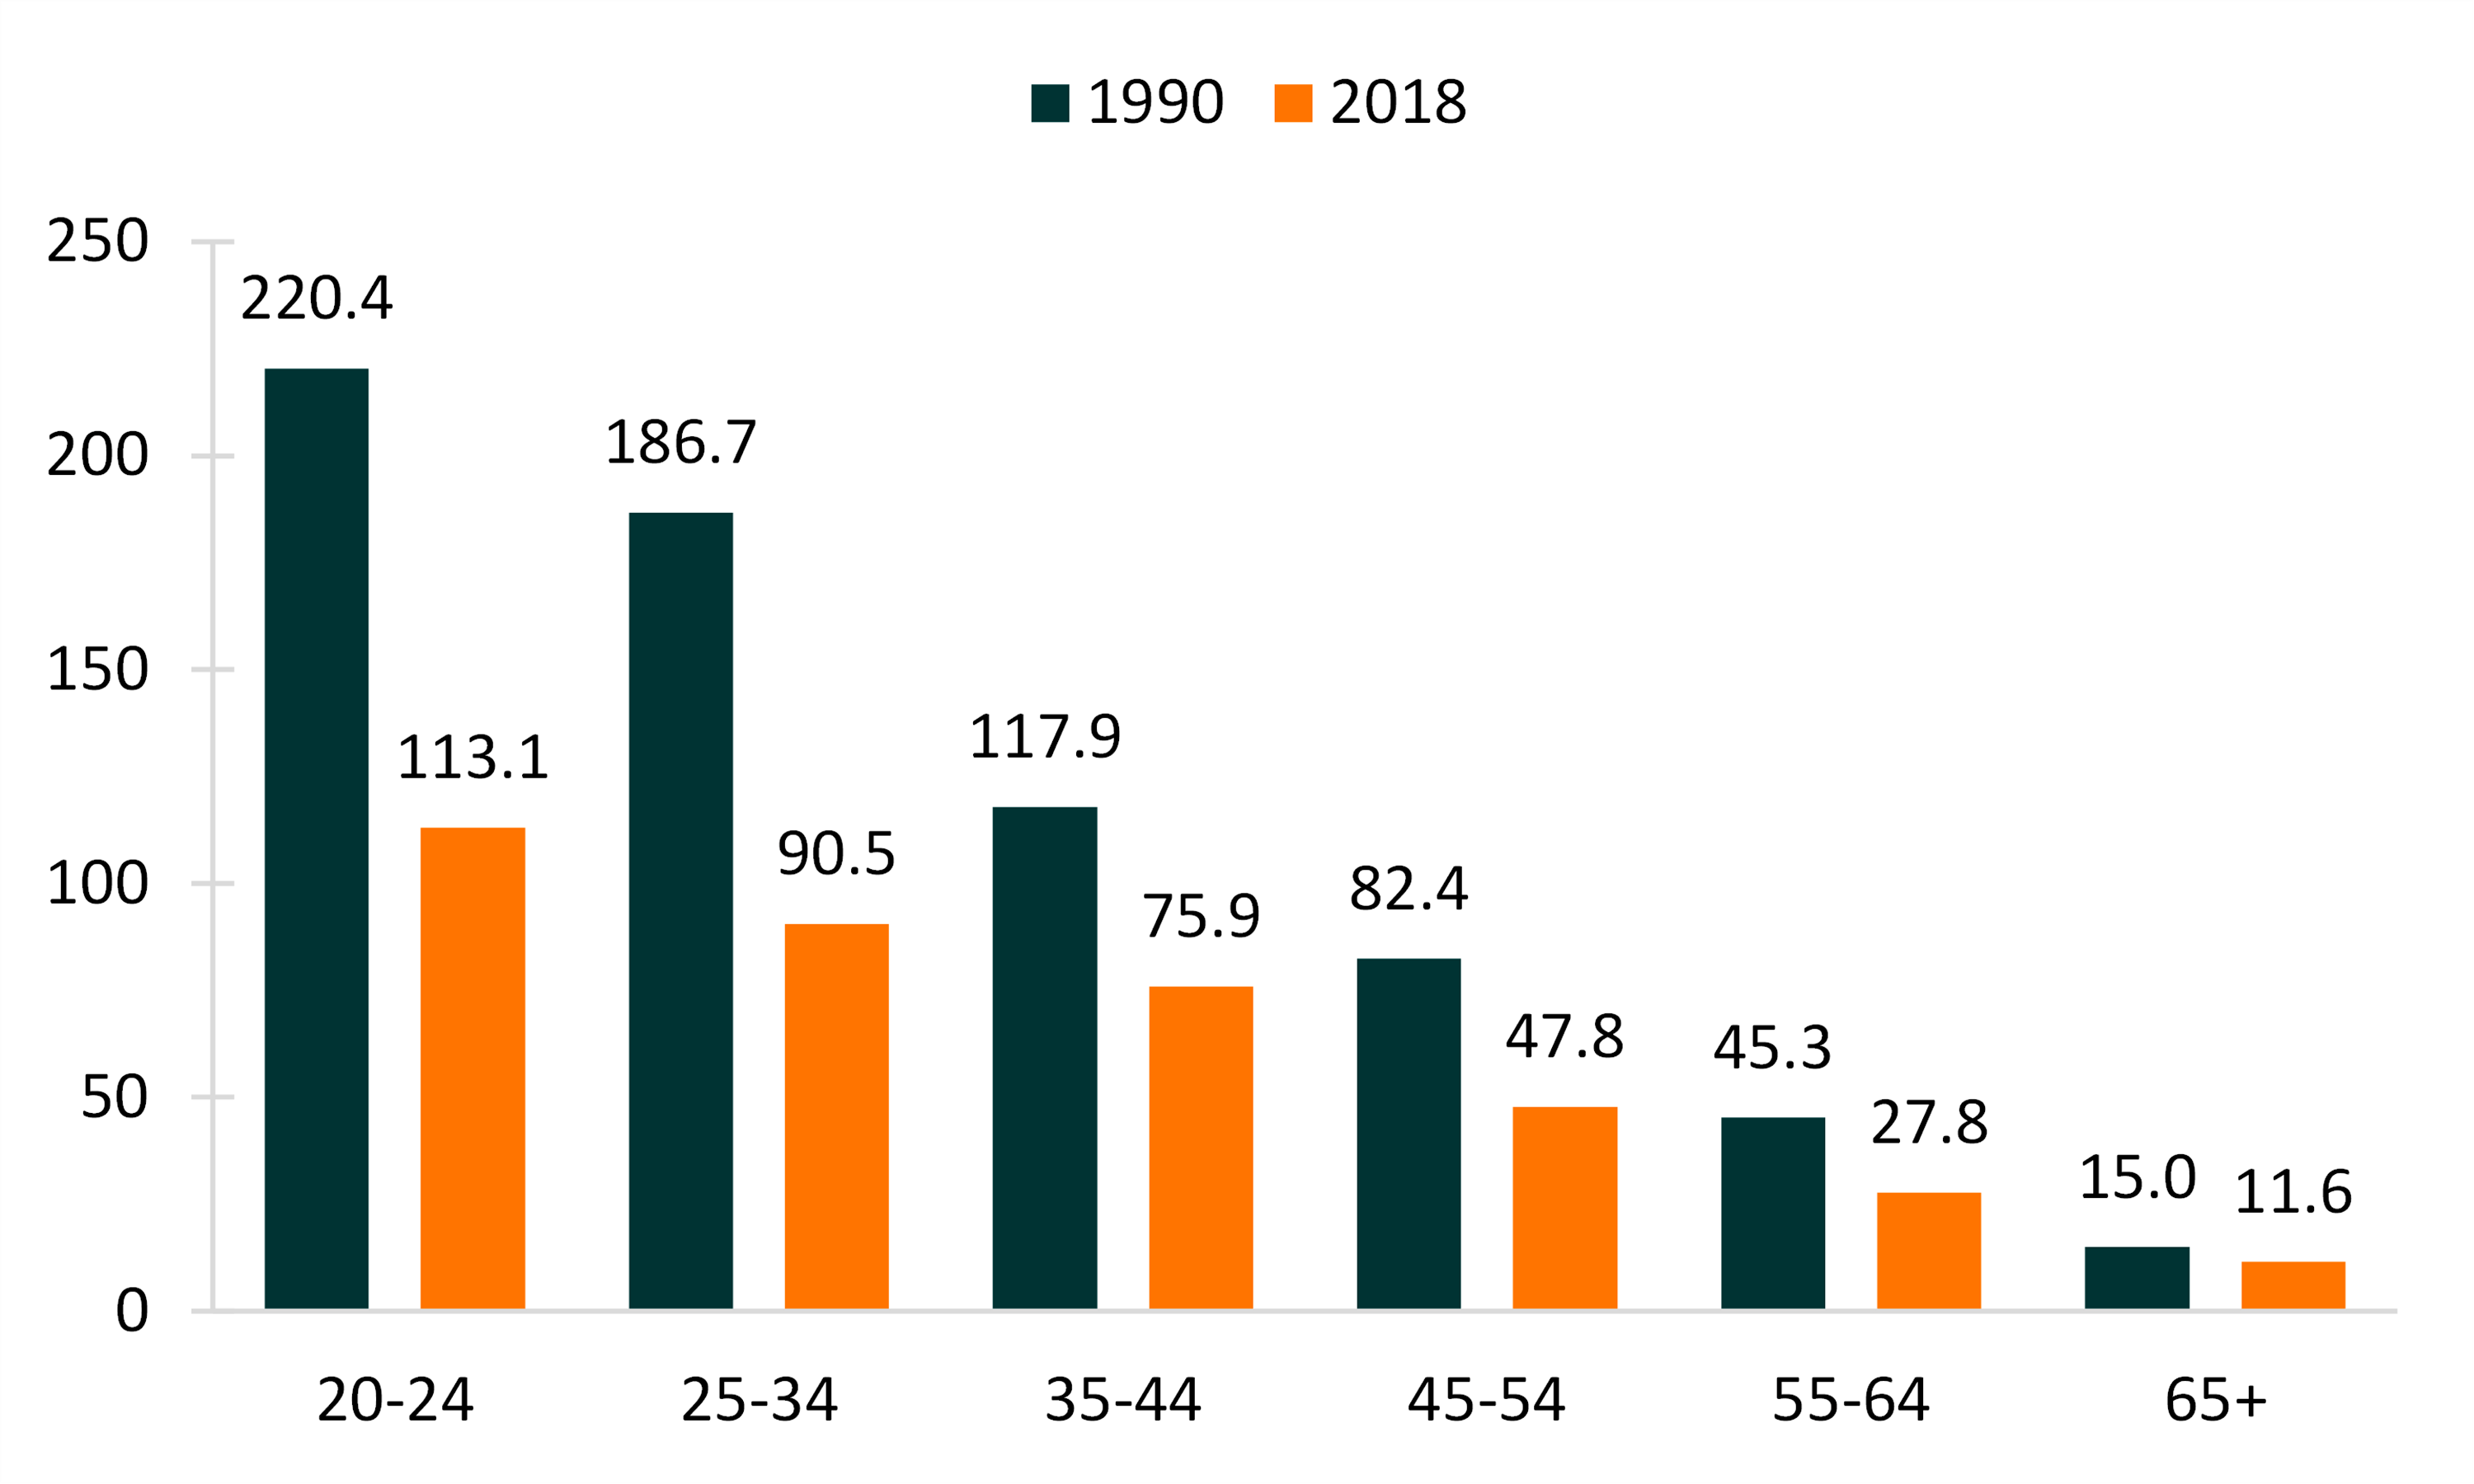
- For men aged 45 to 54, the remarriage rate fell 42% from 82.4 to 47.8, whereas for women it remained essentially unchanged at 35.1 in 2018.
- Men also experienced a decline in remarriage rates among those aged 55 to 64, from 45.3 in 1990 to 27.8 in 2018. However, women of the same age experienced a slight increase from 10.7 to 13.2.
Figure 2. Men’s Remarriage Rates by Age Groups, 1990 & 2018

Figure 3. Women’s Remarriage Rates by Age Groups, 1990 & 2018

References
- Brown, S. L. & Lin, I.-F. (2013). Age variation in the remarriage rate, 1990-2011. Family Profiles, FP-13-17. Bowling Green, OH: National Center for Family & Marriage Research. https://www.bgsu.edu/content/dam/BGSU/college-of-arts-and-sciences/NCFMR/documents/FP/FP-13-17.pdf
Suggested Citation
- Schweizer, V. (2020). Age variation in the remarriage rate, 1990 & 2018. Family Profiles, FP-20-13. Bowling Green, OH: National Center for Family & Marriage Research. https://doi.org/10.25035/ncfmr/fp-20-13
Updated: 11/12/2025 09:36AM

