Age Variation in Cohabitation, 2018
Family Profile No. 12, 2020
Authors: Leslie Reynolds and Susan L. Brown
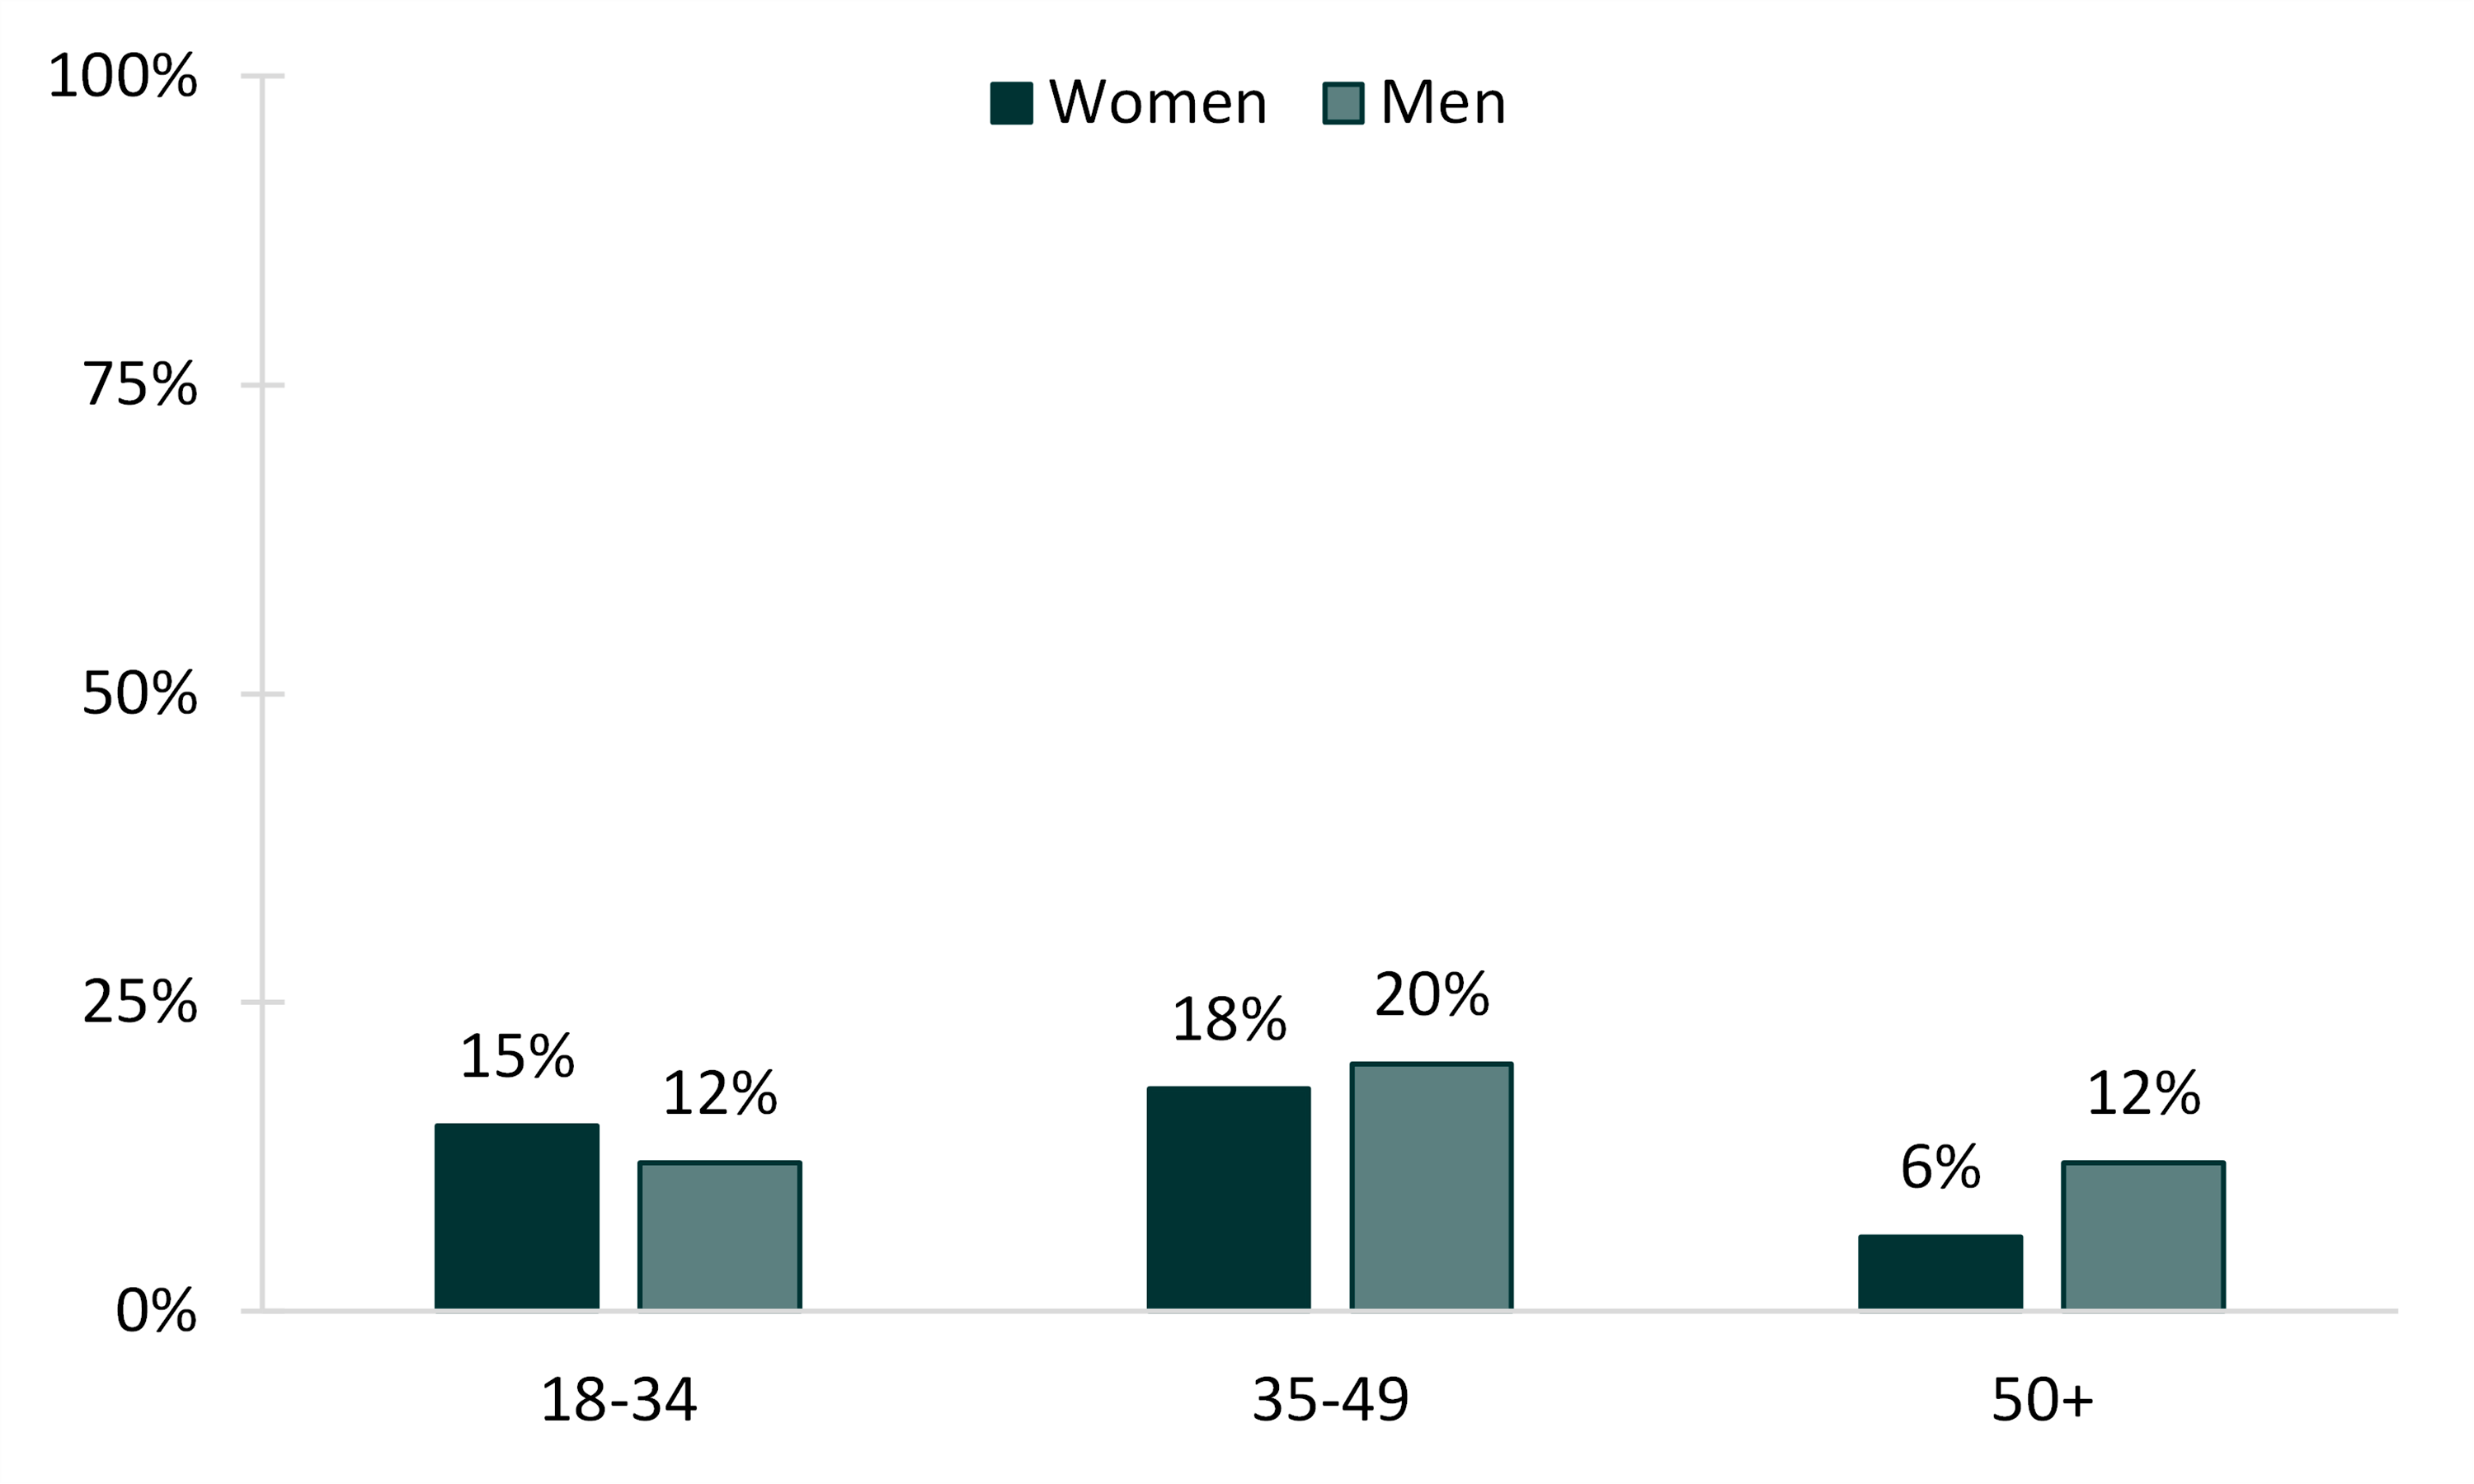
Cohabitation is on the rise in the United States. Between 1987 and 2013, the share of women aged 19-44 who ever cohabited nearly doubled from one-third to almost two-thirds (65%) (FP-17-02). Cohabitation levels vary by demographic characteristics such as gender (Nugent & Daugherty 2018), education, and race (FP-17-02). However, less is known about cohabitation during the second half of life. Using data from the 2018 American Community Survey (ACS), this Family Profile examines cohabitation across the life course by comparing levels of cohabitation among unmarried individuals in three age groups: 18-34, 35-49, and 50+. We document variation in cohabitation levels among unmarried adults across gender, education, and racial-ethnic groups. More than 14.5 million unmarried individuals over the age of 18 were in a cohabiting union in 2018 (result not shown).
Gender Variation in Cohabitation Across Age Groups
Figure 1. Share of Unmarried Individuals Cohabiting, by Gender and Age Group, 2018

The Educational Attainment of Cohabitors at Different Ages
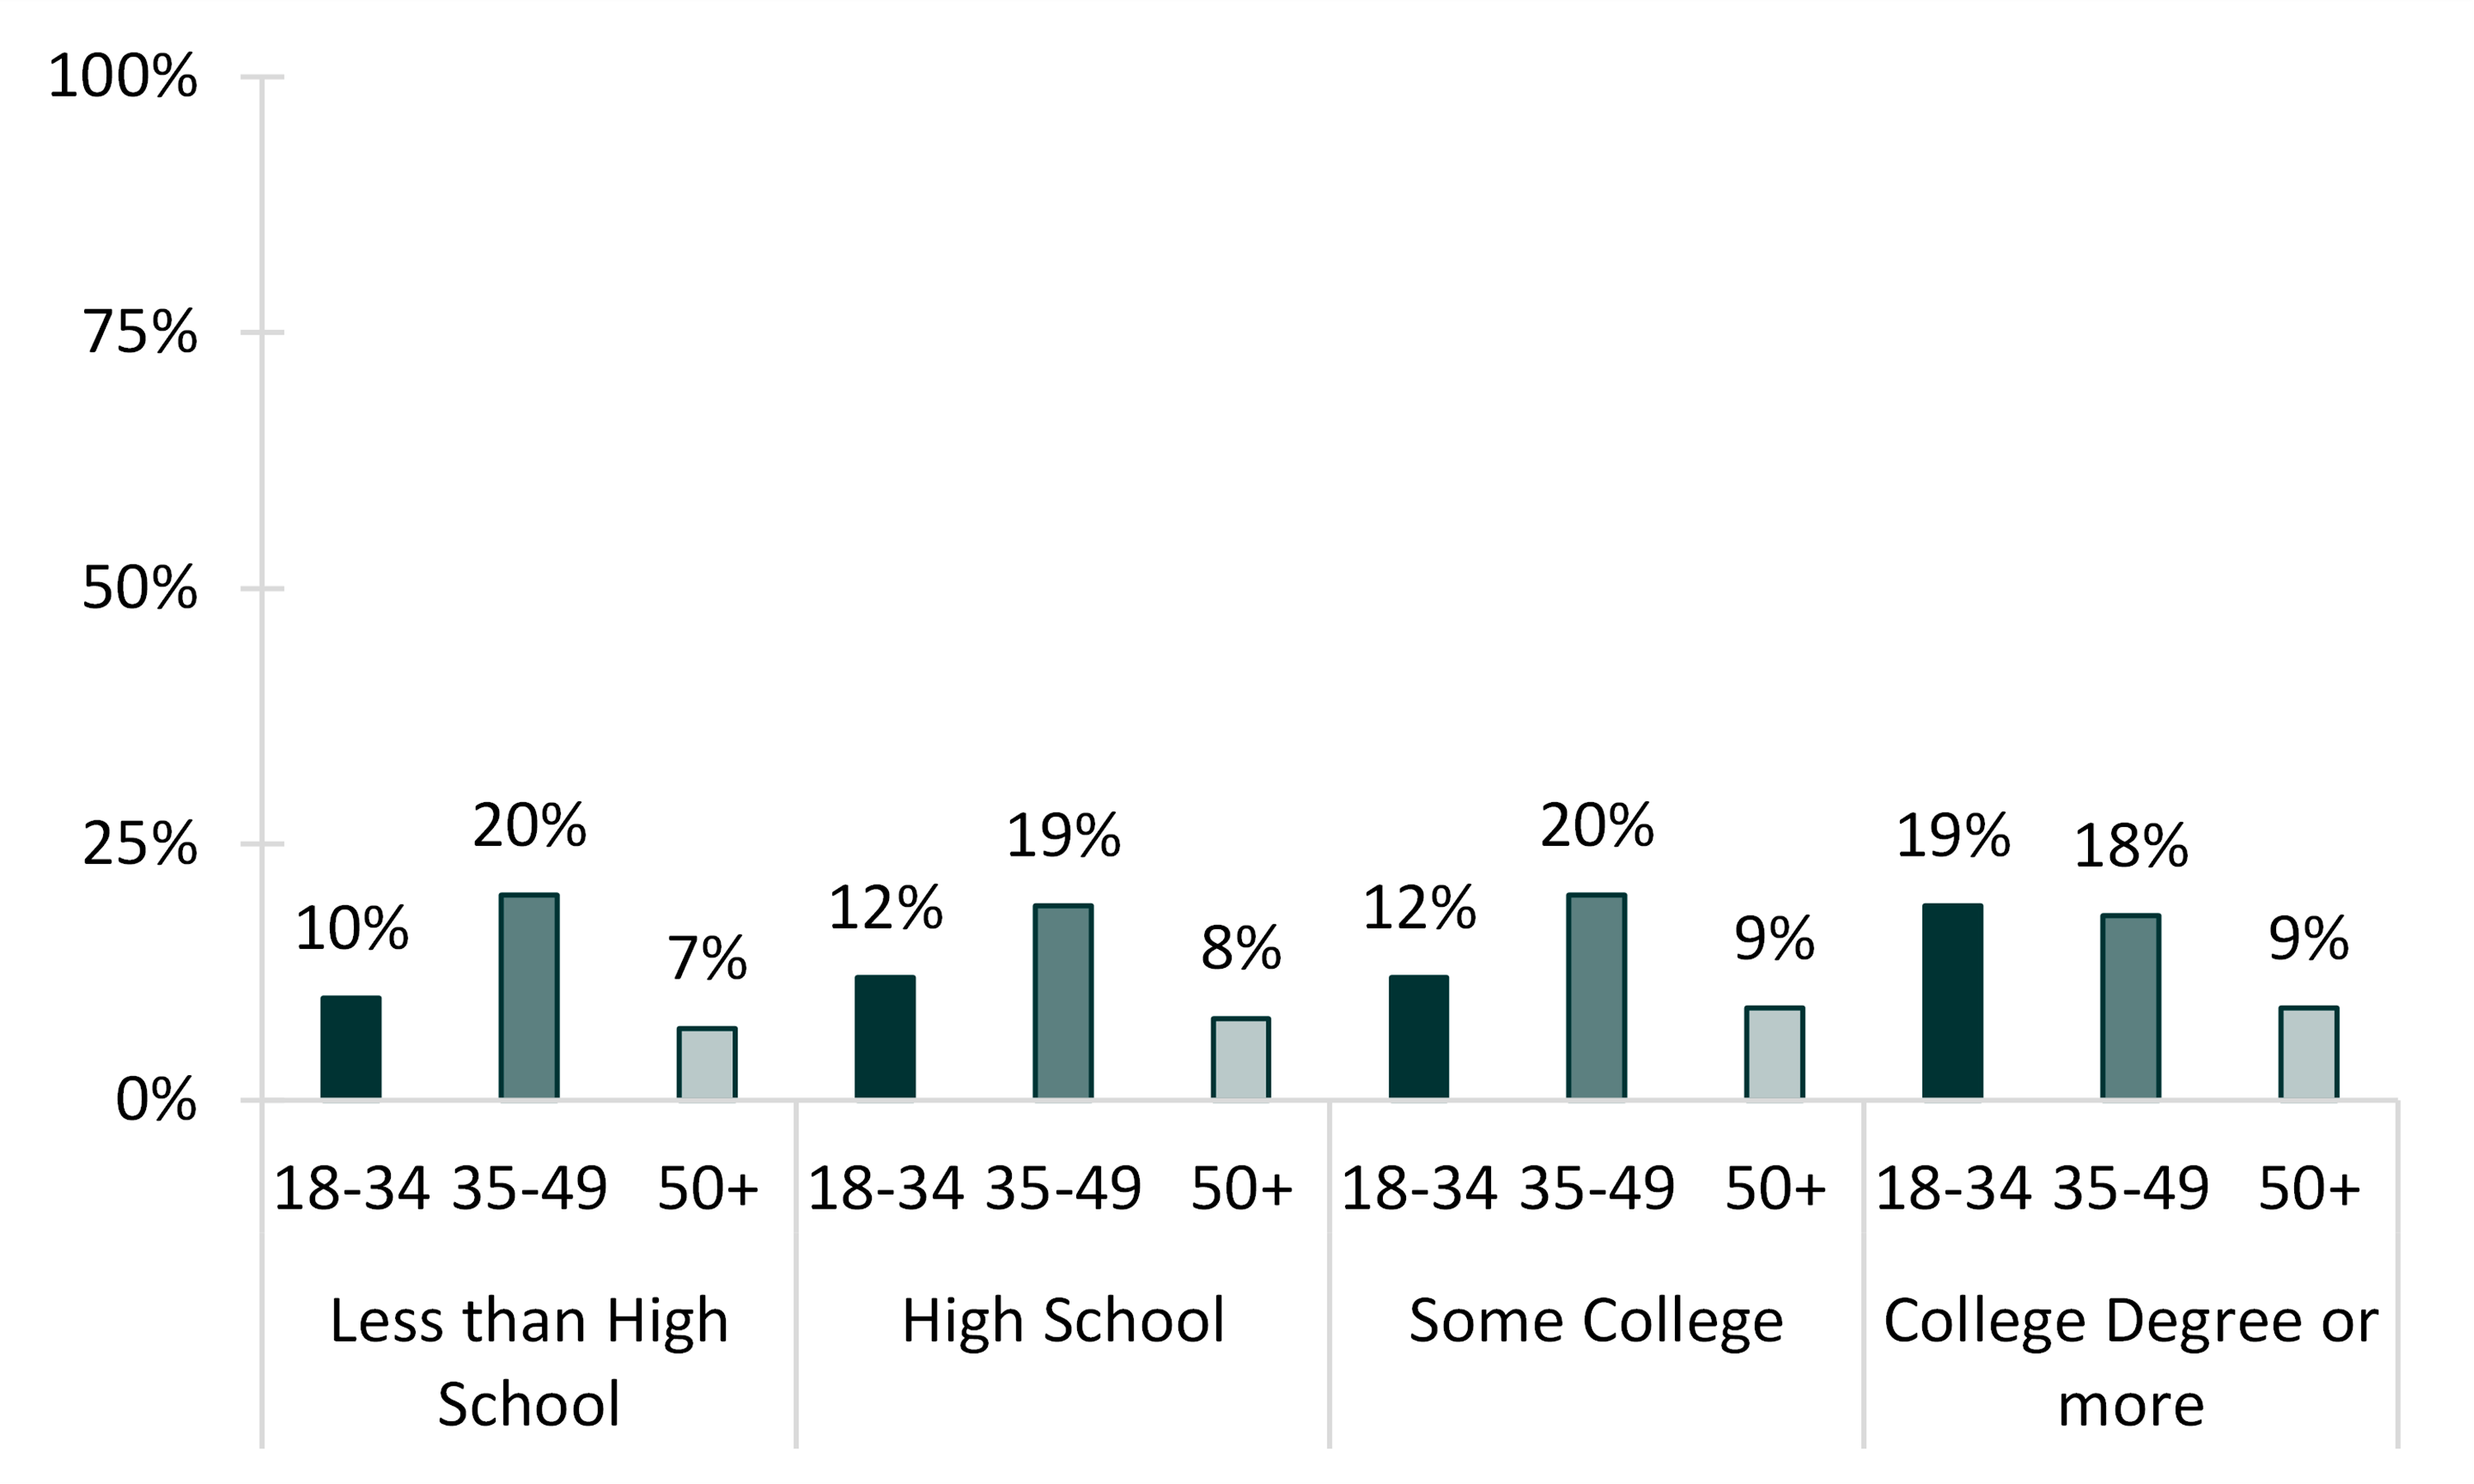
- Among individuals without a college degree, those aged 35-49 had the highest share cohabiting, hovering around 20%.
- Between 10-12% of unmarried young adults (aged 18-34) with less than a college degree were cohabiting versus 19% of those with a college degree.
- The share of older adults (50+) cohabiting was smaller than the share of young and middle-aged adults cohabiting, across all levels of education.
- Although 19% of young adults (18-34) and 18% of middle-aged adults with a college degree or more were in a cohabiting union, only 9% of similarly educated older adults were cohabiting.
Figure 2: Percentage of Unmarried Individuals Cohabiting, by Education and Age Group, 2018

Racial and Ethnic Differences in Cohabitation
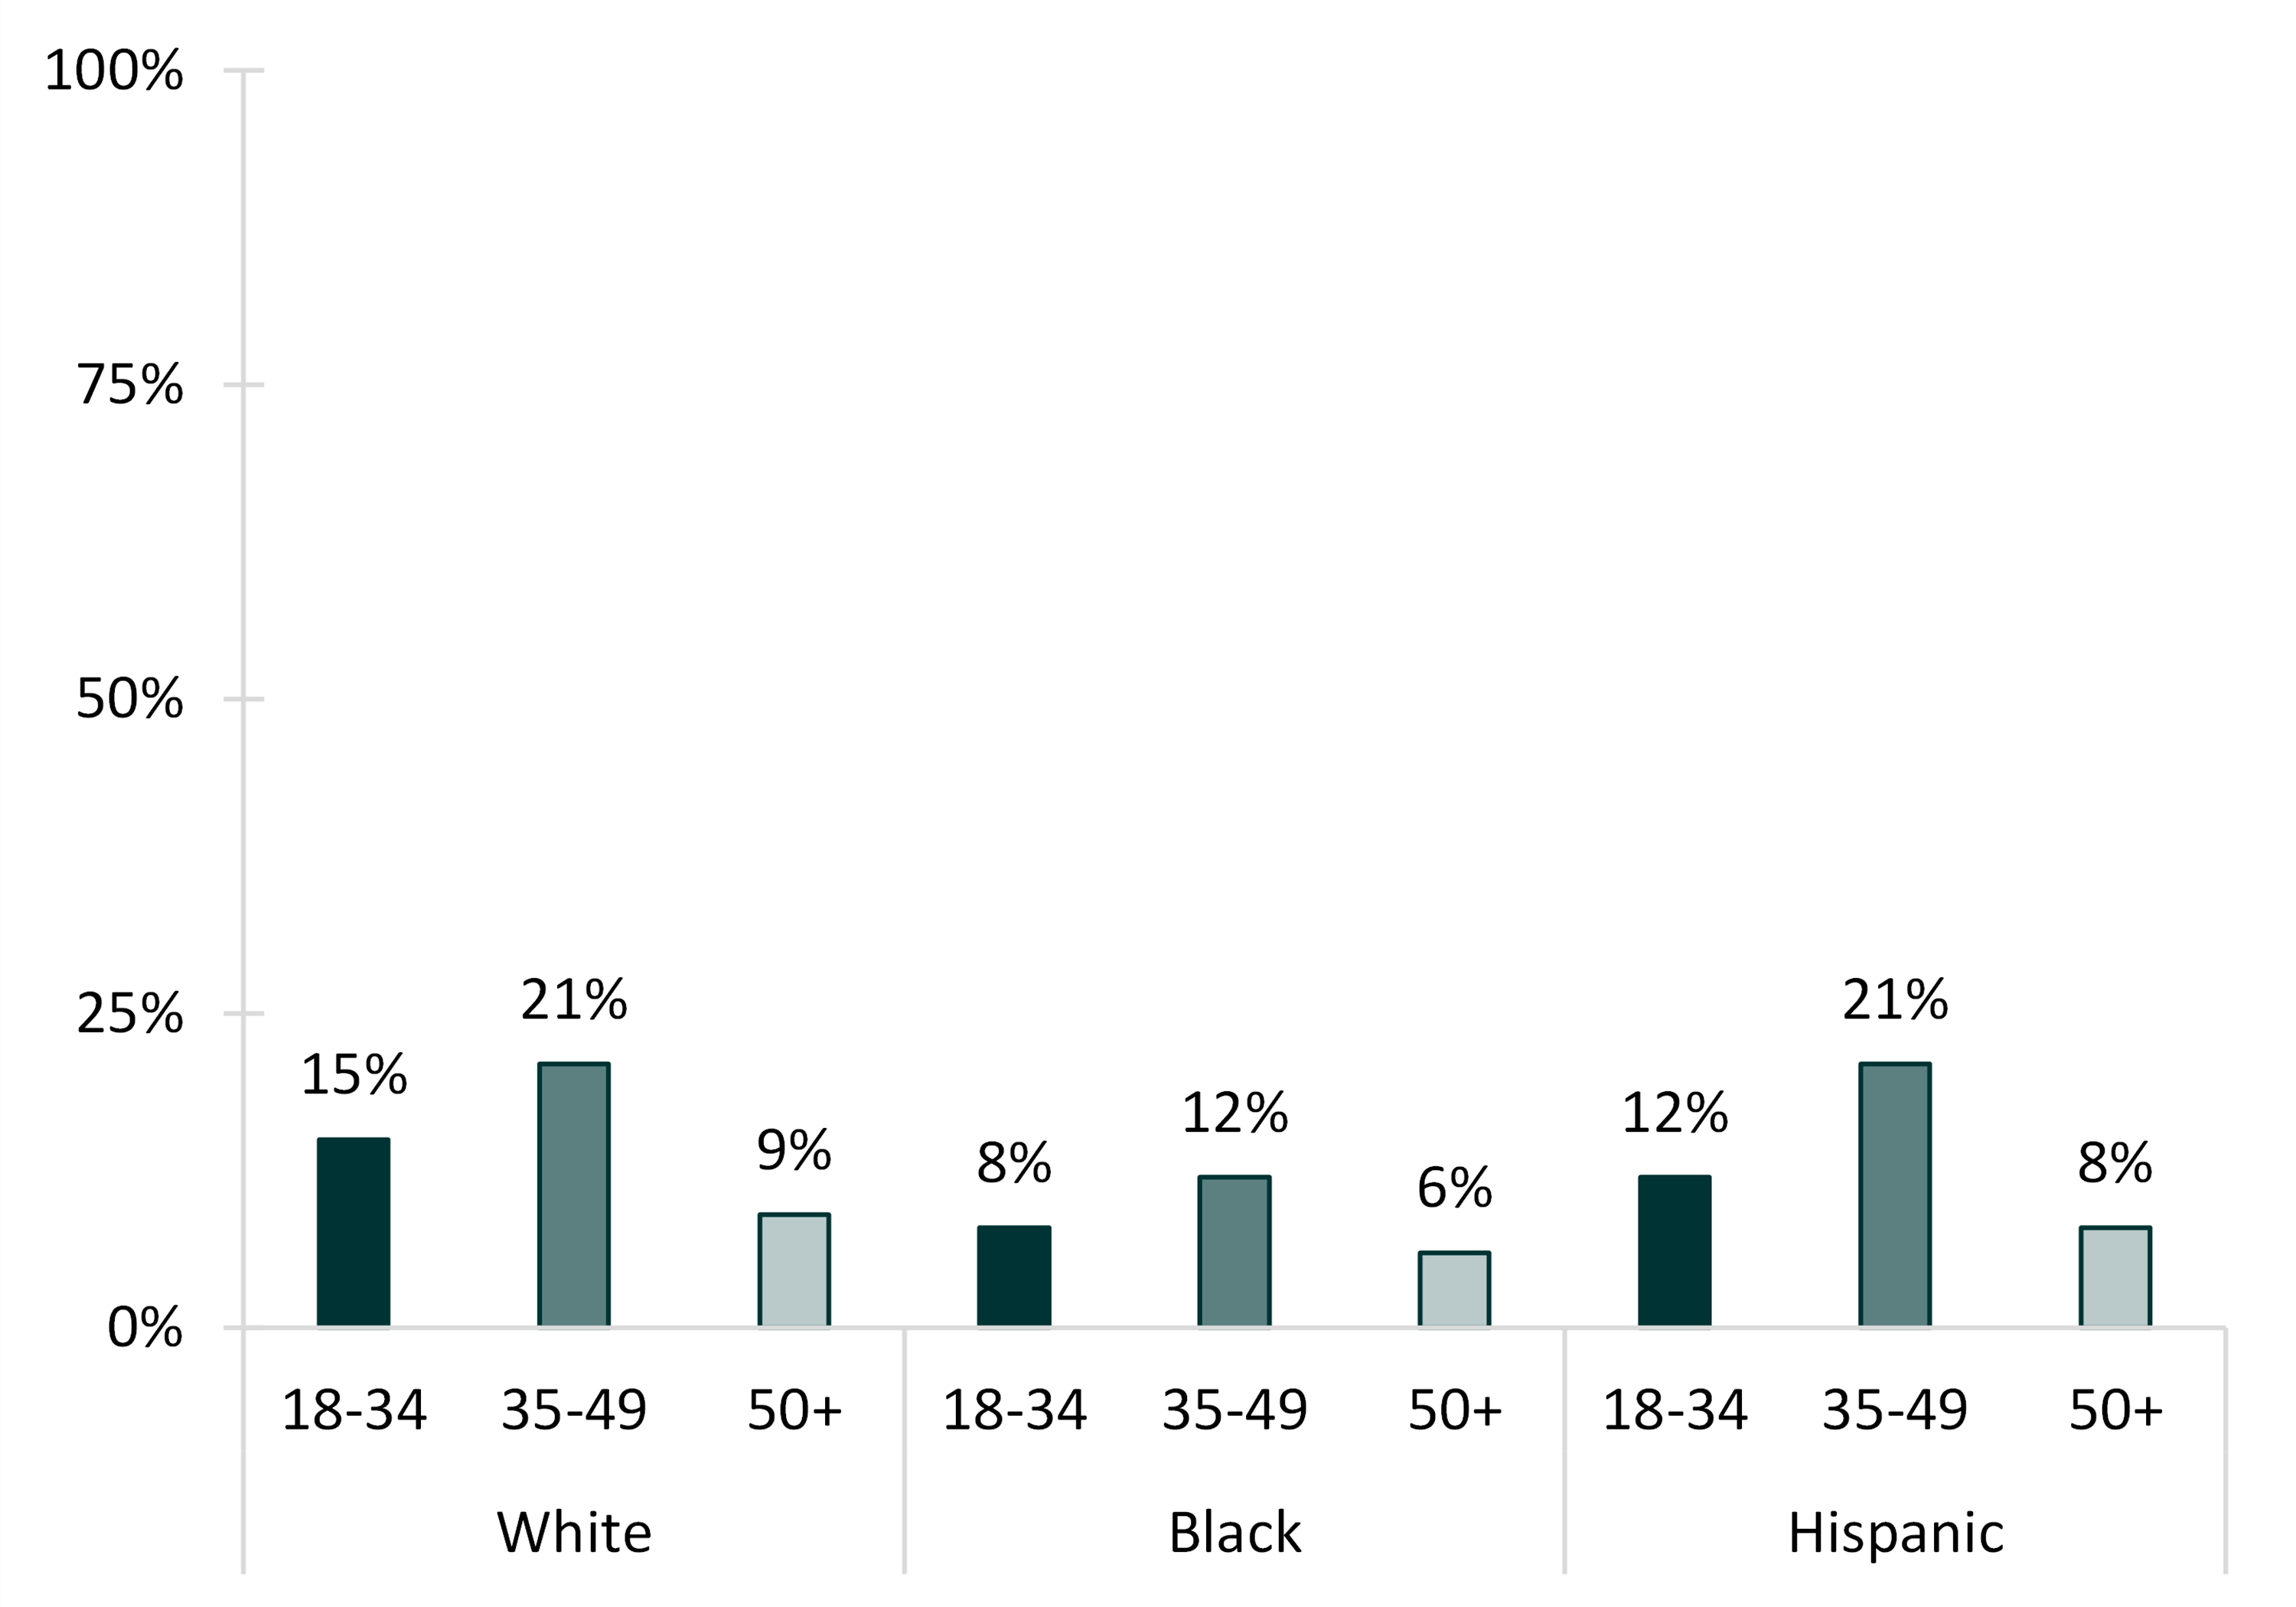
- The share of Black adults cohabiting was smaller than the share of Whites and Hispanics cohabiting across all age groups.
- The share of White young adults (aged 18-34) in a cohabiting union (15%) was almost twice as large as the share of unmarried, Black young adults in a cohabiting union (8%).
- Although 21% of White and Hispanic middle-aged adults (aged 35-49) were in a cohabiting union, only 12% of Black middle-aged adults were cohabiting.
- Just 6% of older Black adults (50+) were cohabiting, whereas 9% of White and 8% of Hispanic older adults were cohabiting.
Figure 3: Percentage of Unmarried Individuals Cohabiting, by Race and Age Group, 2018


“Cohabitation was most common among unmarried adults aged 35-49. Roughly one in five were cohabiting.”

References
- Hemez, P., & Manning, W. D. (2017). Over twenty-five years of change in cohabitation in the U.S., 1987-2013. Family Profiles, FP-17-02. Bowling Green, OH: National Center for Family & Marriage Research. https://www.bgsu.edu/ncfmr/resources/data/family-profiles/hemez-manning-25-years-change-cohabitation-fp-17-02.html
- Nugent C. N., Daugherty J. (2018). A demographic, attitudinal, and behavioral profile of cohabiting adults in the United States, 2011–2015. National Health Statistics Reports; no 111. Hyattsville, MD: National Center for Health Statistics.
Suggested Citation
- Reynolds, L. & Brown, S. L. (2020). Age variation in cohabitation, 2018. Family Profiles, FP-20-12. Bowling Green, OH: National Center for Family & Marriage Research. https://doi.org/10.25035/ncfmr/fp-20-12
Updated: 11/12/2025 09:30AM

