Unmarried Adulthood: More than a Century of Change, 1900-2020
Family Profile No. 04, 2023
Author: Francesca A. Marino
The U.S. marriage rate has dropped over the past few decades (Schweizer, 2020). Persistent, high levels of divorce have been accompanied by plummeting rates of remarriage (Reynolds, 2021). Meanwhile, the share of never married adults in the U.S. has been on the rise (Wang and Parker, 2014), and the prevalence of those who have ever been married has been declining (Ruggles, 2016). All these trends point to the importance of tracking trends in unmarried adulthood.[1] Using data from the 1900 to 1990 Decennial Censuses and the American Community Survey 1-year estimates from 2000 to 2020, this family profile showcases over a century of change in the share unmarried adults aged 18 and older in the U.S., and further examines unmarried adulthood across sociodemographic characteristics, namely age, race and ethnicity, and educational attainment.
[1] We use the term “unmarried adulthood” as opposed to “singlehood” because some unmarried adults are cohabiting and for them “singlehood” would be a misnomer. The Decennial Census only began including questions to identify cohabitors in 1990, and thus we are unable distinguish between those who are single (without a partner) and those who are unmarried cohabitors in the years prior to 1990.
Change in the Share of Unmarried Adults in the US, 1900-2020
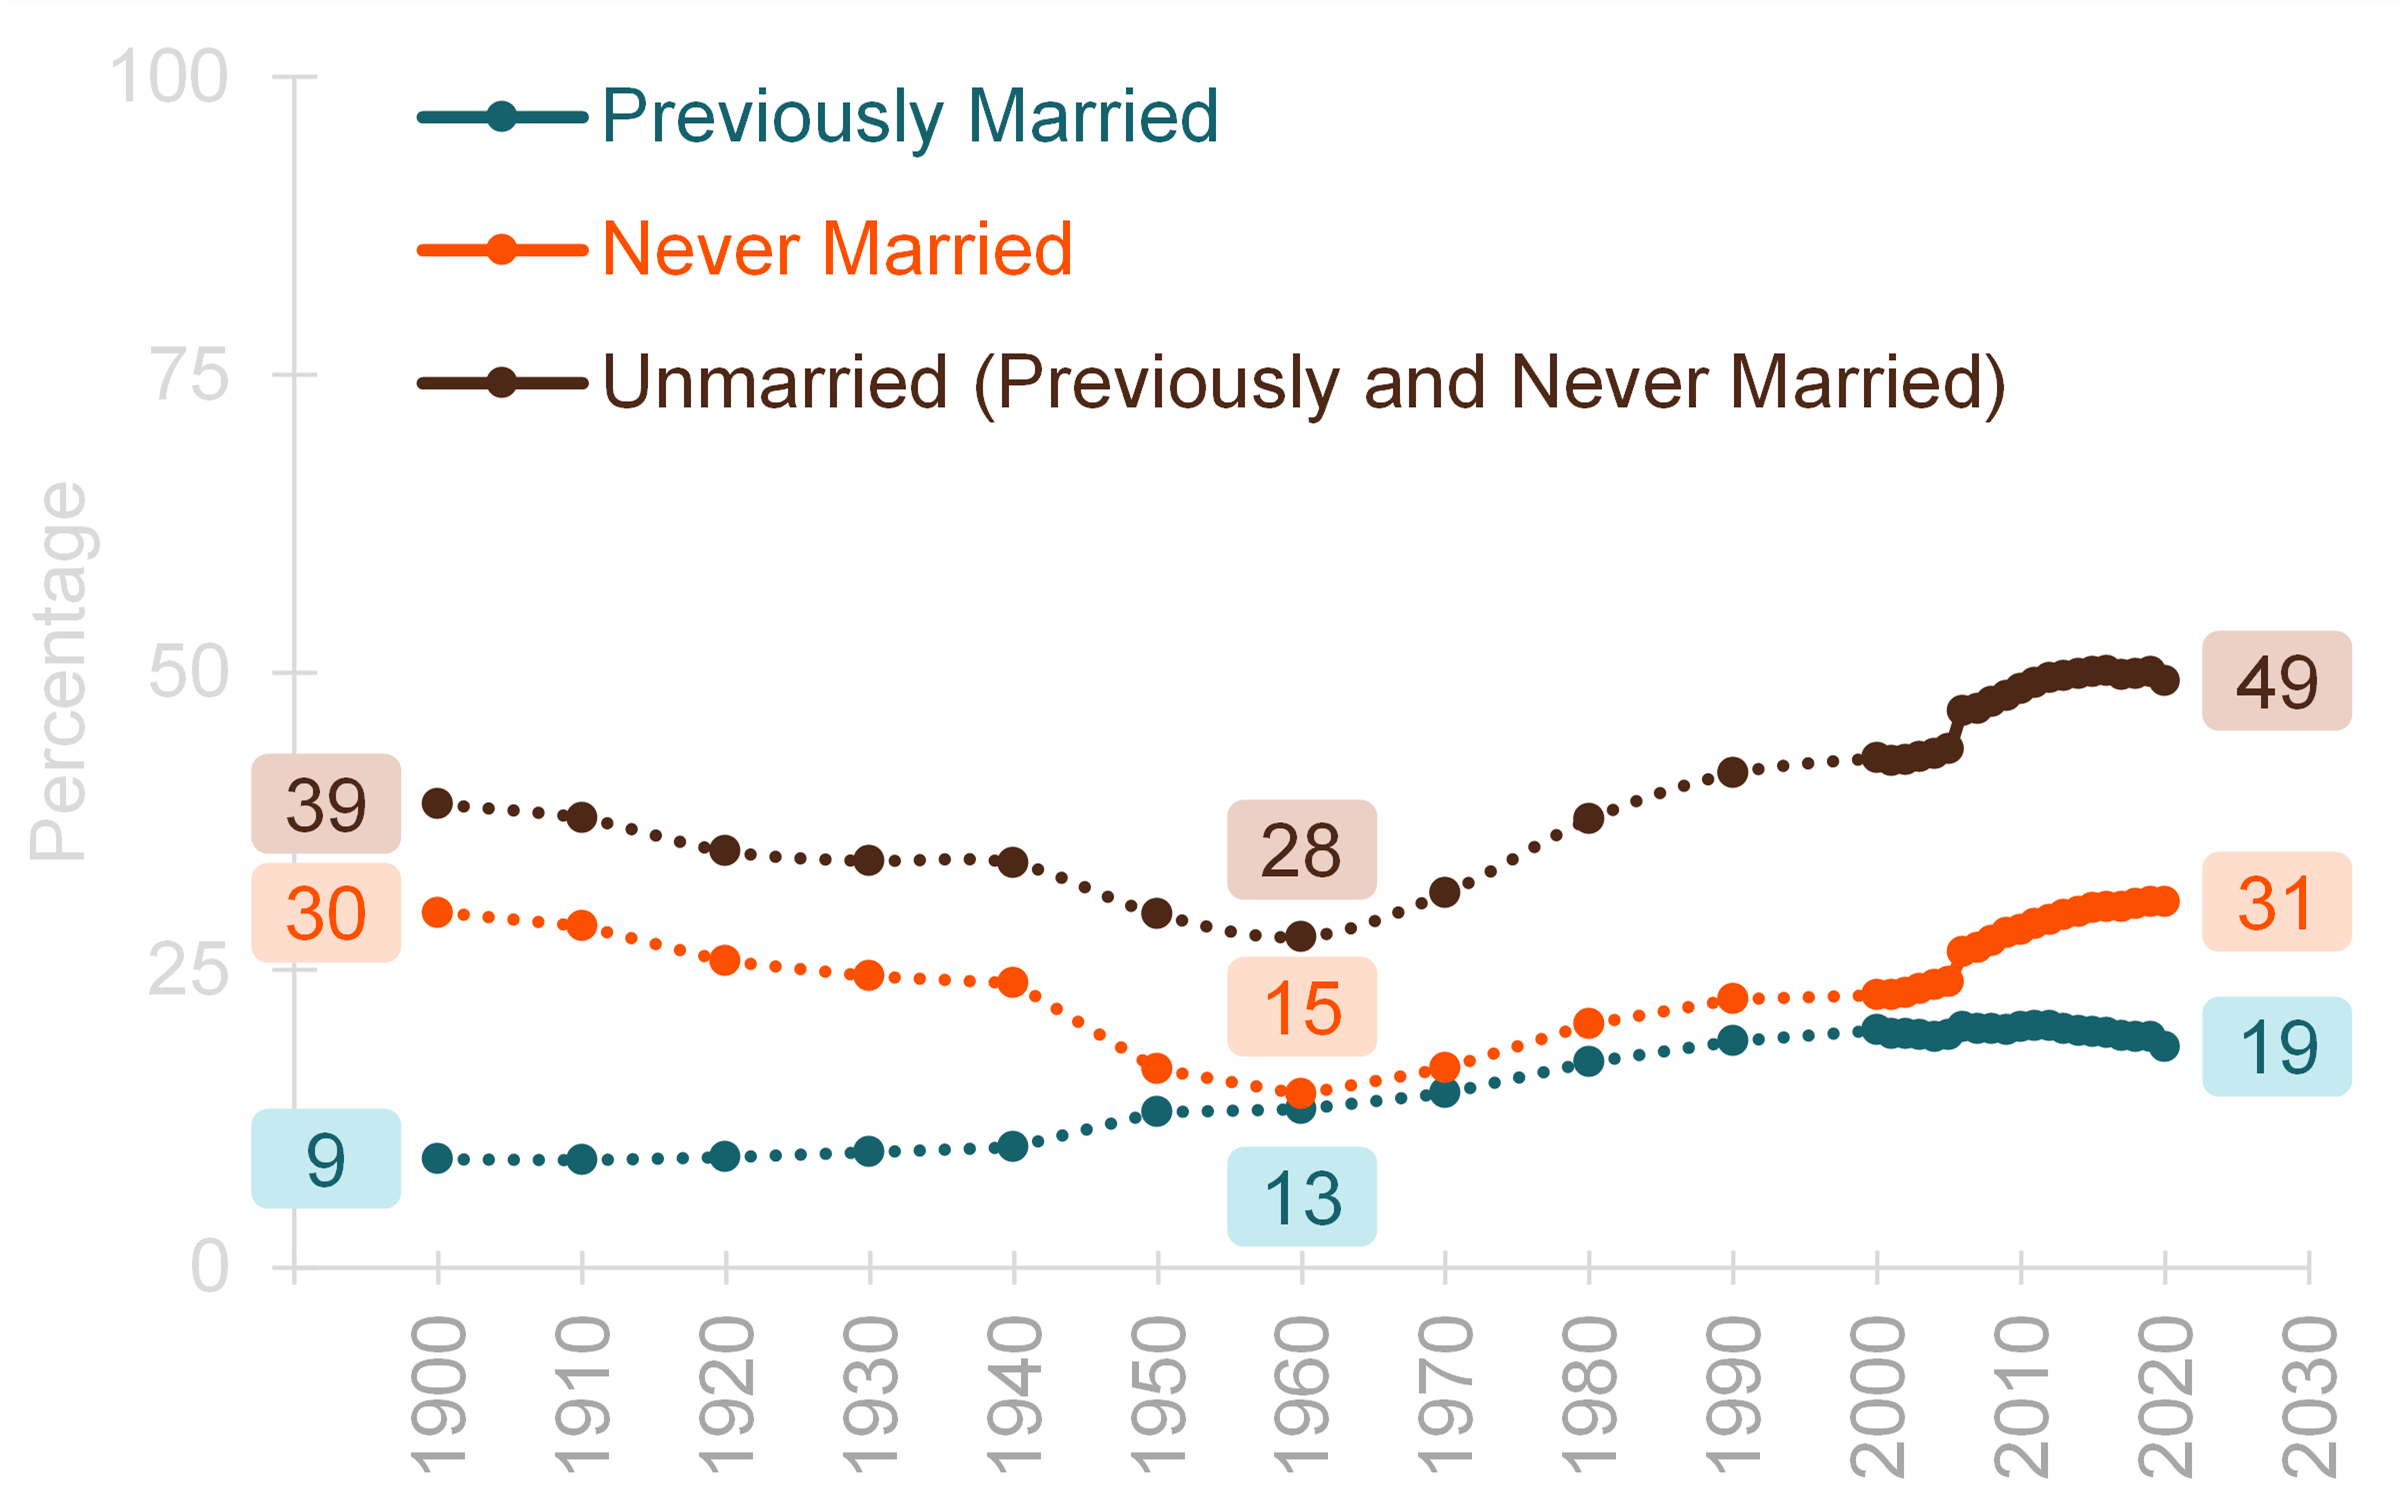
- Overall, the share of unmarried adults, both never married and previously married, decreased from 1900 to 1960, with 39% of the population unmarried in 1900 and 28% in 1960. There was an overall increase in the share of unmarried adults after 1960, with nearly half of adults (49%) reporting they were not married in 2020.
- Similarly, the percentage of those who had never married decreased from 1900 to 1960 but increased after 1960.
- The share of previously married adults has trended upward, doubling since 1900. However, the percentage of those who were previously married has remained stable from 2012 to 2020.
- The overall increase in the share of all unmarried adults has been driven mostly by the increasing share of those who were previously married.
Figure 1. Percentage of Unmarried Adults in the US, 1900-2020

Change in the Share of Unmarried Adults in the US by Age Category, 1900-2020
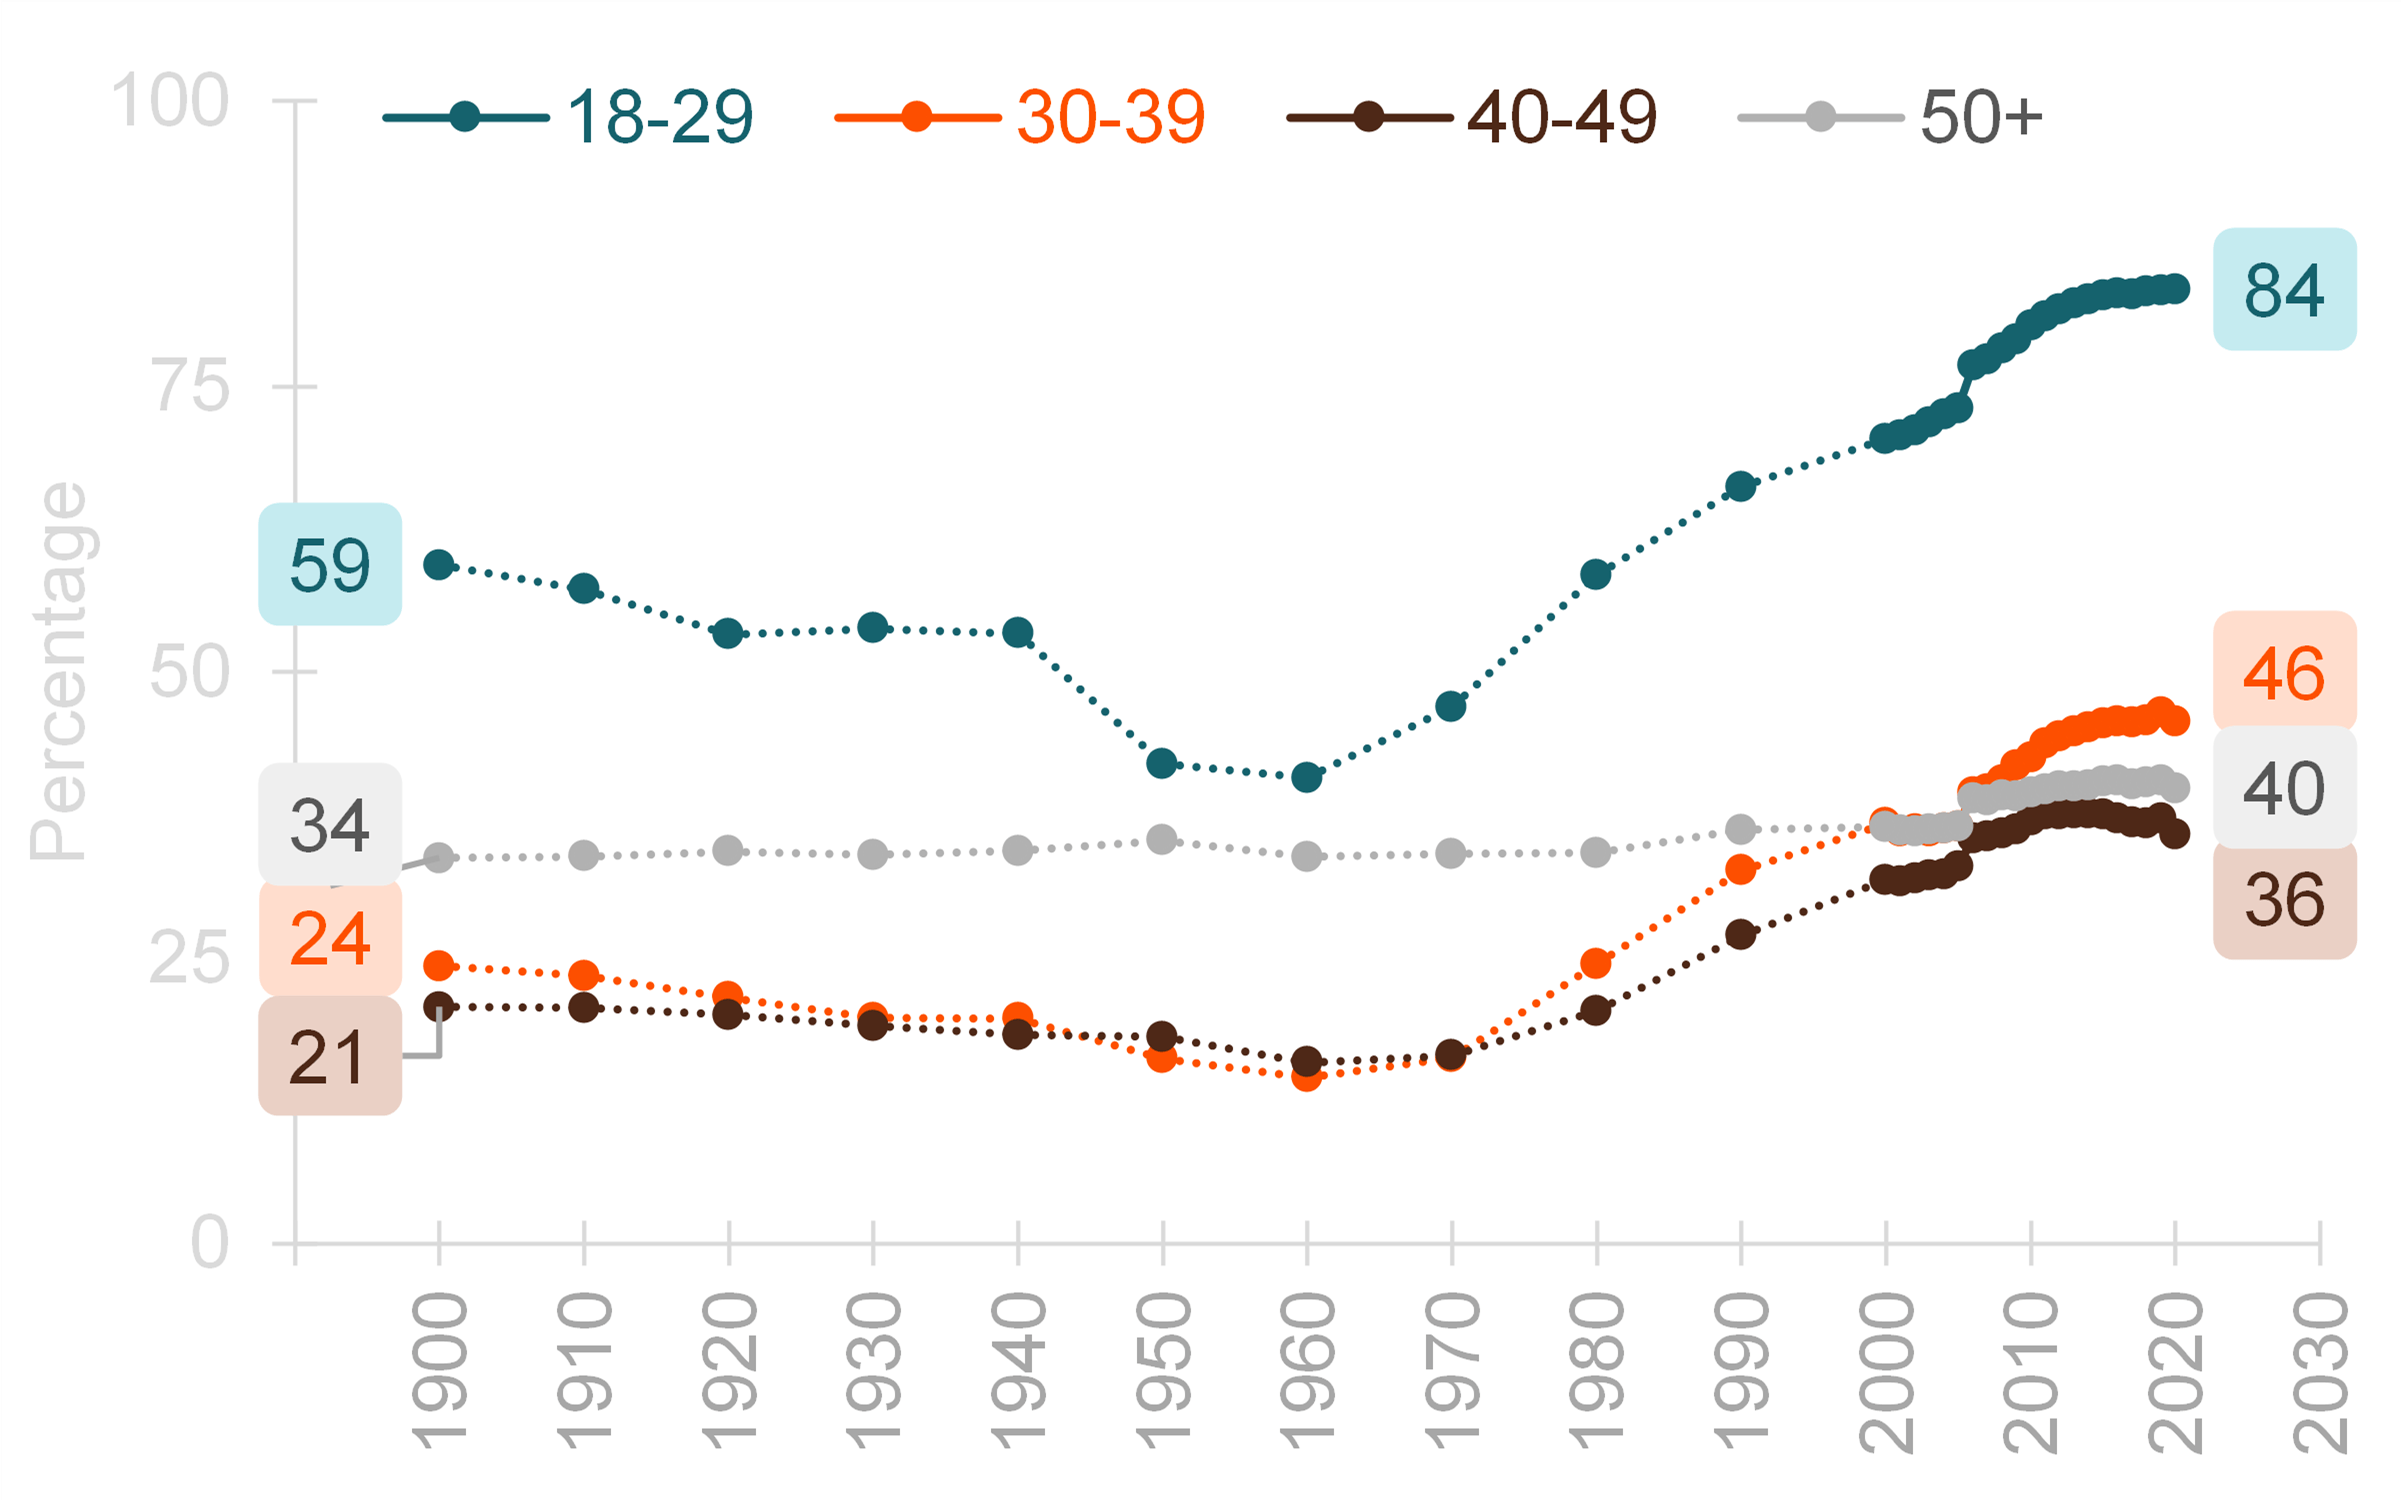
- The share of adults who were unmarried increased over time across all age groups.
- Young adults (those aged 18 to 29) exhibited a large decrease in the share unmarried followed by a sizeable increase over the 120 year time-period. Declining from 59% in 1900 to 41% in 1960, the share of unmarried adults has since doubled to 84% in 2020.
- Among adults aged 30 to 39, the share unmarried mirrored the trend of those aged 18 to 29, albeit with a more gradual decline from 1900 to 1960. Subsequently, the percentage unmarried tripled from 1960 (15%) to 2020 (46%).
- As with their younger counterparts, adults aged 40 to 49 experienced a small initial decline in the share unmarried from 1900 (21%) to 1960 (16%) but increased twofold by 2020 (36%).
- In contrast to the trends for adults under 50 years old, the pattern for adults aged 50+ has shown little variation since 1900, with a modest increase in the share unmarried from 34% to 40% in 2020.
Figure 2. Percentage of Unmarried Adults by Age Category, 1900-2020

Change in Unmarried Adulthood by Race & Ethnicity, 1900-2020
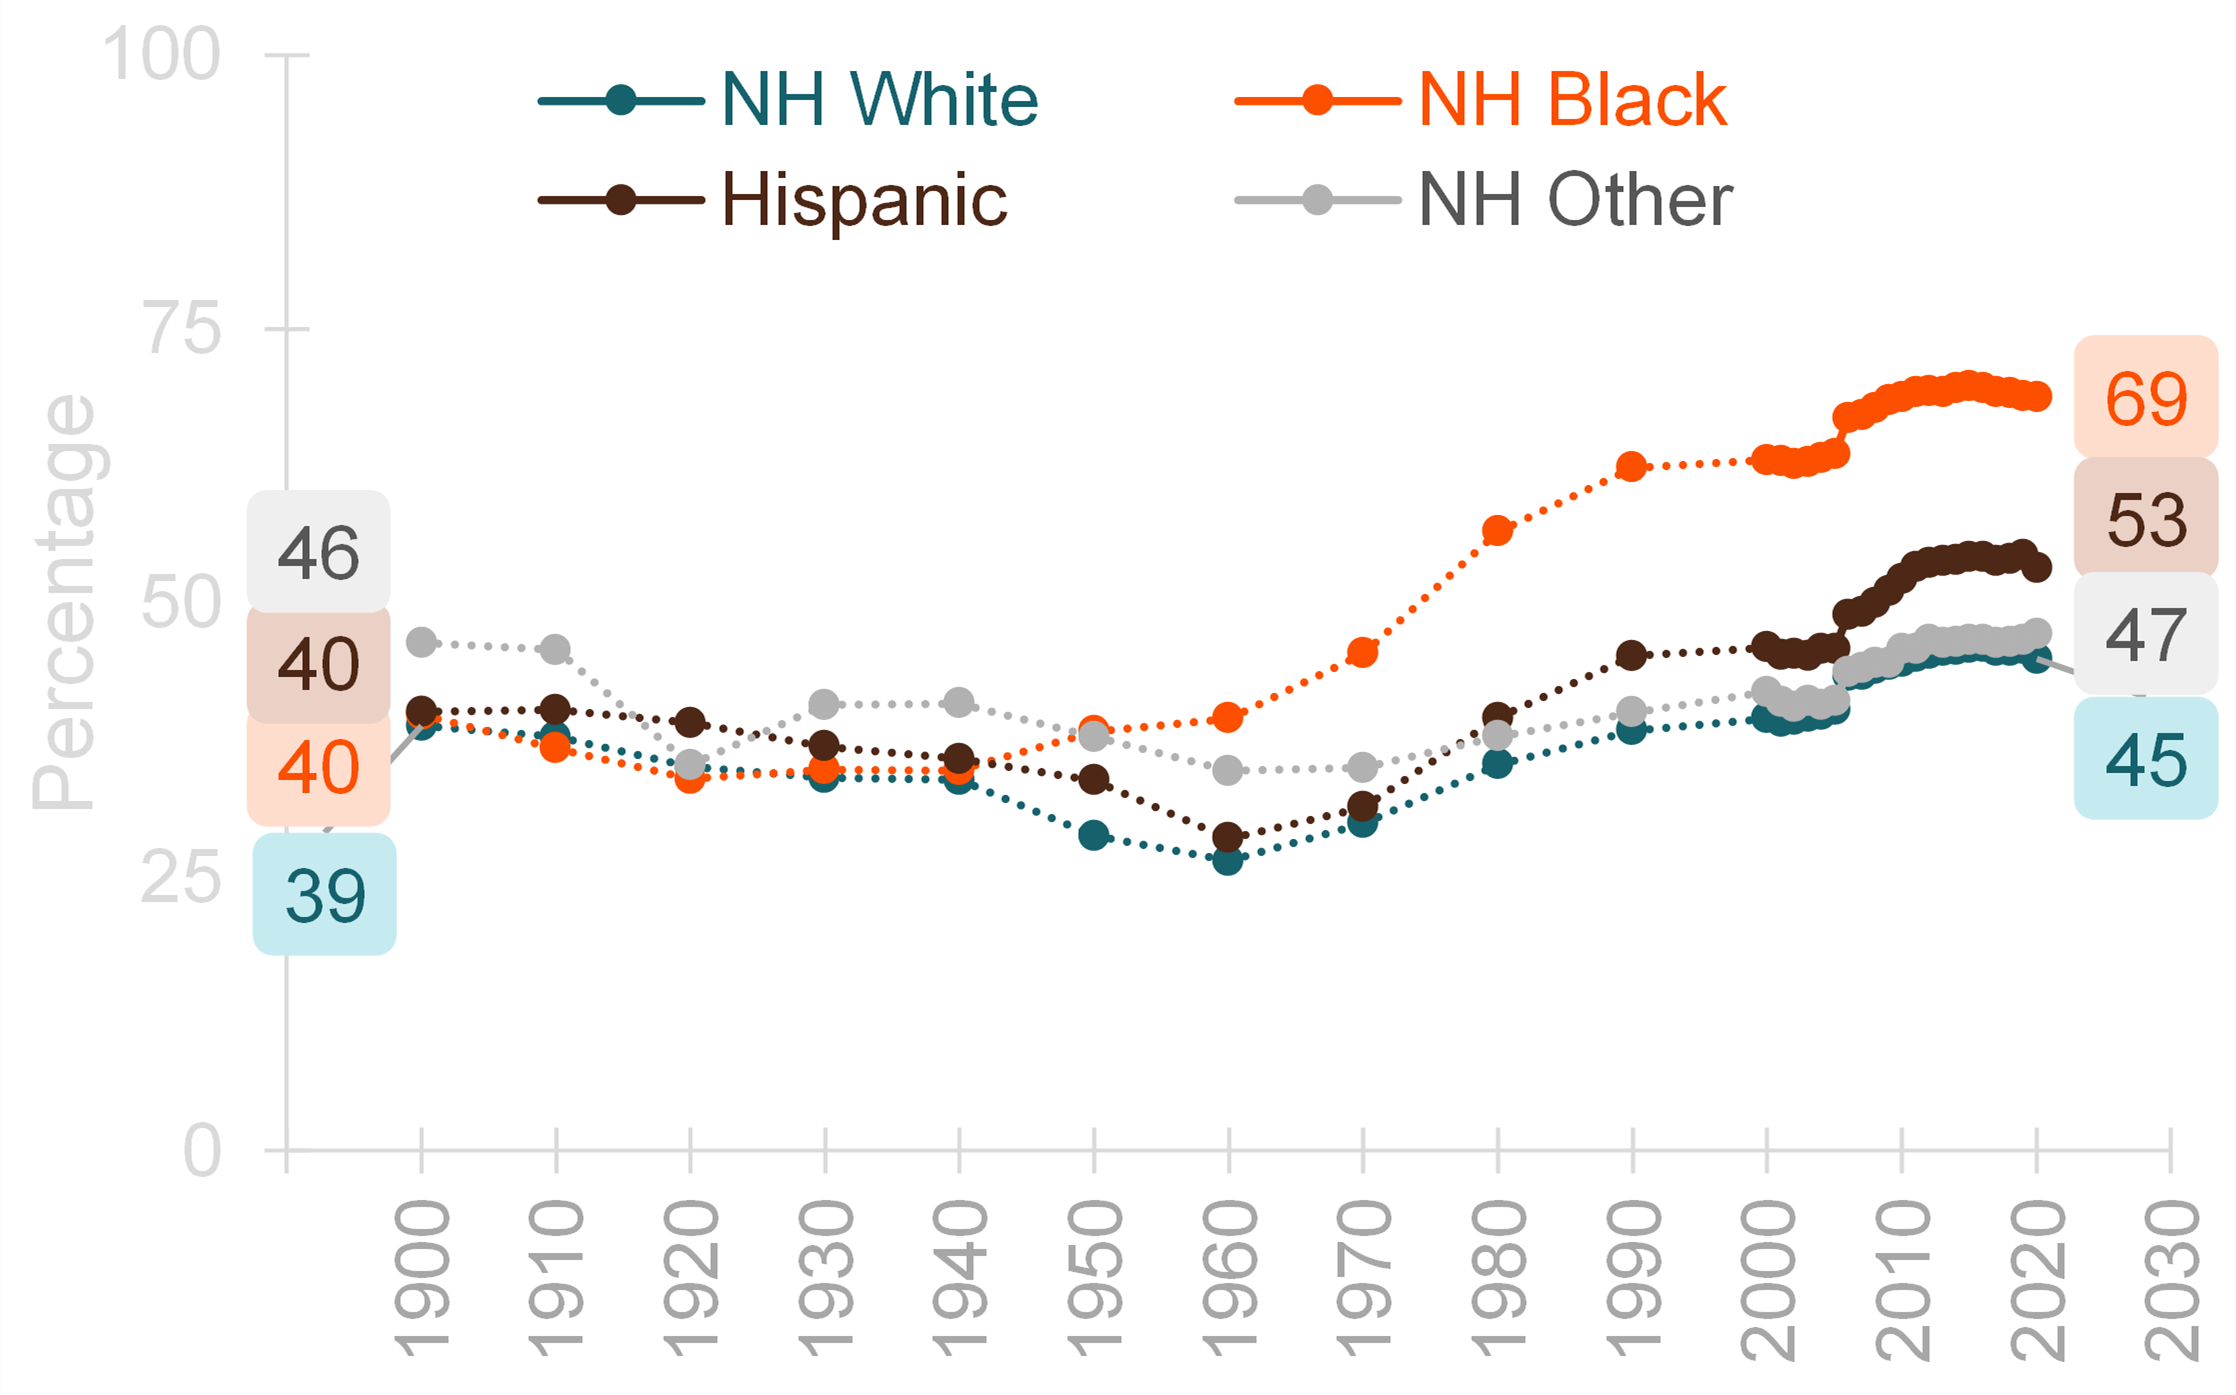
- Since 1900, the overall share of unmarried adults aged 18 and older in the US has increased across all racial and ethnic groups. Levels have risen fastest among Non-Hispanic Black adults for whom the percent unmarried climbed from 40% in 1900 to 69% in 2020.
- In 1900 near identical shares of non-Hispanic White (39%), non-Hispanic Black (40%), and Hispanic (40%) adults were unmarried.
- By 1960 divergence in trends was evident, with the share of unmarried Black adults remaining like that in 1900 at 39%, but the shares among all other racial and ethnic groups declining. Among Hispanic adults the share unmarried dropped to 28% and declined to 26% among White adults.
- In 2020 69% of non-Hispanic Black adults were unmarried and about half of adults in the remaining racial and ethnic groups were unmarried.
Figure 3. Percentage of Unmarried Adults in the US by Race & Ethnicity, 1900-2020

Change in Unmarried Adulthood by Educational Attainment
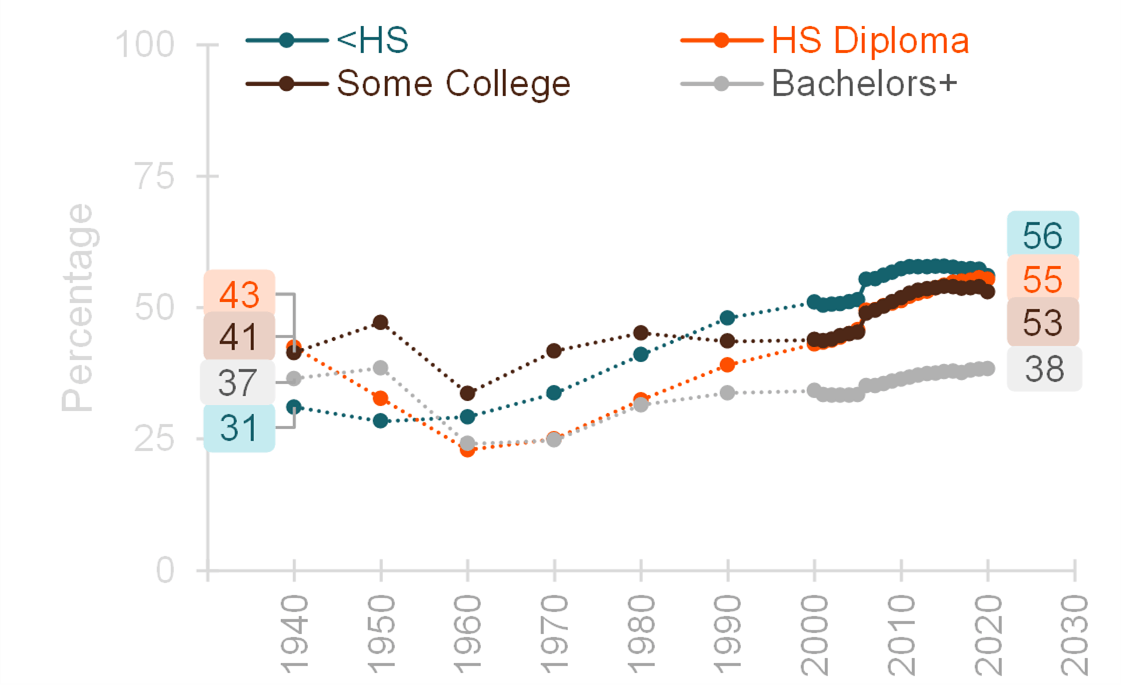
- From 1940 to 2020, the share of unmarried adults aged 18 and older has fluctuated by educational attainment.
- Among those with less than a high school diploma, the percentage unmarried has increased from just under one-third (31%) in 1940 to over half (56%) in 2020.
- Among adults with a high school diploma, the share unmarried decreased from 43% in 1940 to a low of 23% in 1960. Since 1960 the share unmarried for those with a high school degree steadily increased reaching 55% in 2020.
- The trends among those who went to college—regardless of whether they completed a bachelor’s degree—followed similar trajectories. Both increased slightly from 1940 to 1950, dropped to a low point in 1960, followed by general increases.
- By 2020 53% of those with some college were unmarried compared to only 38% among adults with at least a bachelor’s degree.
Figure 4. Percentage of Unmarried Adults in the US by Educational Attainment, 1940-2020

Data Source:
Ruggles, S., Flood, S., Goeken, R., Schouweiler, M. and Sobek, M. (2022). IPUMS USA: Version 12.0 [dataset]. Minneapolis, MN: IPUMS. https://doi.org/10.18128/D010.V12.0
References:
Reynolds, L. (2021). The U.S. remarriage rate, 2019: Trends and geographic variation by gender. Family Profiles, FP-21-18. Bowling Green, OH: National Center for Family & Marriage Research. https://doi.org/10.25035/ncfmr/fp-21-18
Ruggles, S. (2016). Marriage, family systems, and economic opportunity in the USA since 1850. Paper presented at the , 6 3-41. https://doi.org/10.1007/978-3-319-21635-5_10
Schweizer, V. J. (2020). Marriage: More than a century of change. Family Profiles, FP-20-21. Bowling Green, OH: National Center for Family & Marriage Research. https://doi.org/10.25035/ncfmr/fp-20-21
Wang, W., & Parker, K. (2014). Record share of Americans have never married. Pew Research Center's Social & Demographic Trends project. Retrieved November 21, 2022, from https://www.pewresearch.org/social-trends/2014/09/24/record-share-of-americans-have-never-married/
Suggested Citation:
Marino, F. A. (2023). Unmarried adulthood: More than a century of change, 1900-2020. Family Profiles, FP-23-04. National Center for Family & Marriage Research. https://doi.org/10.25035/ncfmr/fp-23-04
Updated: 11/10/2025 04:33PM

