Marriage Rate in the U.S.: Geographic Variation, 2022
Family Profile No. 23, 2023
Author: Jaden Loo
This Family Profile, an update of previous profiles on the US marriage rate (Hemez, 2016; Schweizer, 2018; Allred, 2019; Reynolds, 2020; Westrick-Payne, 2022; Juteau, 2022), presents estimates of adjusted marriage rates for the U.S. and each state for 2022. Using American Community Survey (ACS) data, we estimate the number of marriages occurring in the last year among unmarried women, calculate the margins of error, and describe geographic variation. For detailed information on the adjusted marriage rate from 2008-2022, see “Charting Marriage & Divorce in the U.S.: The Adjusted Marriage Rate” (Westrick-Payne, 2023).
U.S. Adjusted Marriage Rate, 2022
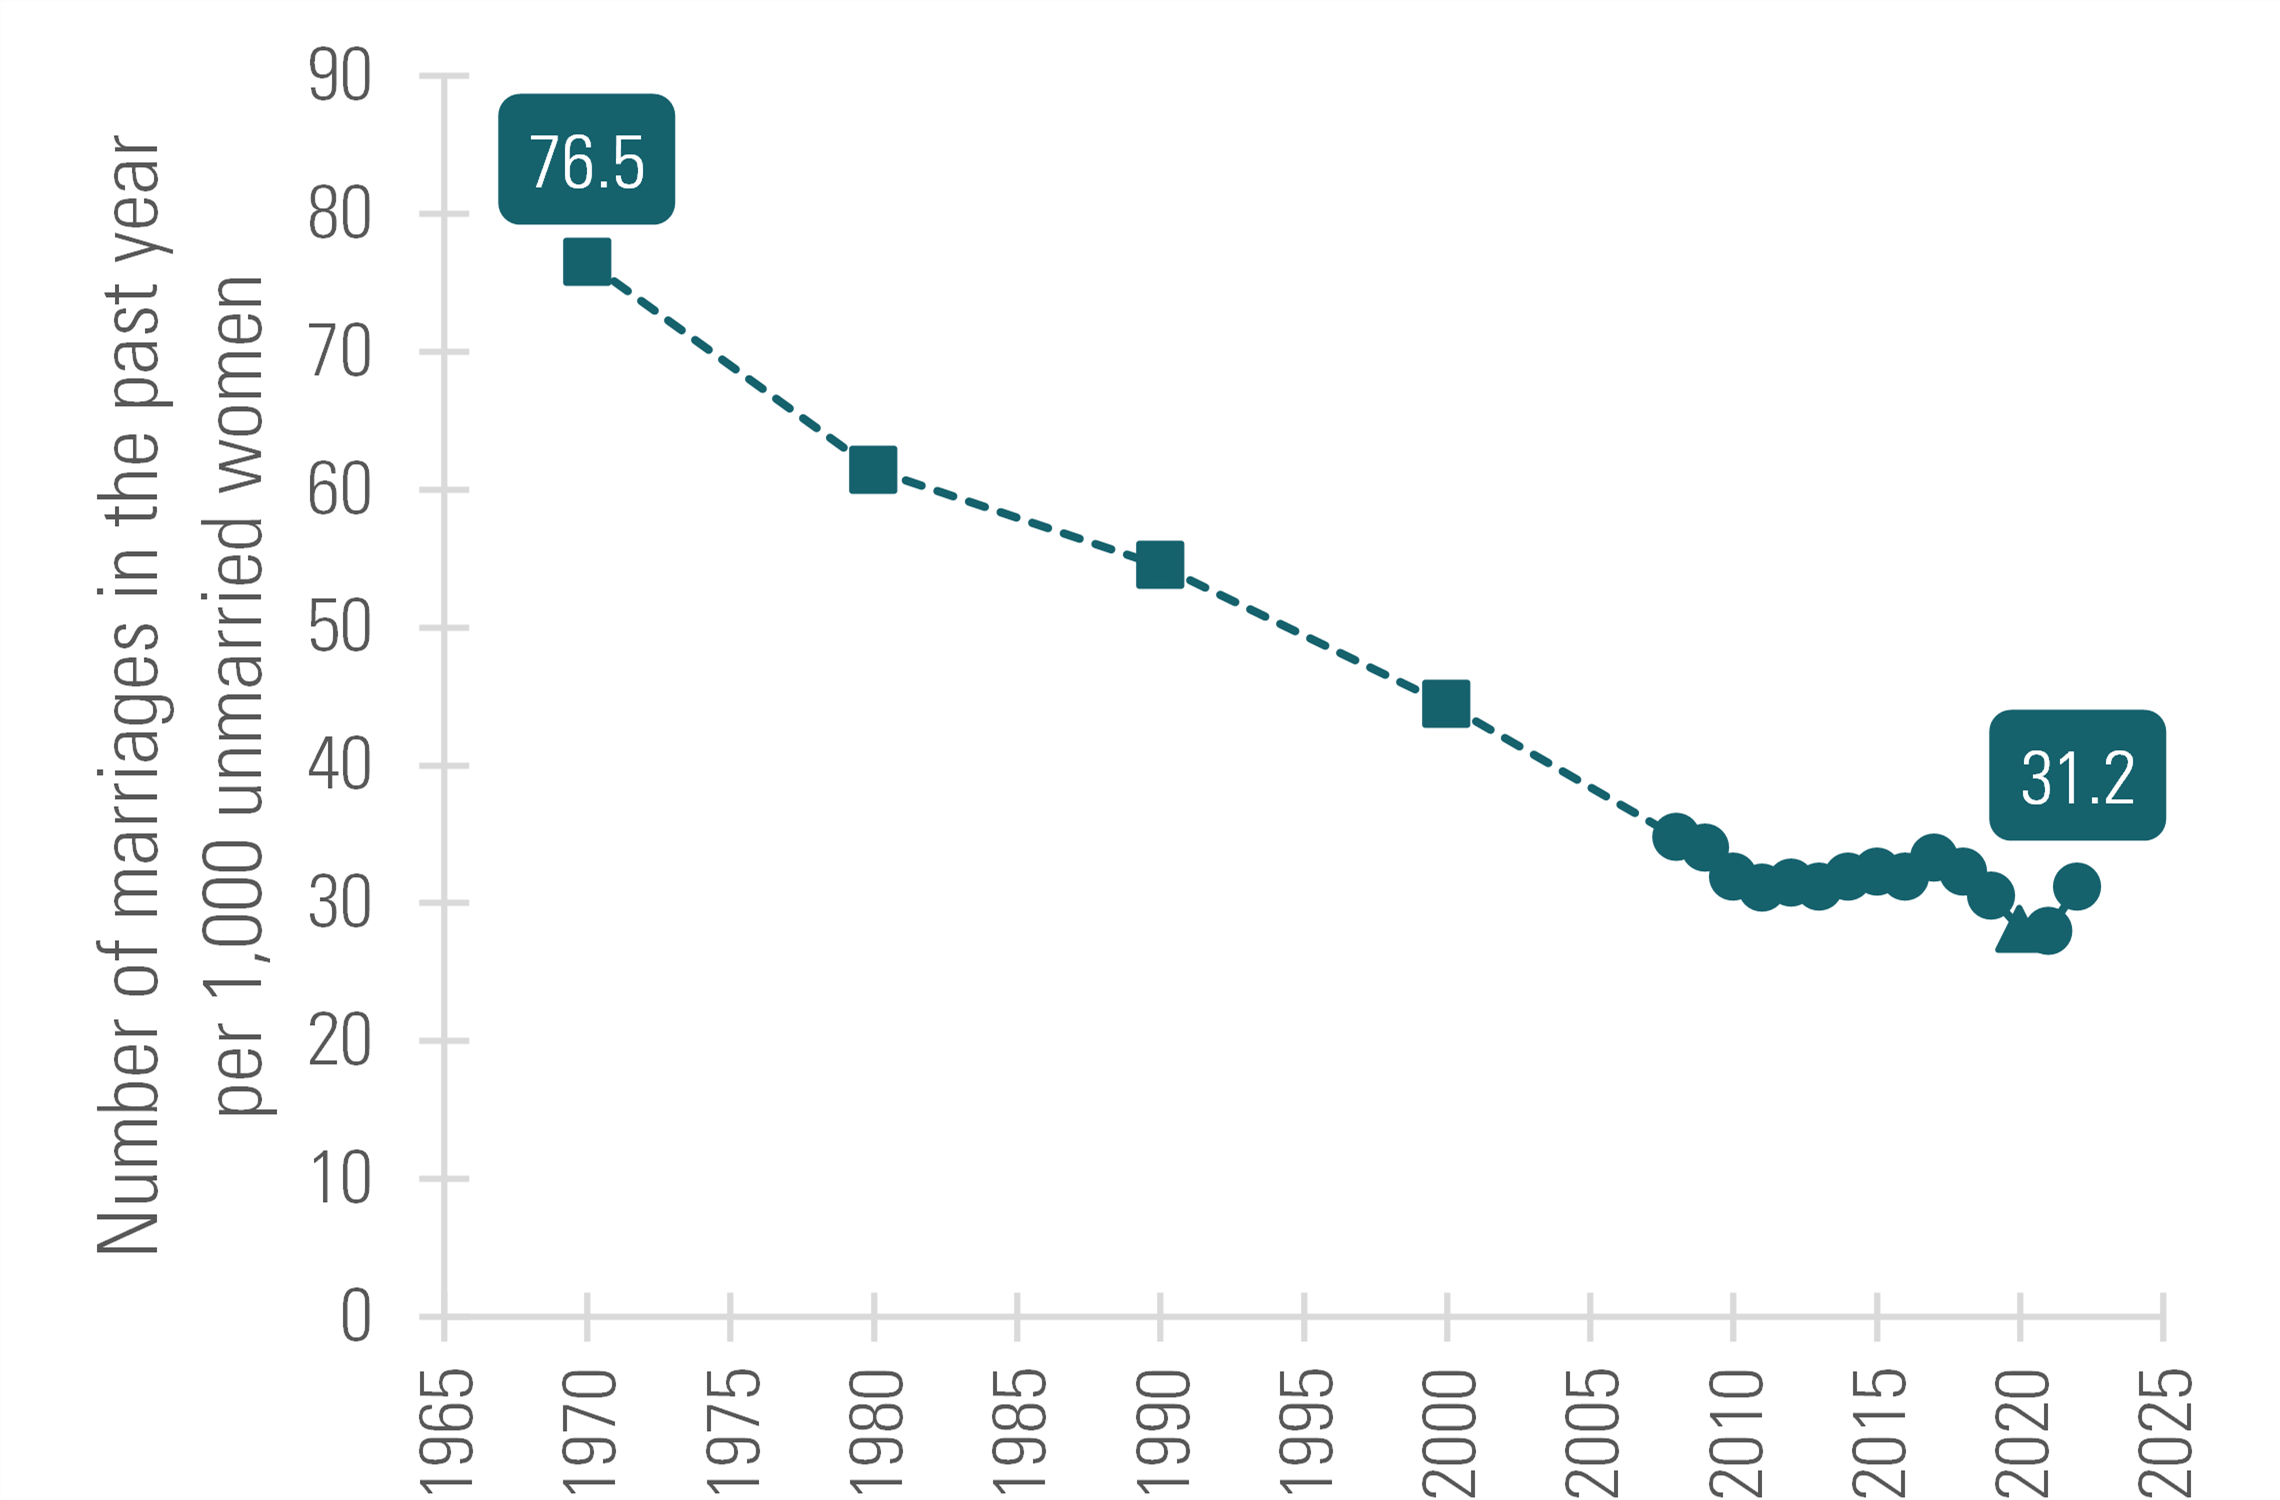
- After reaching a more than 50-year low rate in 2021 of 28.0 (i.e., 28 marriages per 1,000 unmarried women), the marriage rate trend reversed direction in 2022 increasing to 31.2 marriages per 1,000 unmarried women. The marriage rate has returned to the level observed in 2018 (Allred, 2019).
- More than 2 million women (2,322,727) married in 2022, which is an increase of 269,921 women from 2021 when 2,052,806 women married.
Figure 1. Women’s Adjusted Marriage Rate, 1970-2022

Note: This graph illustrates the number of marriages in the past year per 1,000 unmarried women.
Five Highest and Lowest Marriage Rates, 2022
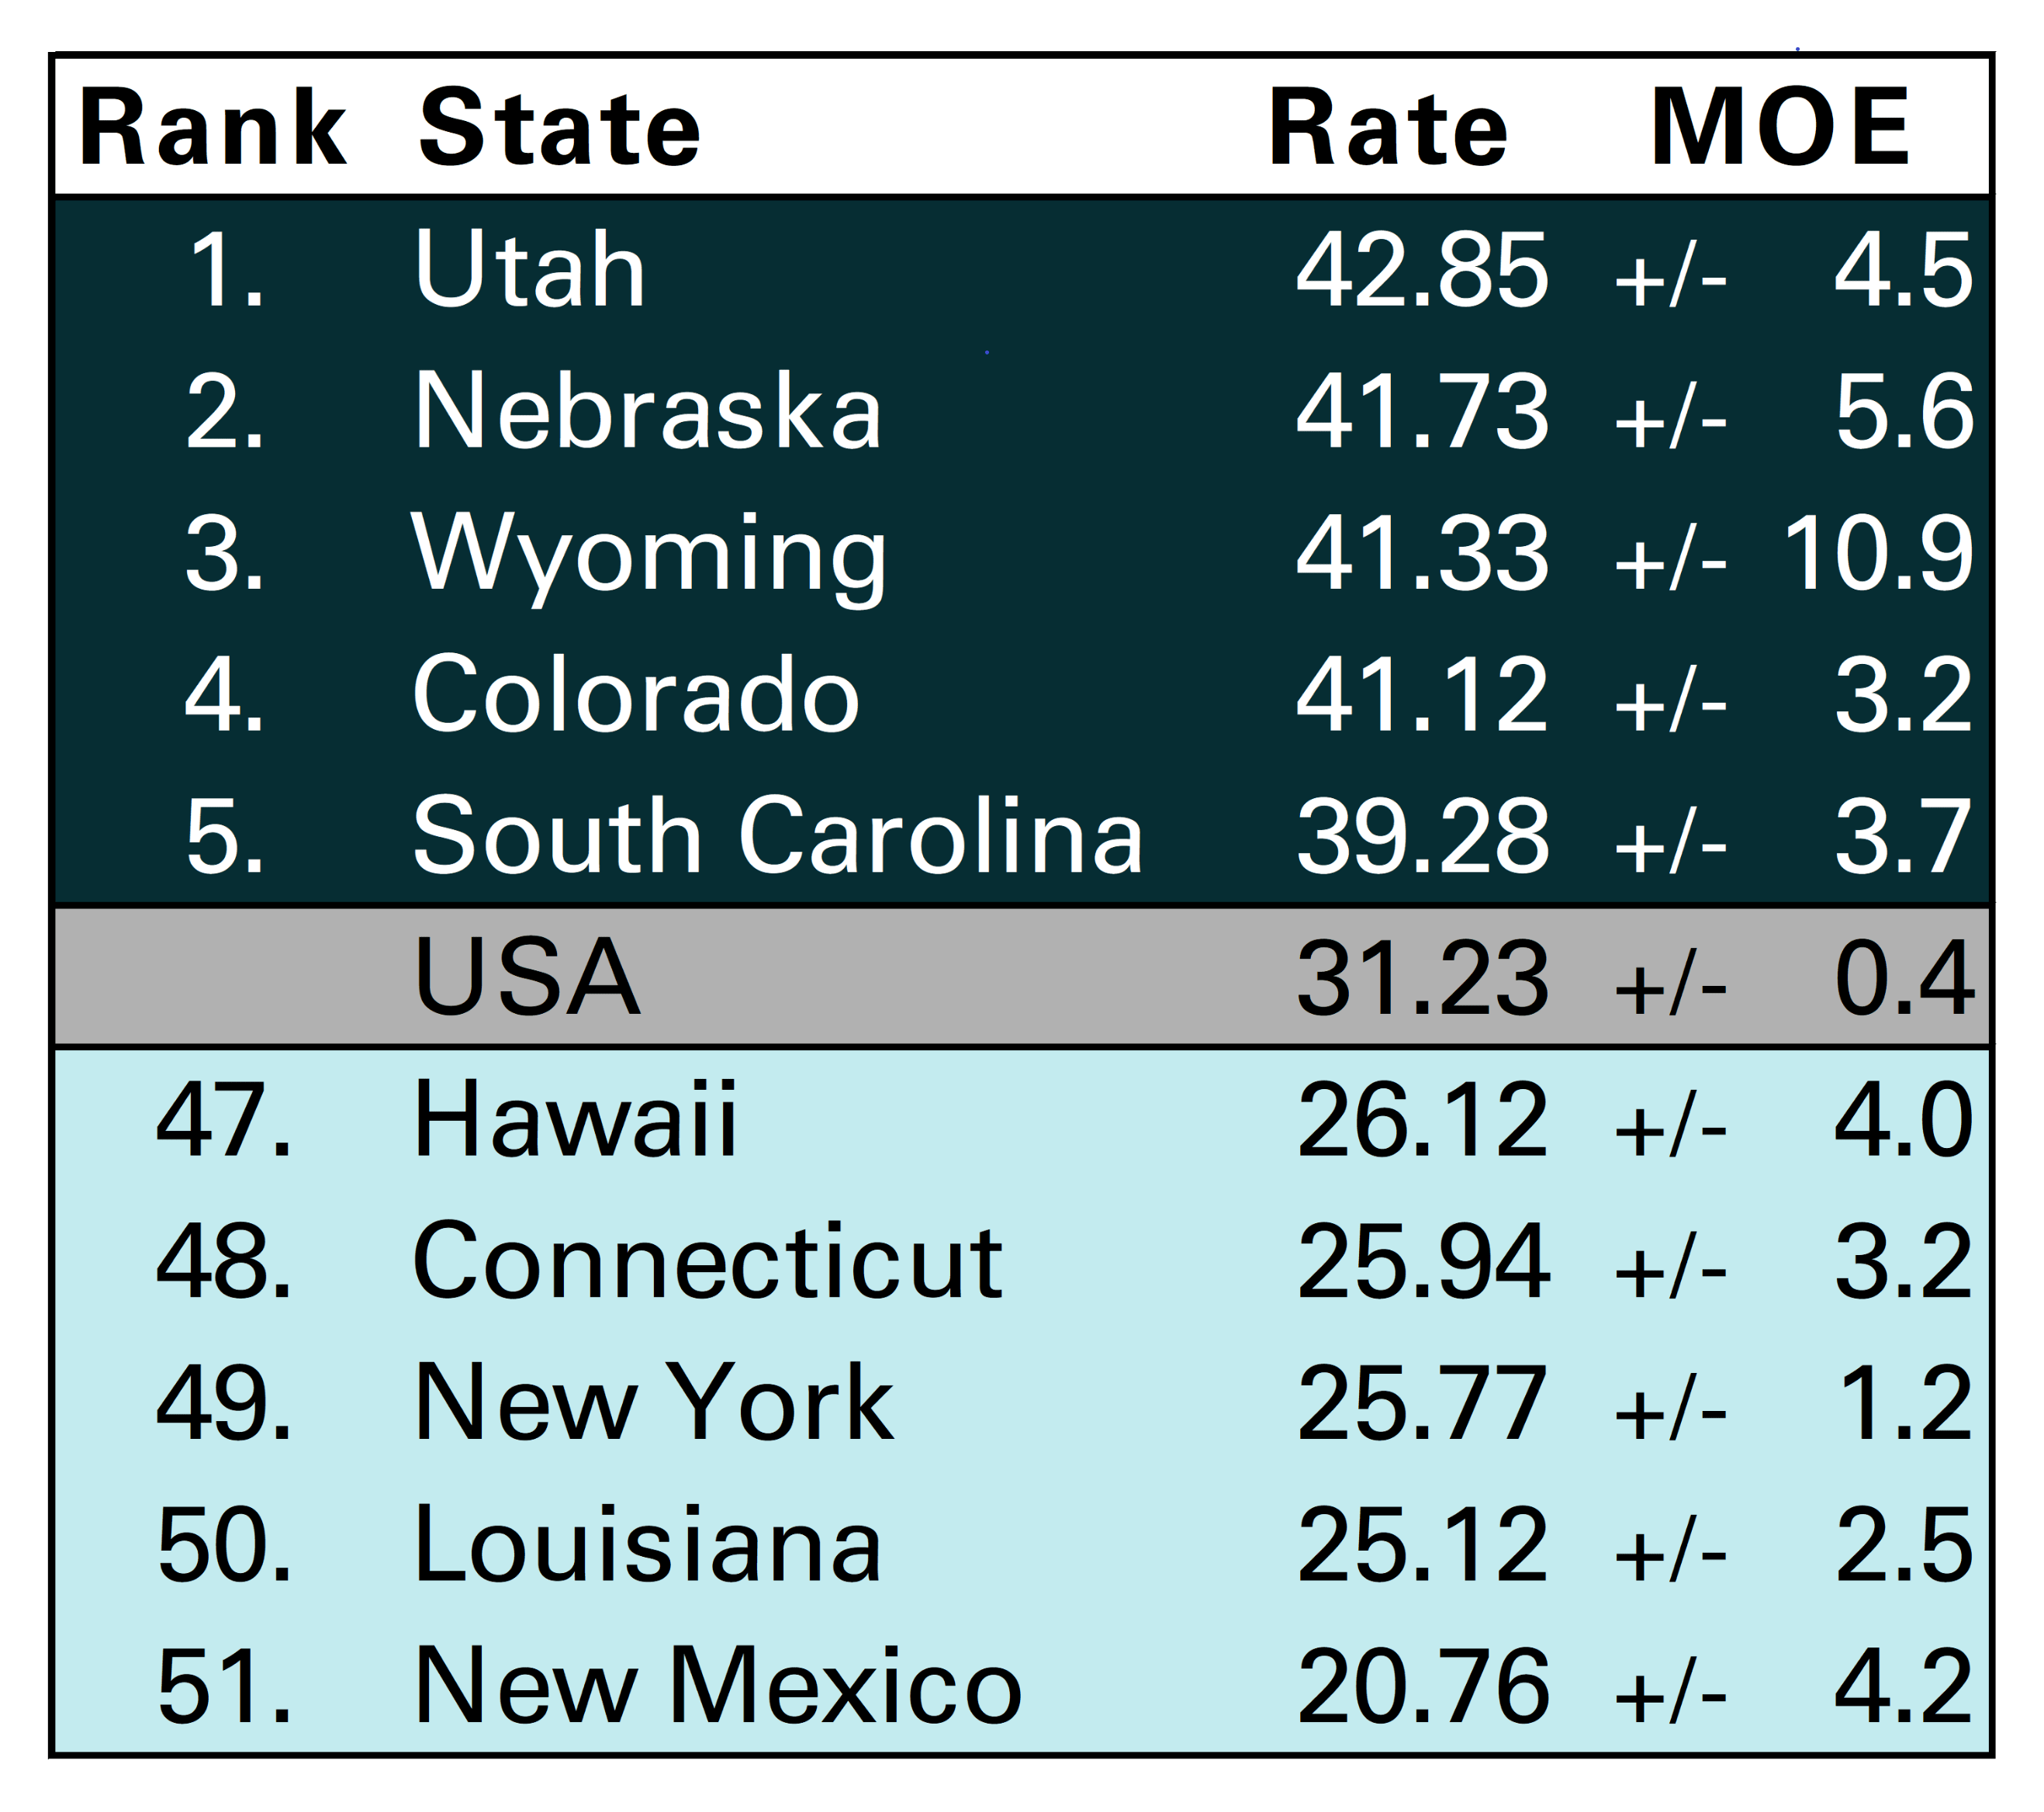
- Although not as high as its marriage rate from last year (49 marriages per 1,000 unmarried women), Utah’s marriage rate maintains at the top of the US states in 2022 with nearly 43 marriages per 1,000 unmarried women.
- New Mexico now is the state with the lowest marriage rate. In 2022, about 21 women married per 1,000 unmarried women in New Mexico, a rate half as high as that among those in Utah.
- The highest marriage rate among states in 2022 was lower than the highest in 2021, and the lowest state-level rate in 2022 was higher than that of 2021, indicating a narrowing of marriage rates between states.
Figure 2. Women's Highest and Lowest Adjusted Marriage Rates, 2022

State Rankings and Geographic Variation in Marriage Rates, 2022
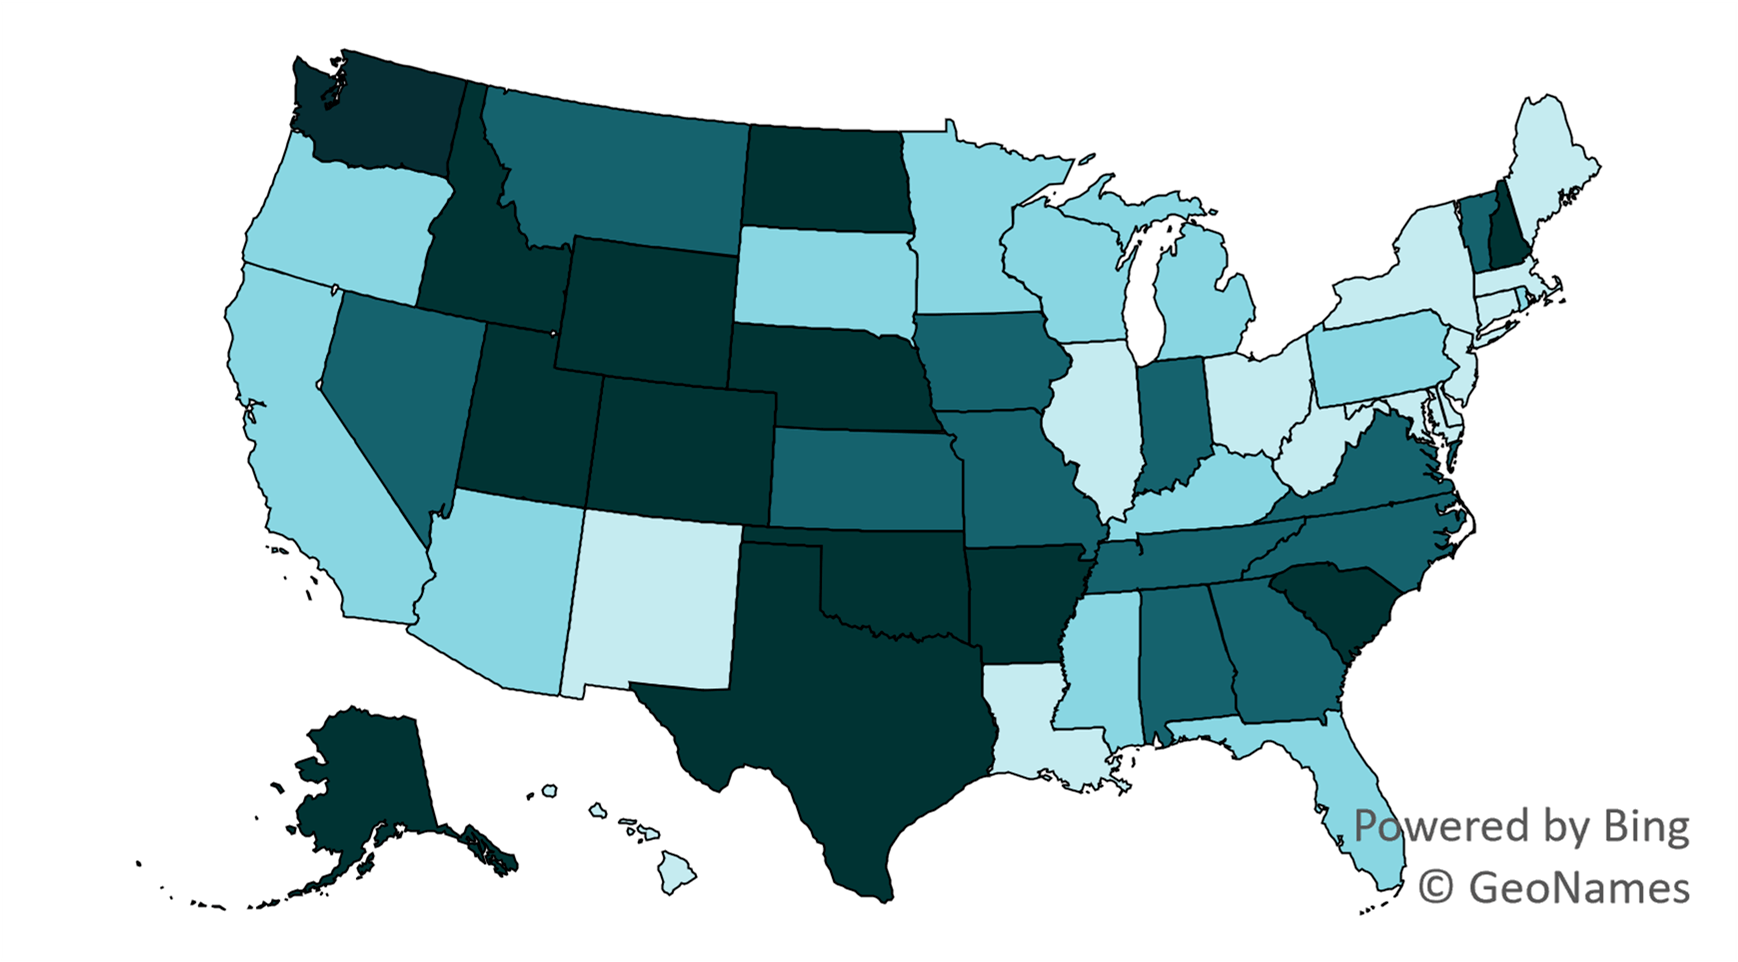
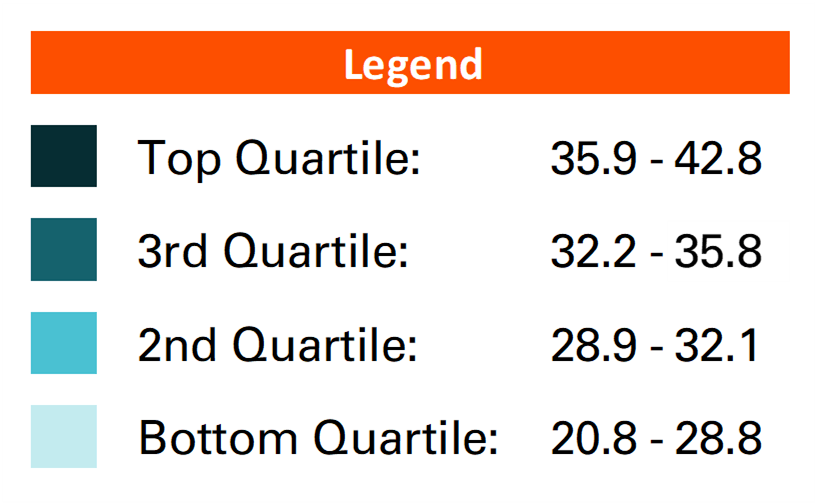
- The states with the highest levels of marriage (composing the top/ fourth quartile) in 2022 had rates of at least 35.9 marriages per 1,000 unmarried women aged 15 and older. Among the states in the top quartile, all were substantially above the national average (31.23 marriages per 1,000 unmarried women).
- The states with the lowest marriage rates (making up the first/ bottom quartile) in 2022 had 28.8 or fewer marriages per 1,000 unmarried women.
Figure 3. State-Level Women’s Adjusted Marriage Rate by Quartile, 2022

Each region in the US (as defined by the US Census Bureau) contains at least one state in each of the 4 quartiles.
- Most states in the Western region of the country had high marriage rates (third or fourth quartile), with 6 of the 12 states in the fourth/top quartile in the West.
- Midwestern states exhibited marriage rates predominantly in the middle two quartiles with 4 states in each quartile.
- North Dakota and Nebraska were the only midwestern states in the fourth/top quartile.
- Ohio and Illinois were the only midwestern states in the first/bottom quartile.
- The largest share of states in the third quartile were in the South.
- Most states in the Northeast exhibited low marriage rates (first/bottom quartile).
- Exceptions included New Hampshire (fourth/top quartile), Vermont (third quartile), and Rhode Island (second quartile).
Figure 4. Geographic Variation of Women’s Adjusted Marriage Rate Among States, 2022


Source: NCFMR analyses of U.S. Census Bureau, American Community Survey, 2022 1-yr est.
Data Source:
Clarke. S. C. (1995). Advanced report of final marriage statistics, 1989 and 1990. Monthly Vital Statistics Report, 42(12). National Center for Health Statistics. https://www.cdc.gov/nchs/data/mvsr/mv43_12.pdf
National Center for Health Statistics (1974). Summary report final marriage statistics, 1970. Monthly Vital Statistics Report, 23(2), Supp.1. U.S. Department of Health, Education, and Welfare. https://www.cdc.gov/nchs/data/mvsr/supp/mv23_02s1acc.pdf
National Center for Health Statistics (1983). Advance report of final marriage statistics, 1980. Monthly Vital Statistics Report, 32(5), Supp. U.S. Department of Health and Human Services. https://www.cdc.gov/nchs/data/mvsr/supp/mv32_05s.pdf
National Center for Health Statistics (2001). Births, marriages, divorces, and deaths: Provisional data for January-December 2000. National Vital Statistics Report, 49(6), Associated Table 3. Department of Health & Human Services, Center for Disease Control and Prevention. https://www.cdc.gov/nchs/data/nvsr/nvsr49/nvsr49_06.pdf
U.S. Census Bureau (2023). American Community Survey, 2021 & 2022 1-Year Estimates [Table B12001]. Retrieved from: https://data.census.gov/cedsci/table?q=B12001&tid=ACSDT1Y2021.B12001
U.S. Census Bureau (2023). American Community Survey, 2021 & 2022 1-Year Estimates [Table B12501]. Retrieved from: https://data.census.gov/cedsci/table?q=B12501&tid=ACSDT1Y2021.B12501
U.S. Census Bureau (2021). American Community Survey, 2020 1-year Experimental PUMS
References:
Allred, C. (2019). Marriage rate in the U.S.: Geographic variation, 2018. Family Profiles, FP-19-22. Bowling Green, OH: National Center for Family & Marriage Research. https://doi.org/10.25035/ncfmr/fp-19-22
Hemez, P. (2017). Marriage rate in the U.S.: Geographic variation, 2016. Family Profiles, FP-17-25. Bowling Green, OH: National Center for Family & Marriage Research. https://doi.org/10.25035/ncfmr/fp-17-25
Reynolds, L (2020). Marriage rate in the U.S.: Geographic variation, 2019. Family Profiles, FP-20-24. Bowling Green, OH: National Center for Family Marriage Research. https://doi.org/10.25035/ncfmr/fp-20-24
Schweizer, V. J. (2018). Marriage rate in the U.S.: Geographic variation, 2017. Family Profiles, FP-18-20. Bowling Green, OH: National Center for Family Marriage Research. https://doi.org/10.25035/ncfmr/fp-18-20
Westrick-Payne, K. K. (2023). Charting marriage and divorce in the U.S.: The adjusted divorce rate. Bowling Green, OH: National Center for Family & Marriage Research. https://www.bgsu.edu/content/dam/BGSU/college-of-arts-and-sciences/NCFMR/documents/RBT/charting-us-marriage-2008-2022.pdf
Suggested Citation:
Loo, J. (2023). Marriage rate in the U.S.: Geographic variation, 2022. Family Profiles, FP-23-23. Bowling Green, OH: National Center for Family & Marriage Research. https://doi.org/10.25035/ncfmr/fp-23-23
Updated: 11/07/2025 04:48PM

