Single, Cohabiting, and Married Households: 1995, 2012, and 2019
Family Profile No. 26, 2019
Author: Paul Hemez
Changes in family formation and dissolution as evidenced by changes in the marriage rate, divorce rate, and cohabitation experiences have shaped American households over the past several decades (Cherlin, 2010). Furthermore, family formation patterns differ across demographic subgroups, suggesting changes in household characteristics are not the same for all U. S. households (Manning, Brown, Payne, 2014; Raley, Sweeney, & Wondra, 2015). This Family Profile uses three years of the Current Population Survey to explore changes in the shares of single, cohabiting, and married-couple households between 1995 and 2019. Households are examined by age, race-ethnicity, and educational attainment of the household-head to consider how changes in household types vary across demographic subgroups.
Age
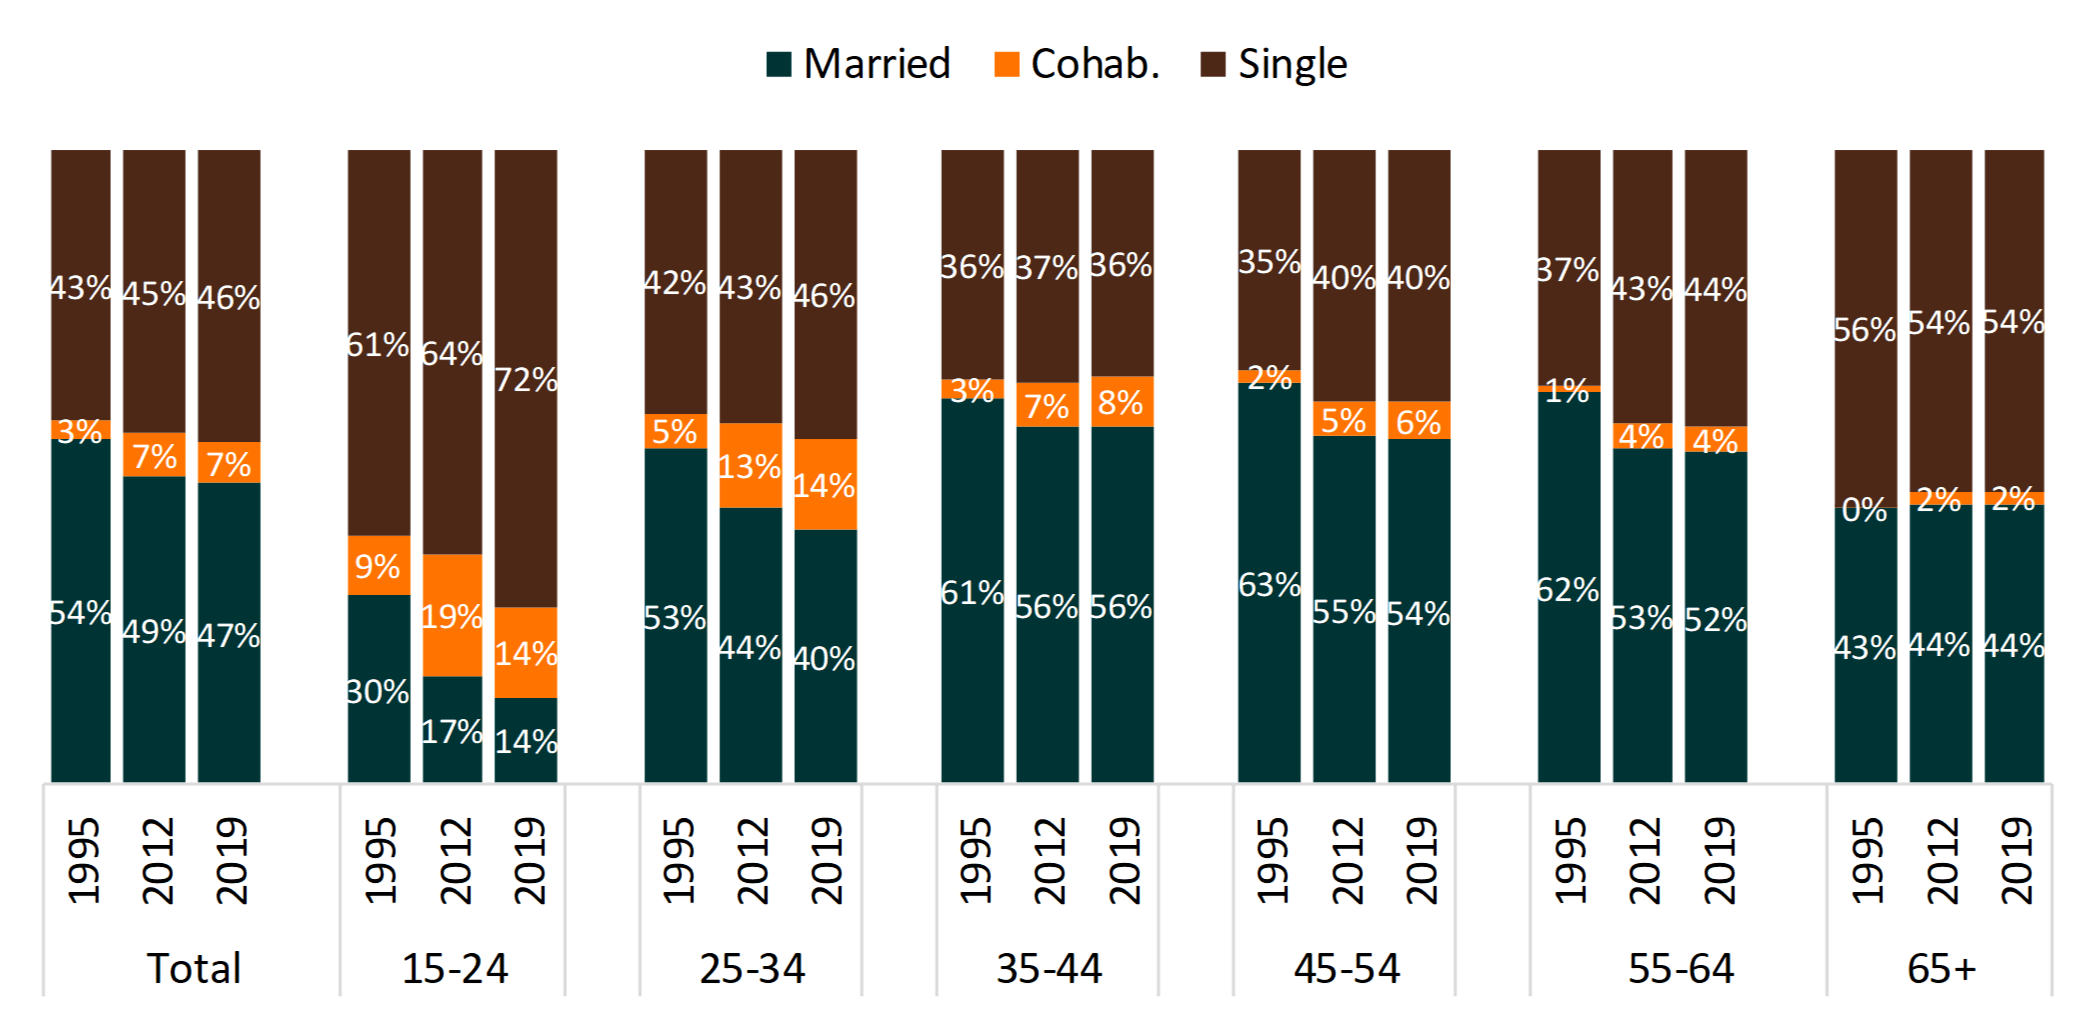
- In 1995, a majority of households (54%) were married-couple households. By 2012, however, fewer than half (49%) were, and this share continued to decline in 2019 (47%).
- Change in the share of married-couple households was most pronounced among those aged 15-24, where the proportion of married-couple households was halved between 1995 and 2019.
- Overall, the share of cohabiting-couple households more than doubled (141% increase) between 1995 and 2019.
- During the past quarter-century, the largest share of cohabiting households was among those aged 15-24 and 25-34.
- The shares of single-person households changed less than coupled households.
- Single-person households increased for all age groups except those aged 35-44 (remained relatively stable) and those aged 65+ (slight decrease). The largest increase was experienced among those aged 15-24 – increasing from 61% of all households in 1995 to 72% in 2019.
Figure 1. Changes in the Shares of Single, Cohabiting, and Married Households, by Age

Source: NCFMR analyses of Current Population Survey, 1995, 2012, & 2019 (IPUMS-CPS, University of Minnesota, www.ipums.org)
Race & Ethnicity
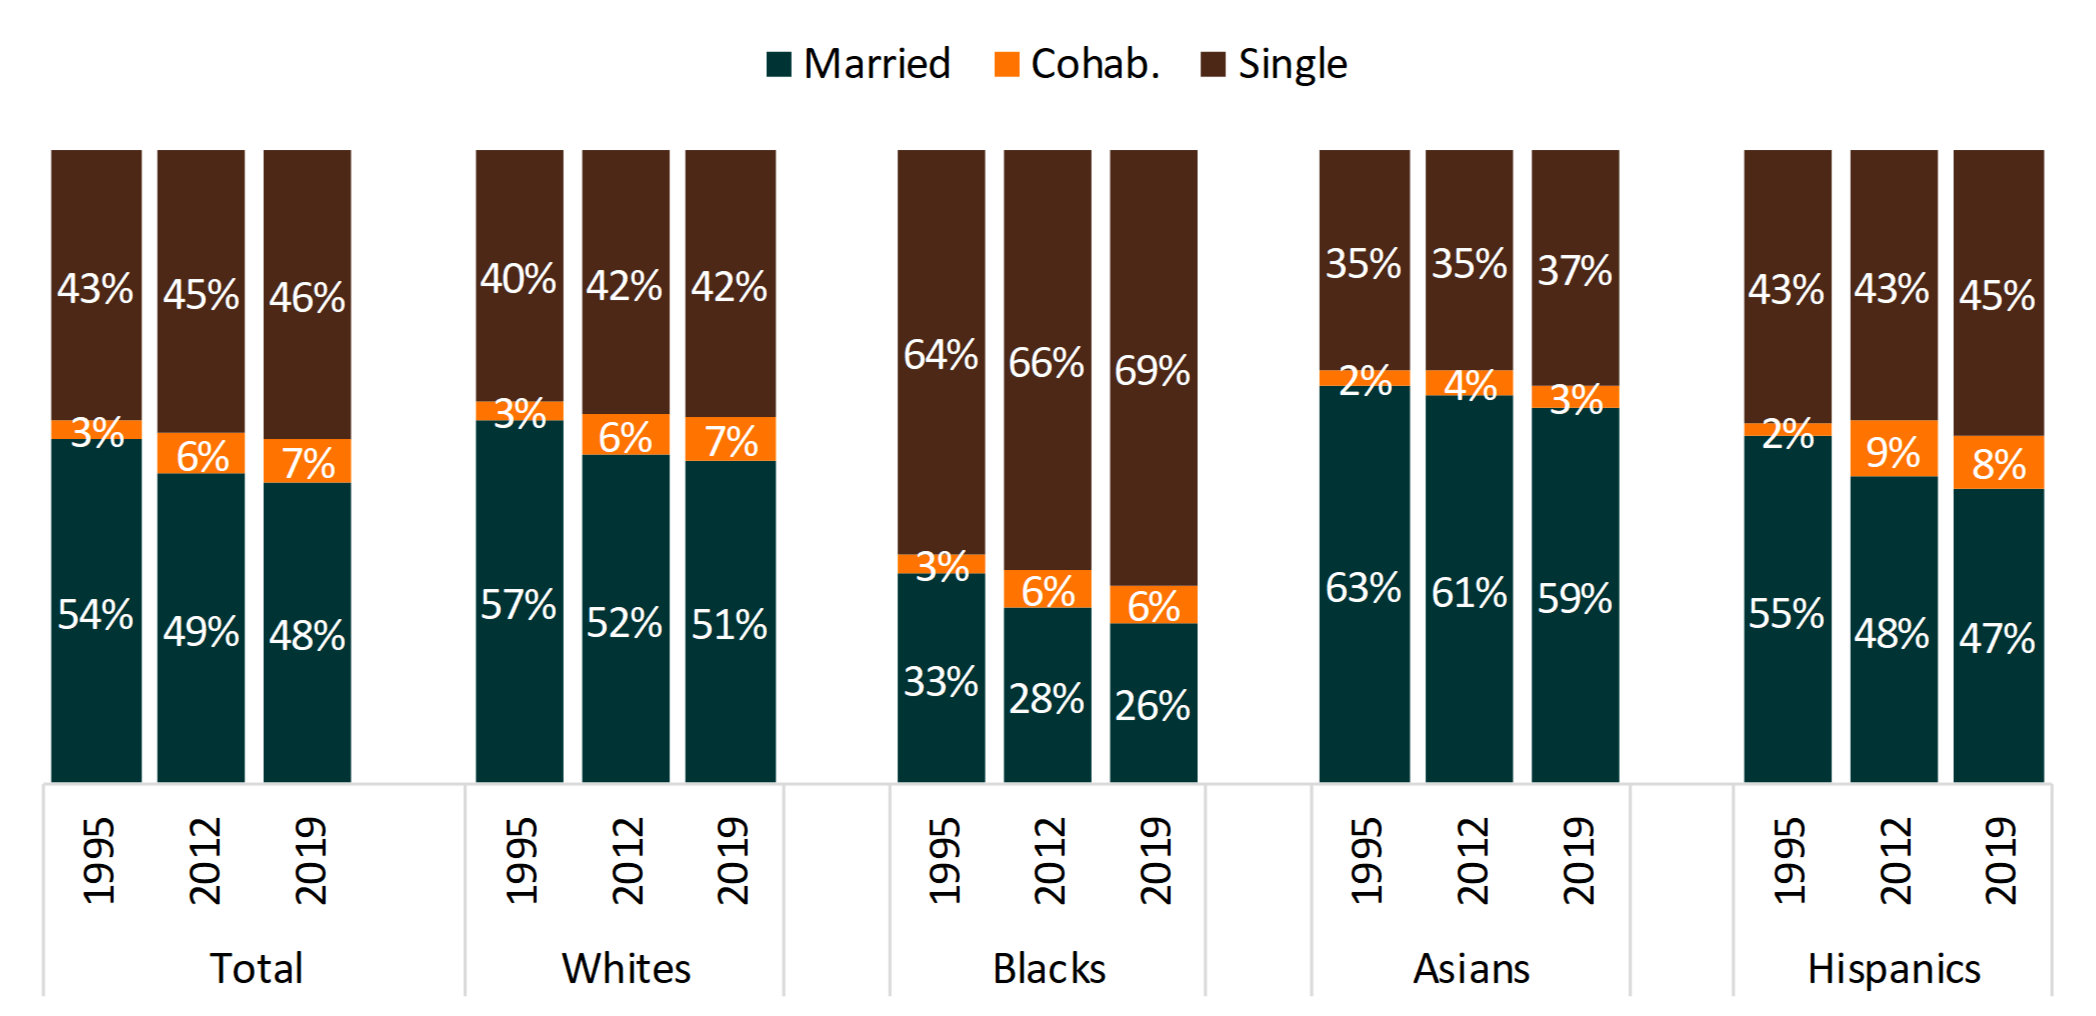
- The share of married-couple households declined for each race-ethnic group, with Blacks experiencing the sharpest reductions.
- Further, in each year considered, Blacks lived in a married-couple household least often, whereas Asians reported living in such a household most often.
- Hispanics experienced the largest percentage increase in the share of cohabiting households with a four-fold increase.
- Whites had the second largest increase with the share cohabiting more than doubling since 1995.
- Single-person households were much more common for Blacks regardless of year – more than two-thirds of households were non-coupled compared to less than half among other racial-ethnic groups.
Figure 2. Changes in the Shares of Single, Cohabiting, and Married Households, by Race-Ethnicity

Source: NCFMR analyses of Current Population Survey, 1995, 2012, & 2019 (IPUMS-CPS, University of Minnesota, www.ipums.org)
Educational Attainment
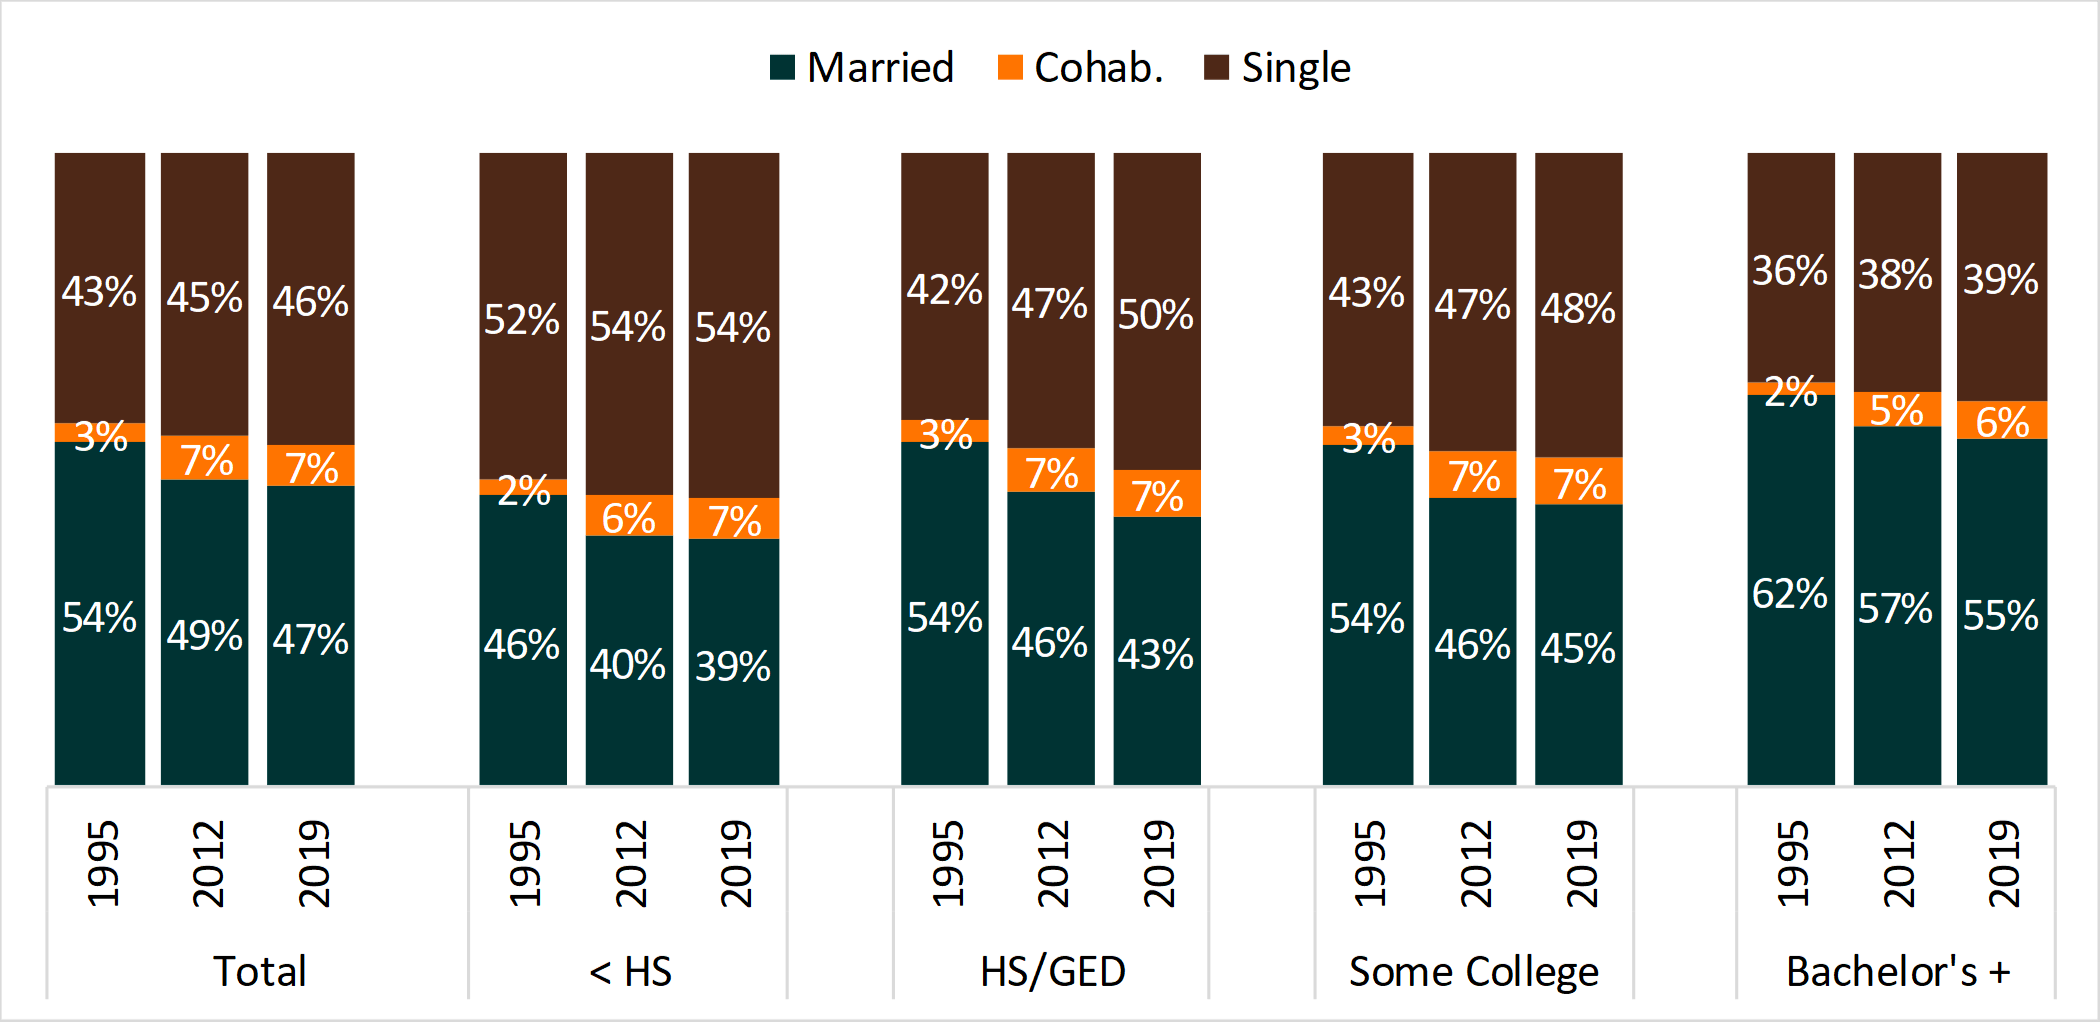
- Throughout the years considered, individuals with less than a high school education lived in a married-couple household less often than their more educated counterparts (Figure 3).
- Conversely, those with at least a bachelor’s degree had the largest share living in a married-couple household.
- For each educational attainment group, the prevalence of cohabiting couples doubled between 1995 and 2019.
- Additionally, there are no differences in the shares of individuals living in cohabiting households by educational attainment.
- Between 1995 and 2019, being single became more common for all educational attainment groups.
- An education gradient remains, with the share living in a single household decreasing as educational attainment increases.
Figure 3. Changes in the Shares of Single, Cohabiting, and Married Households, by Educational Attainment

Source: NCFMR analyses of Current Population Survey, 1995, 2012, & 2019 (IPUMS-CPS, University of Minnesota, www.ipums.org)
Data Source
- Flood, S., King, M., Rodgers, R., Ruggles, S., & Warren J. R. (2018). Integrated Public Use Microdata Series, Current Population Survey: Version 6.0 [dataset]. Minneapolis, MN: IPUMS. https://doi.org/10.18128/D030.V6.0
References
- Cherlin, A. J. (2010). Demographic trends in the United States: A review of research in the 2000s. Journal of Marriage and Family, 72(3), 403-419.
- Manning, W. D., Brown, S. L., & Payne, K. K. (2014). Two decades of stability and change in age at first union formation. Journal of Marriage and Family, 76(2), 247-260.
- Raley, R. K., Sweeney, M. M., & Wondra, D. (2015). The growing racial and ethnic divide in US marriage patterns. The Future of children/Center for the Future of Children, the David and Lucile Packard Foundation, 25(2), 89.
Suggested Citation
- Hemez, P. (2019). Single, cohabiting, & married households: 1995, 2012, & 2019. Family Profiles, FP-19-26. Bowling Green, OH: National Center for Family & Marriage Research. https://doi.org/10.25035/ncfmr/fp-19-26
Updated: 11/07/2025 04:11PM

