Variation in Men’s Actual + Intended Number of Children
Family Profile No. 15, 2021
Author: Karen Benjamin Guzzo
Childbearing preferences are an important component driving childbearing behaviors at the individual level and fertility levels at the population level. Most work on childbearing preferences examines women’s plans, ignoring that men have their own fertility goals. In this profile, we consider men’s average actual + intended number of children (the number of children men already have plus the number they intend to have in the future) using the 2015-19 National Survey of Family Growth; when weighted, it represents the year 2017. We consider variation across age, race-ethnicity-nativity, and union status.
Age Variation
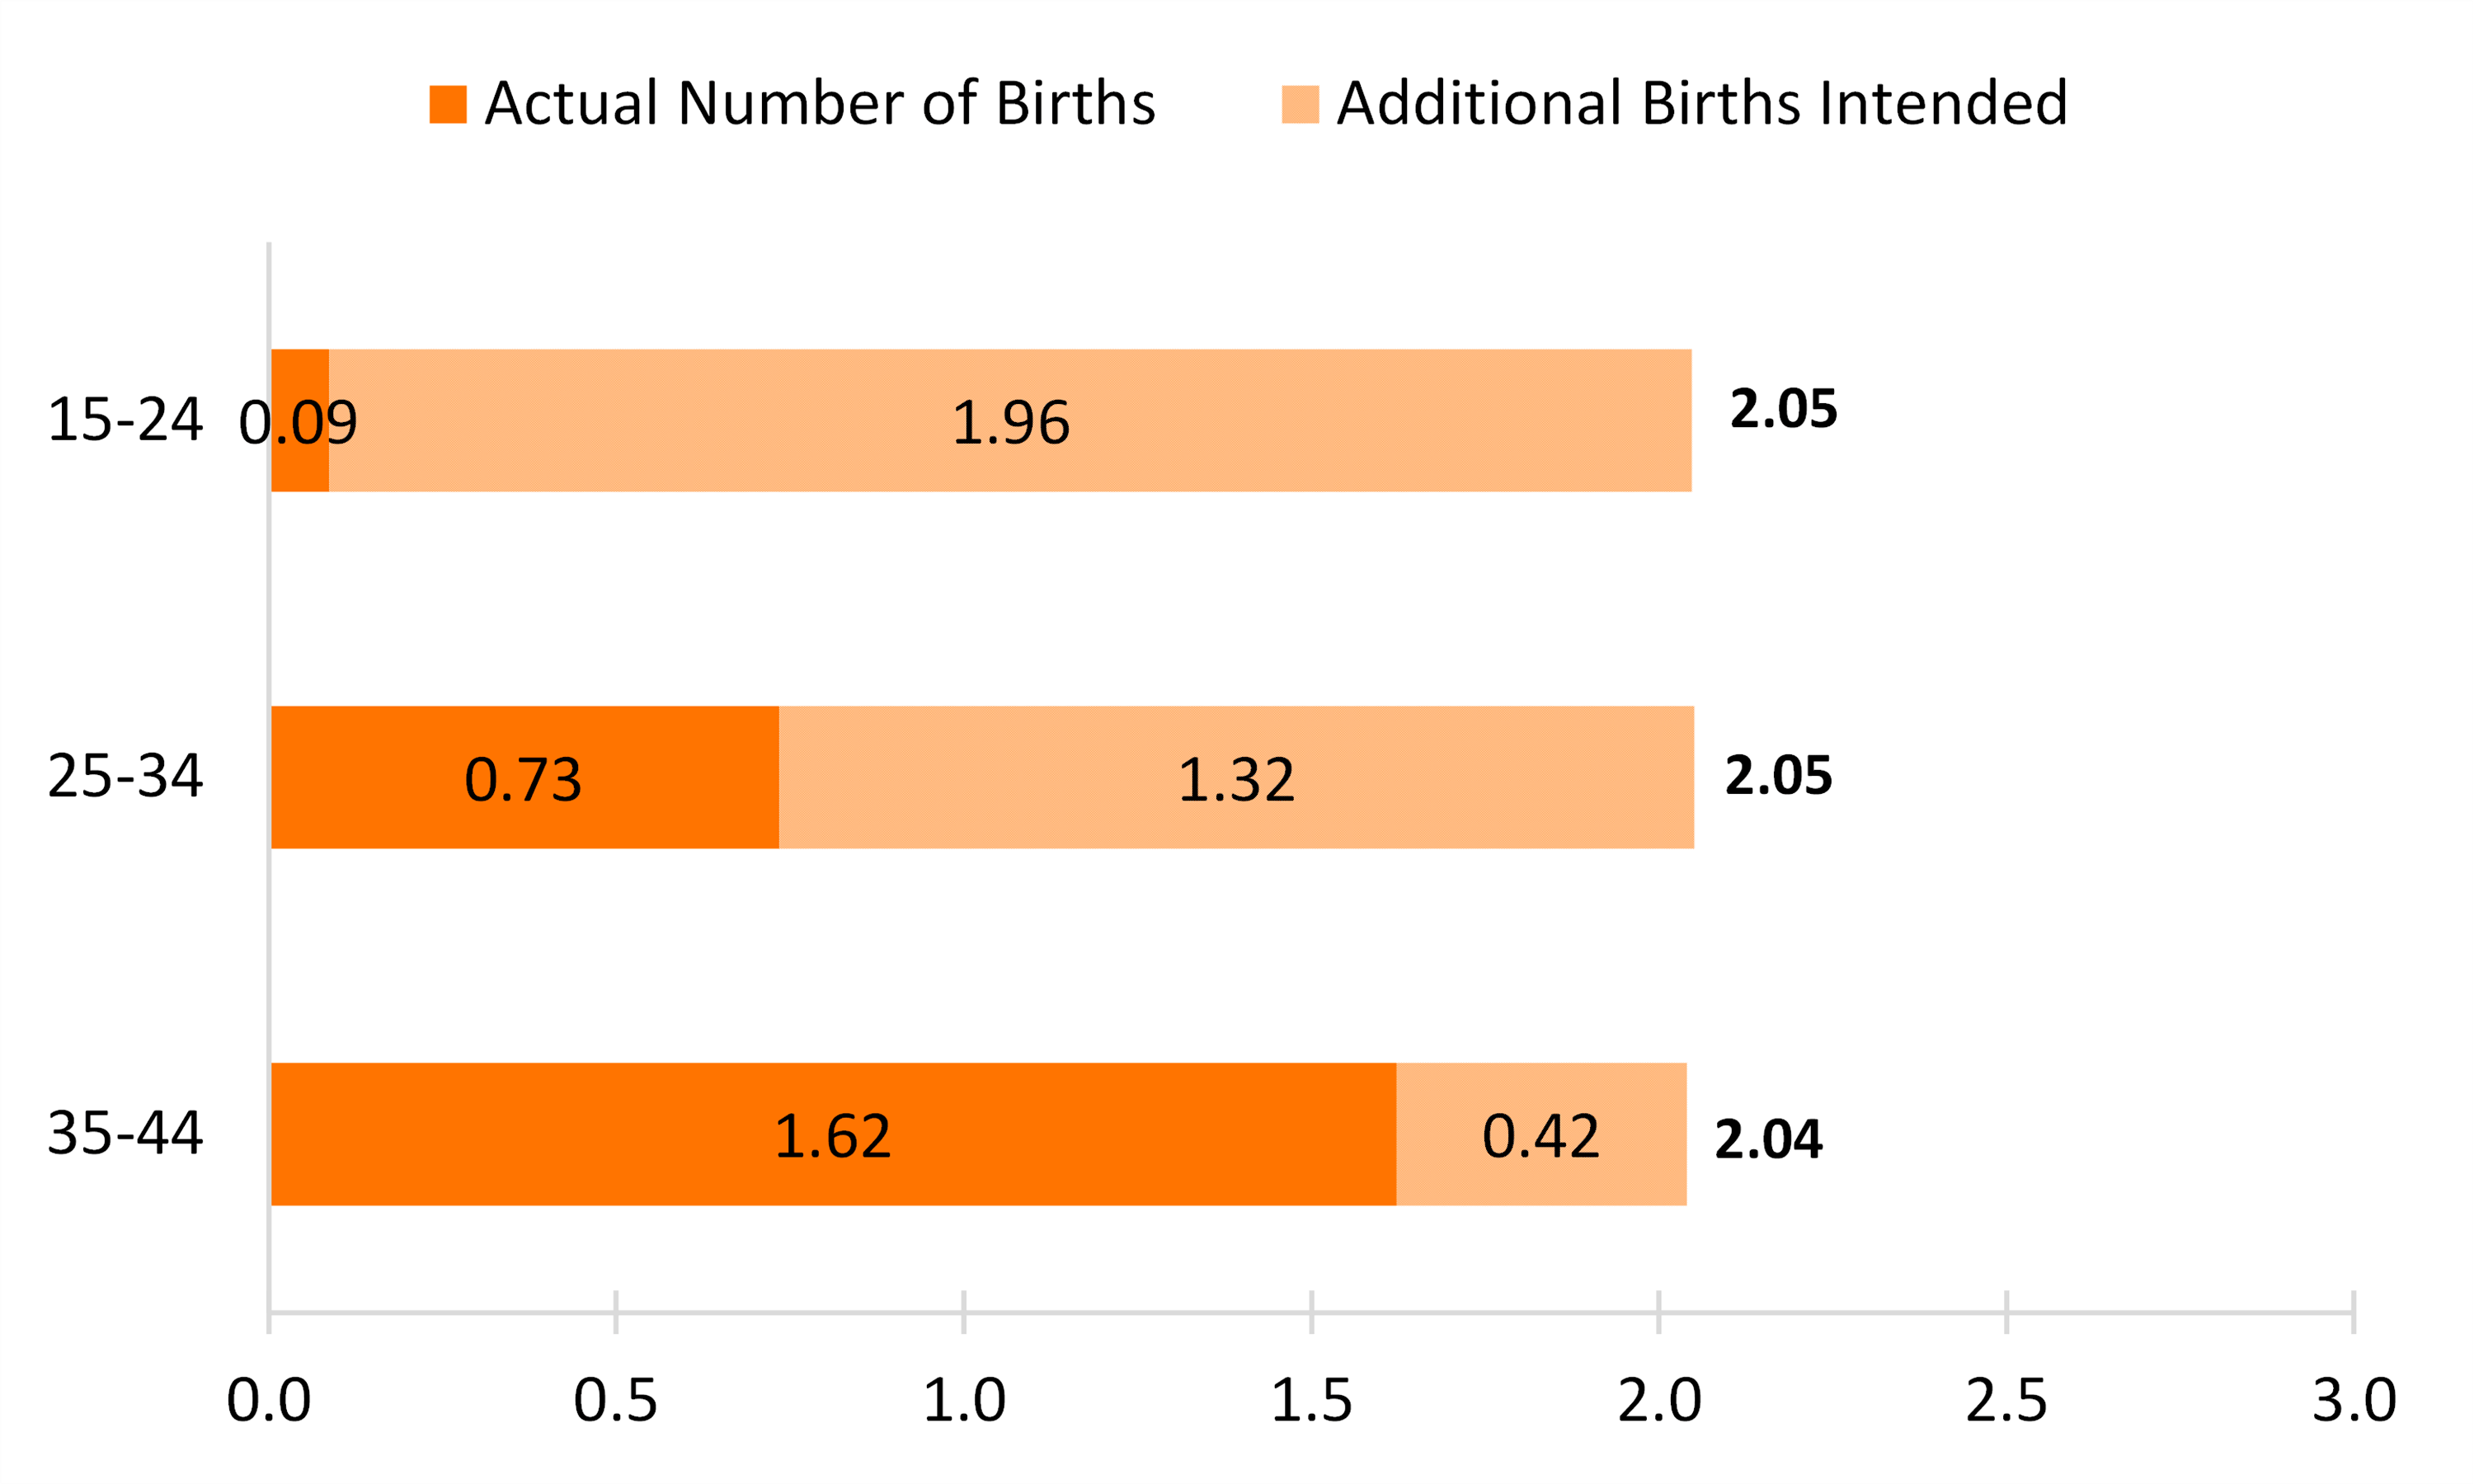
There was little variation across the three 10-year age groups – all groups reported an average actual + intended parity of just over 2.0.
- For men aged 15-24, the average number of children at the time of interview was very low, as few of them were fathers; most of this age group’s childbearing would occur in the future, and they essentially intended to have two children.
- Many men aged 25-34 had already become fathers (with an average of 0.73 children), intending to have an average of 1.32 additional children in the future.
- Men 35-44 had the highest average number of children at 1.62. On average, they intended to have only 0.42 additional children in the future.
Figure 1. Average Actual + Intended Number of Children Among Men 15-44, by Age Group

Average Actual + Intended Number of Children
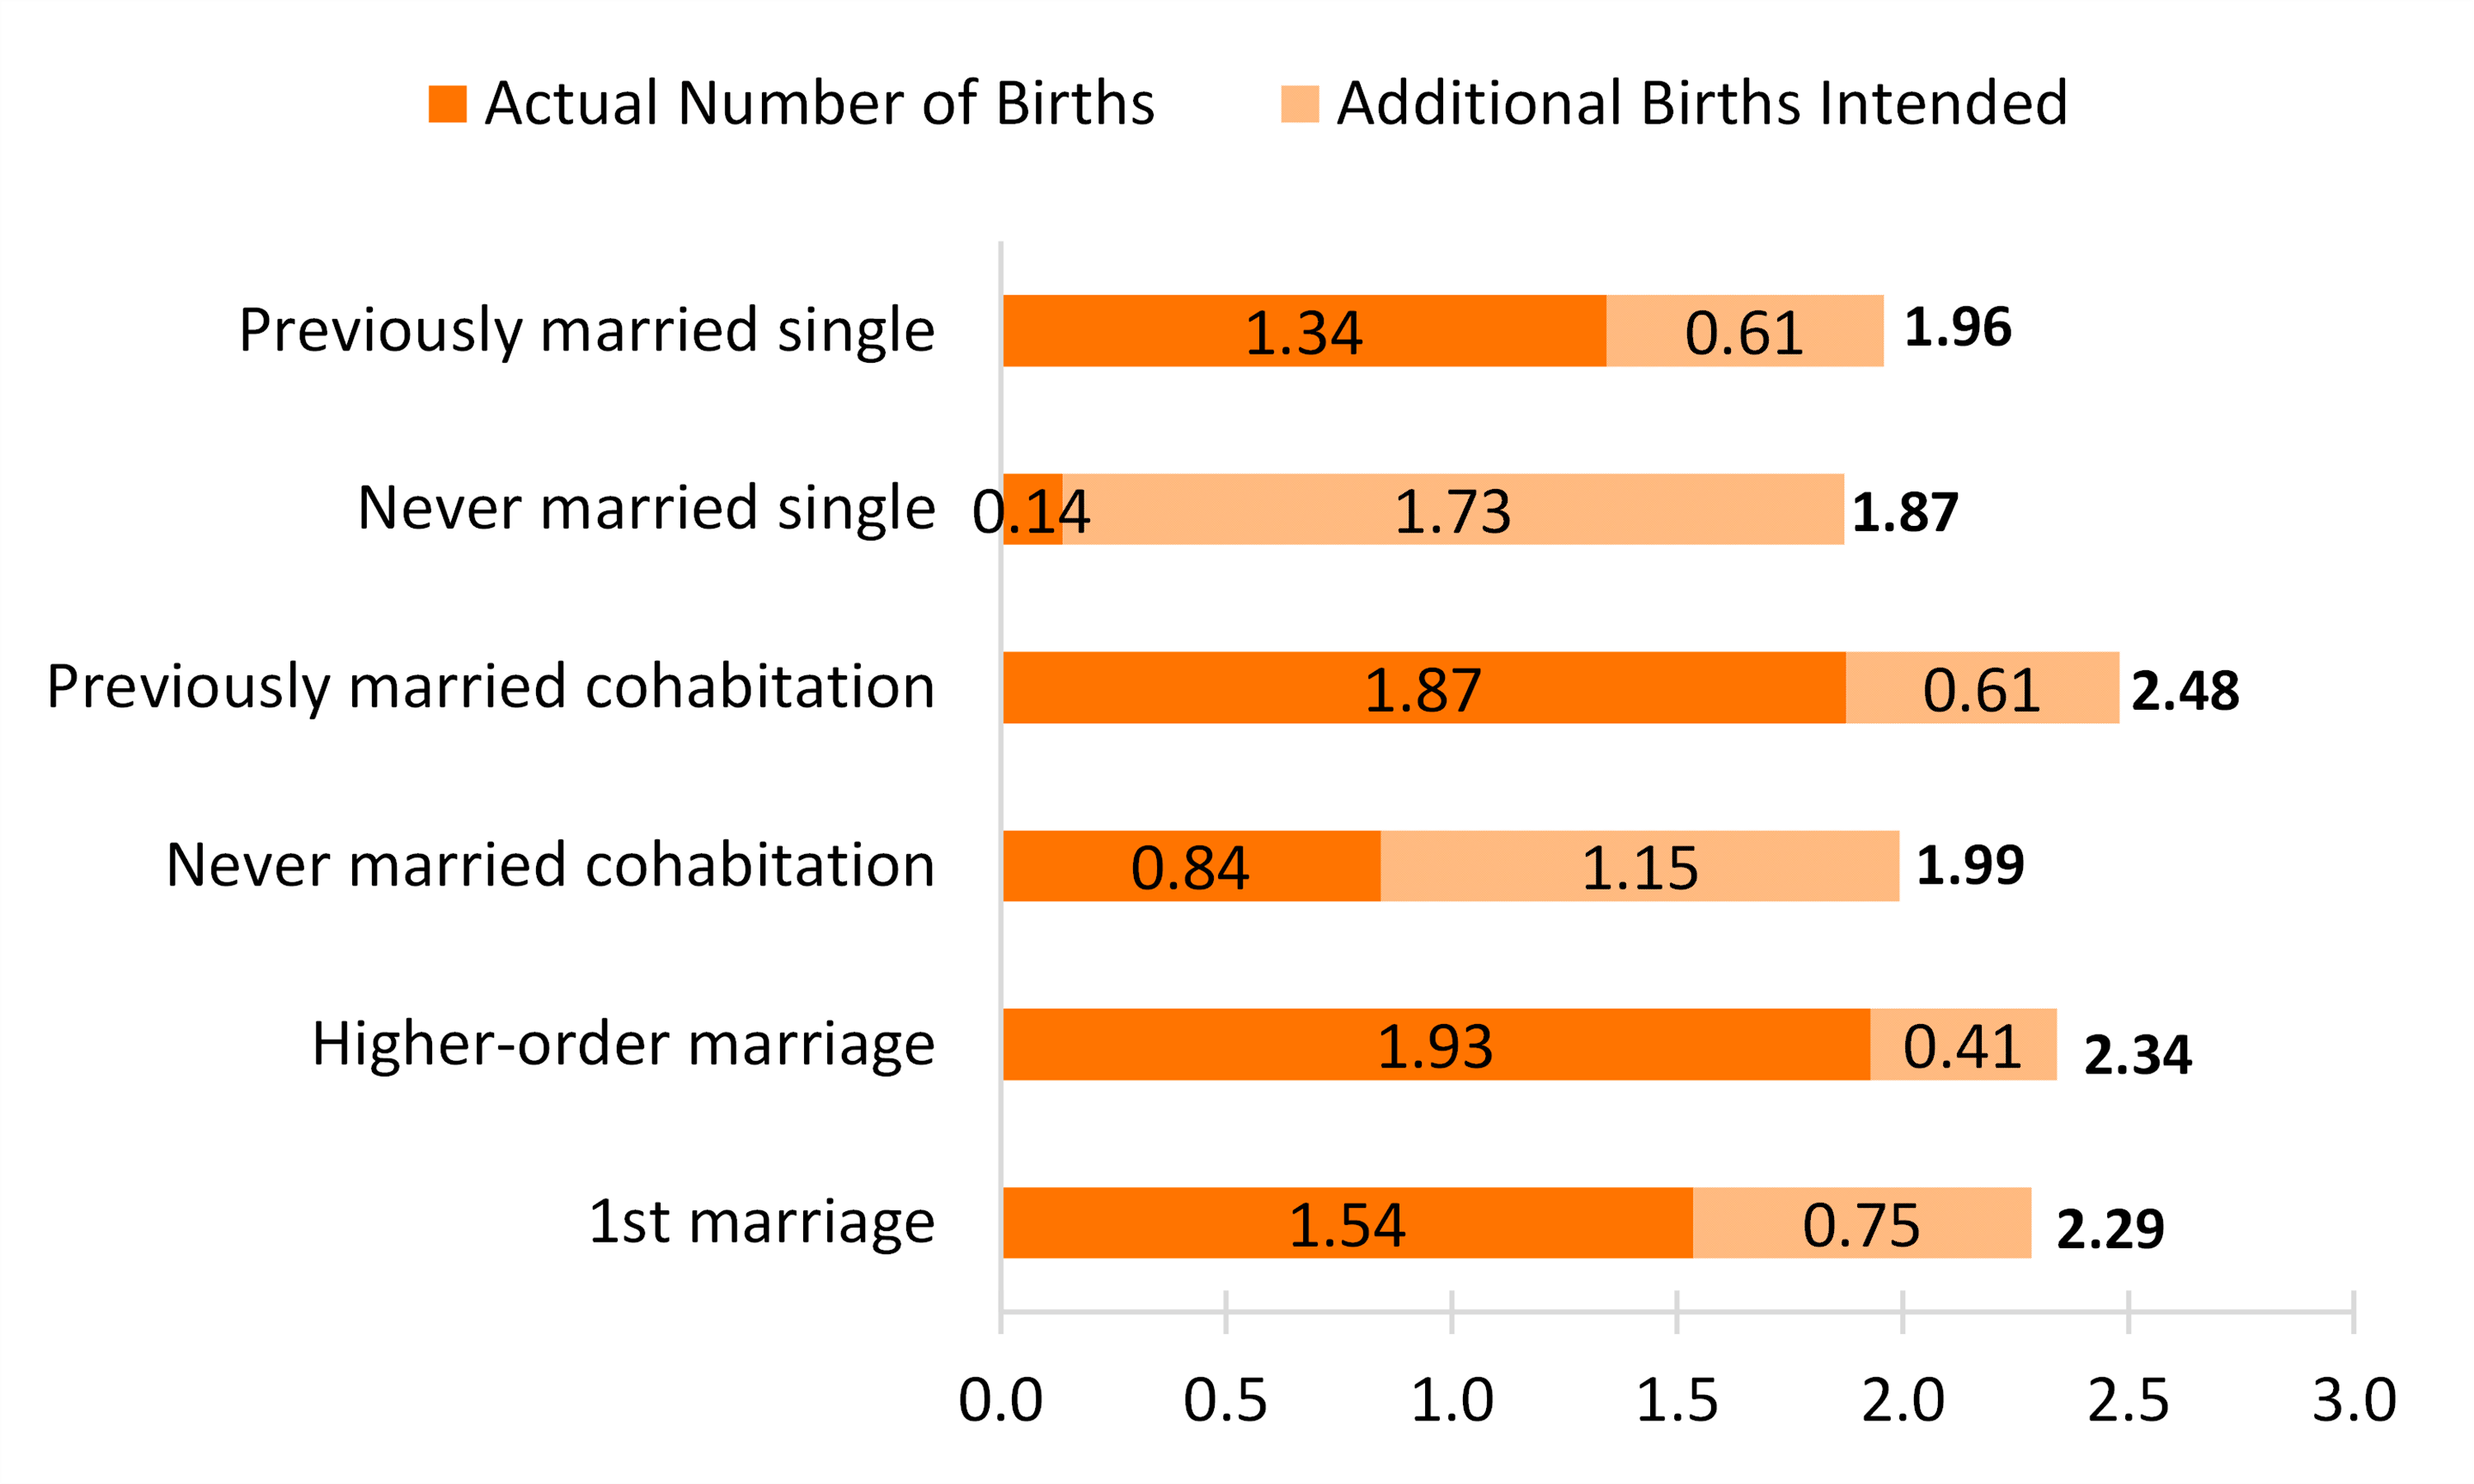
The average actual + intended number of children varied by 0.61 across marital status and marital history.
- Never married single men’s average actual + intended number of children was the lowest at 1.87, and previously married cohabiting men’s was the highest at 2.48 children.
- Previously married single men had an average of 1.96 children, higher than their never-married counterparts but lower than previously married cohabiting men or men in second or higher-order marriages.
- The average actual + intended number of children among never married cohabiting men was 1.99.
- Married men in first marriages had an average actual + intended number of children of 2.29, and their counterparts who were in second or higher-order marriages had a slightly higher average of 2.34.
Figure 2. Average Actual + Intended Number of Children Among Men 15-44, by Union Status

Race-Ethnicity-Nativity Variation
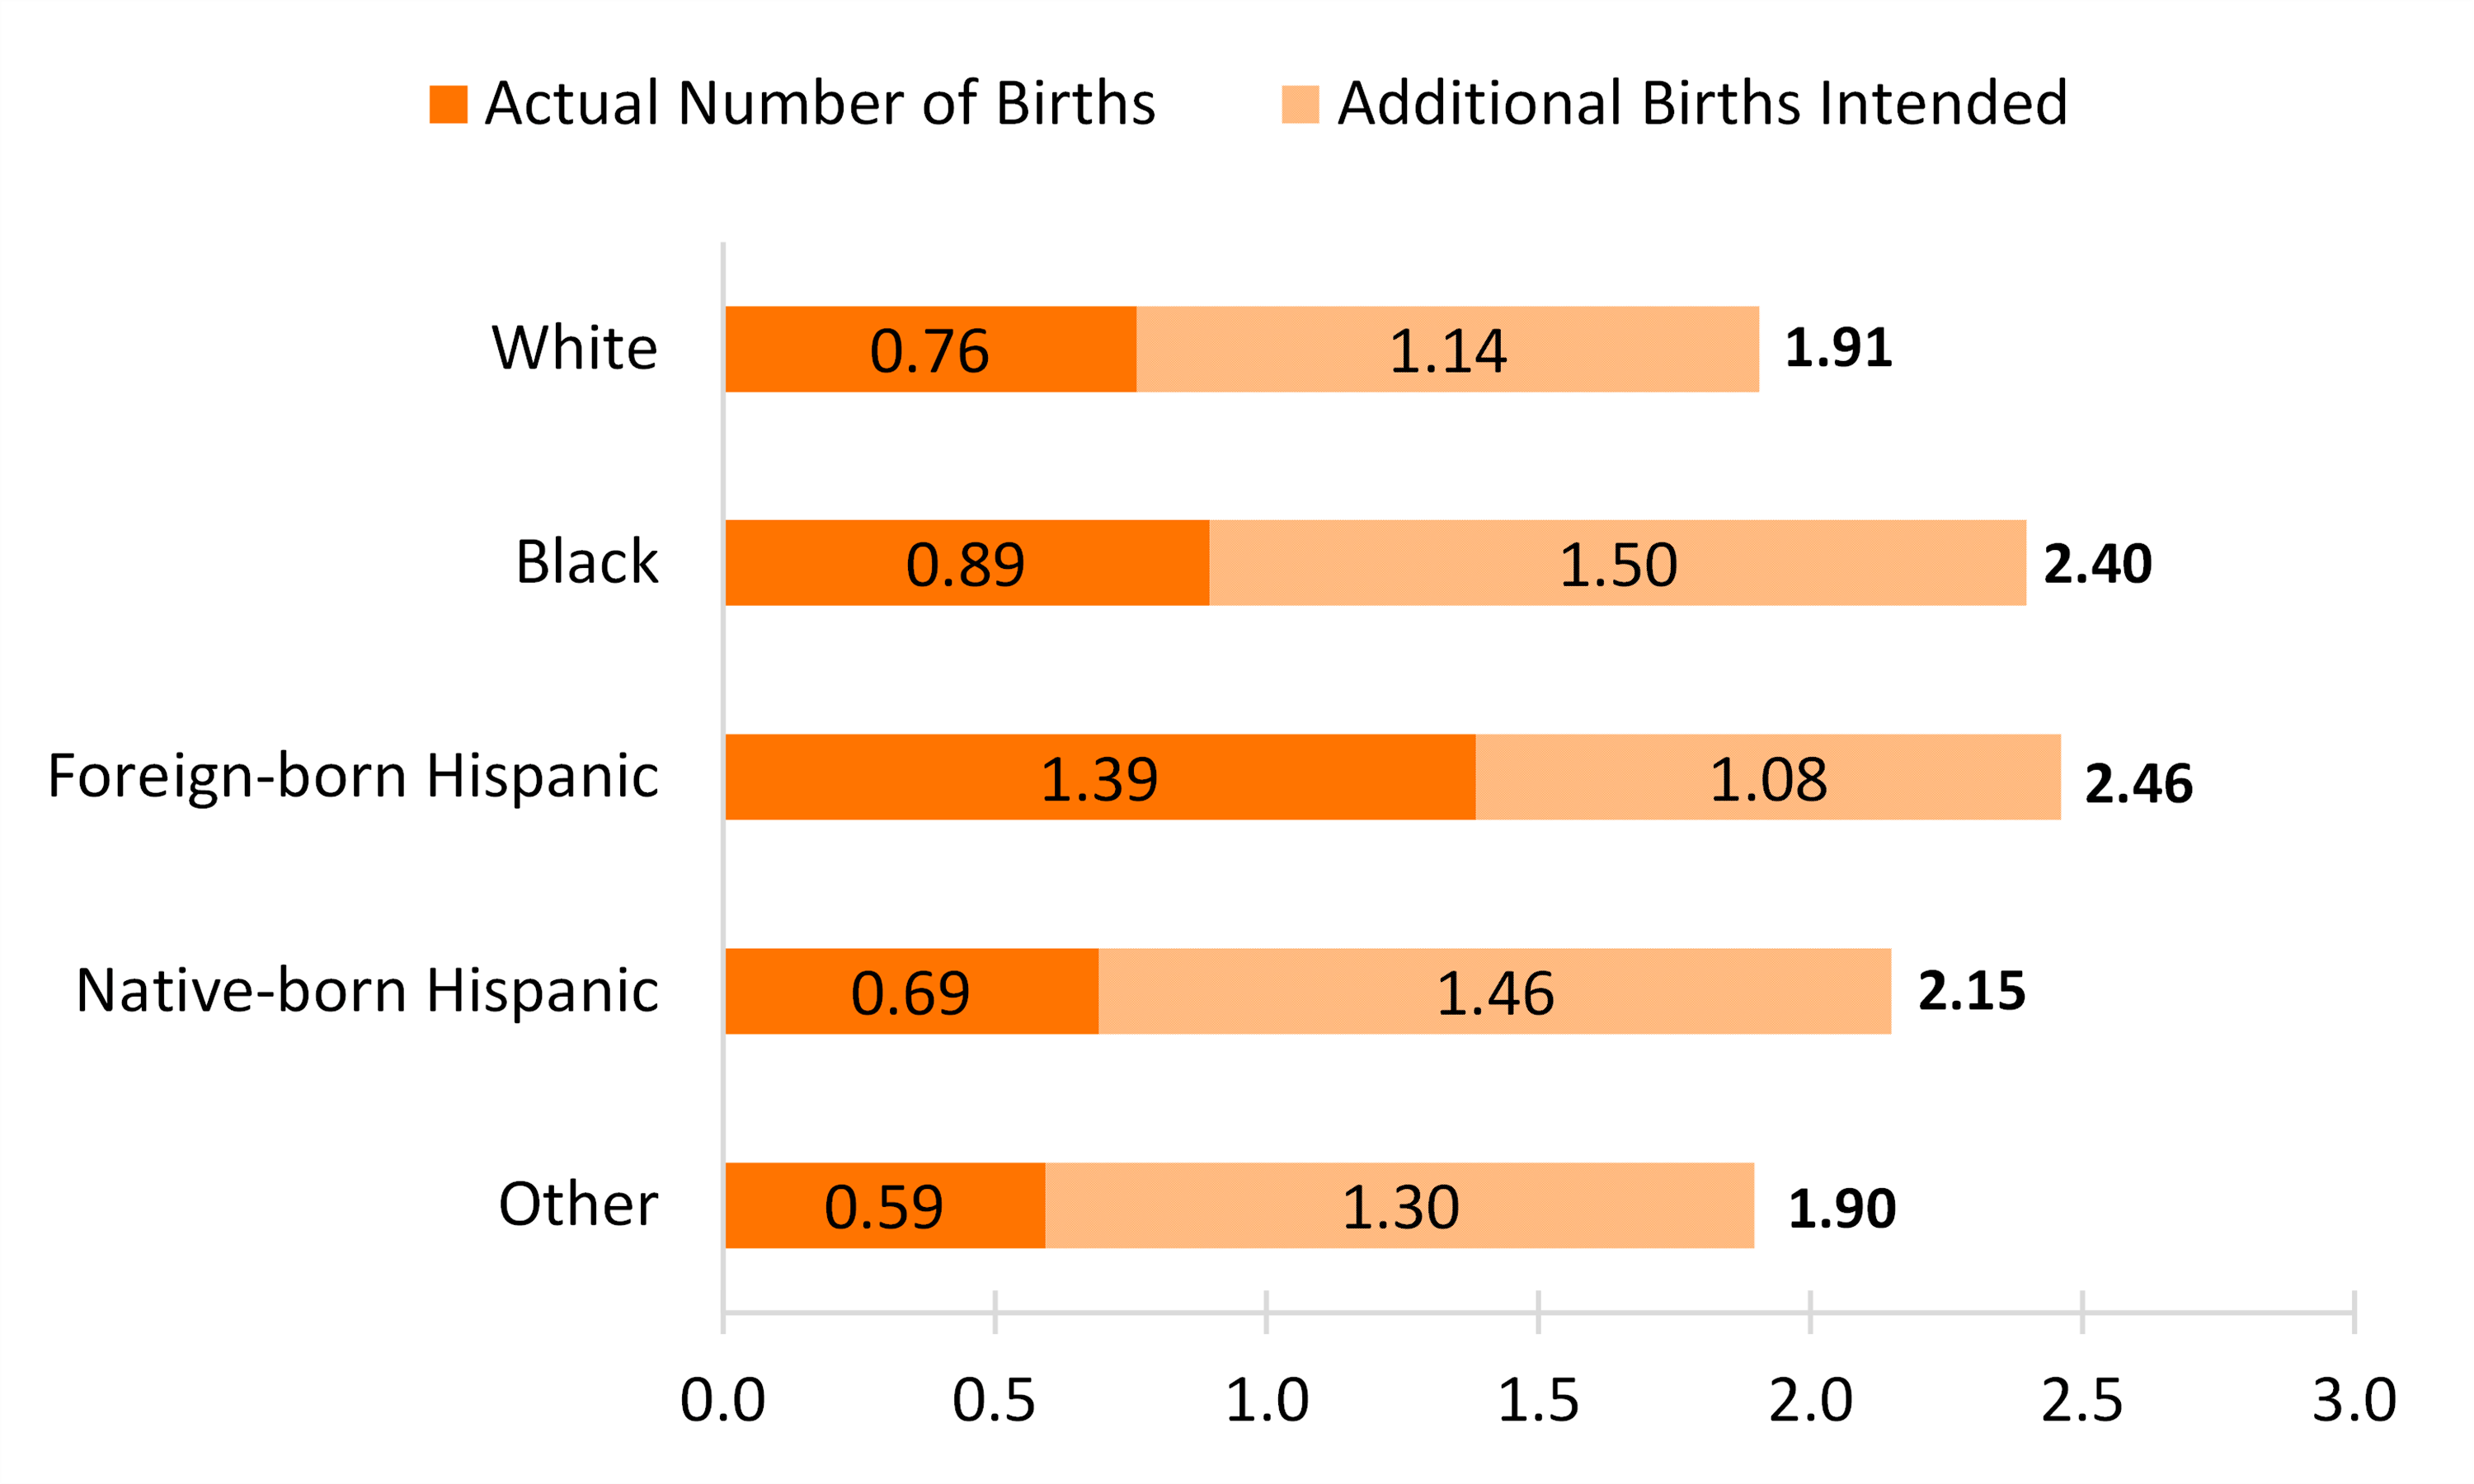
Average actual + intended parity among men varied across race-ethnicity-nativity from 1.90 to 2.46.
- White and Other-race men had the lowest average at 1.91 and 1.90, respectively.
- Native-born Hispanic men had an average actual + intended number of children of 2.15.
- The highest average actual + intended number of children was among Black and foreign-born Hispanic men at 2.40 and 2.46, respectively.
Figure 3. Average Actual + Intended Number of Children Among Men 15-44, by Race-Ethnicity


There is little variation in actual + intended number of children by men’s age. That is not the case across marital status and marital history or race-ethnicity-nativity.

References
- National Center for Health Statistics (NCHS). National Survey of Family Growth Public-Use Data and Documentation. Hyattsville, MD: CDC National Center for Health Statistics. https://www.cdc.gov/nchs/nsfg/index.htm
Suggested Citation
- Guzzo, K. B. (2021). Variation in men’s actual + intended number of children. Family Profiles, FP-21-15. Bowling Green, OH: National Center for Family & Marriage Research. https://doi.org/10.25035/ncfmr/fp-21-15
Updated: 11/07/2025 04:00PM

