Average Age at First Birth, 1970 & 2017
Family Profile No. 25, 2018
Author: Karen B. Guzzo & Krista K. Payne
The age at first birth has increased substantially in the United States over the past few decades (FP-17-22). The geographic context in which women have children varies, in terms of population composition, social norms, marital behaviors, economic and educational opportunities, and access to family planning services. This variation results in differences across states in the average age at which women become mothers. This profile uses data from CDC Wonder and Vital Statistics to document women’s mean age at first birth across the fifty states and Washington, D.C. for the years 1970, 1980, 1990, 2000, 2010, and 2017.
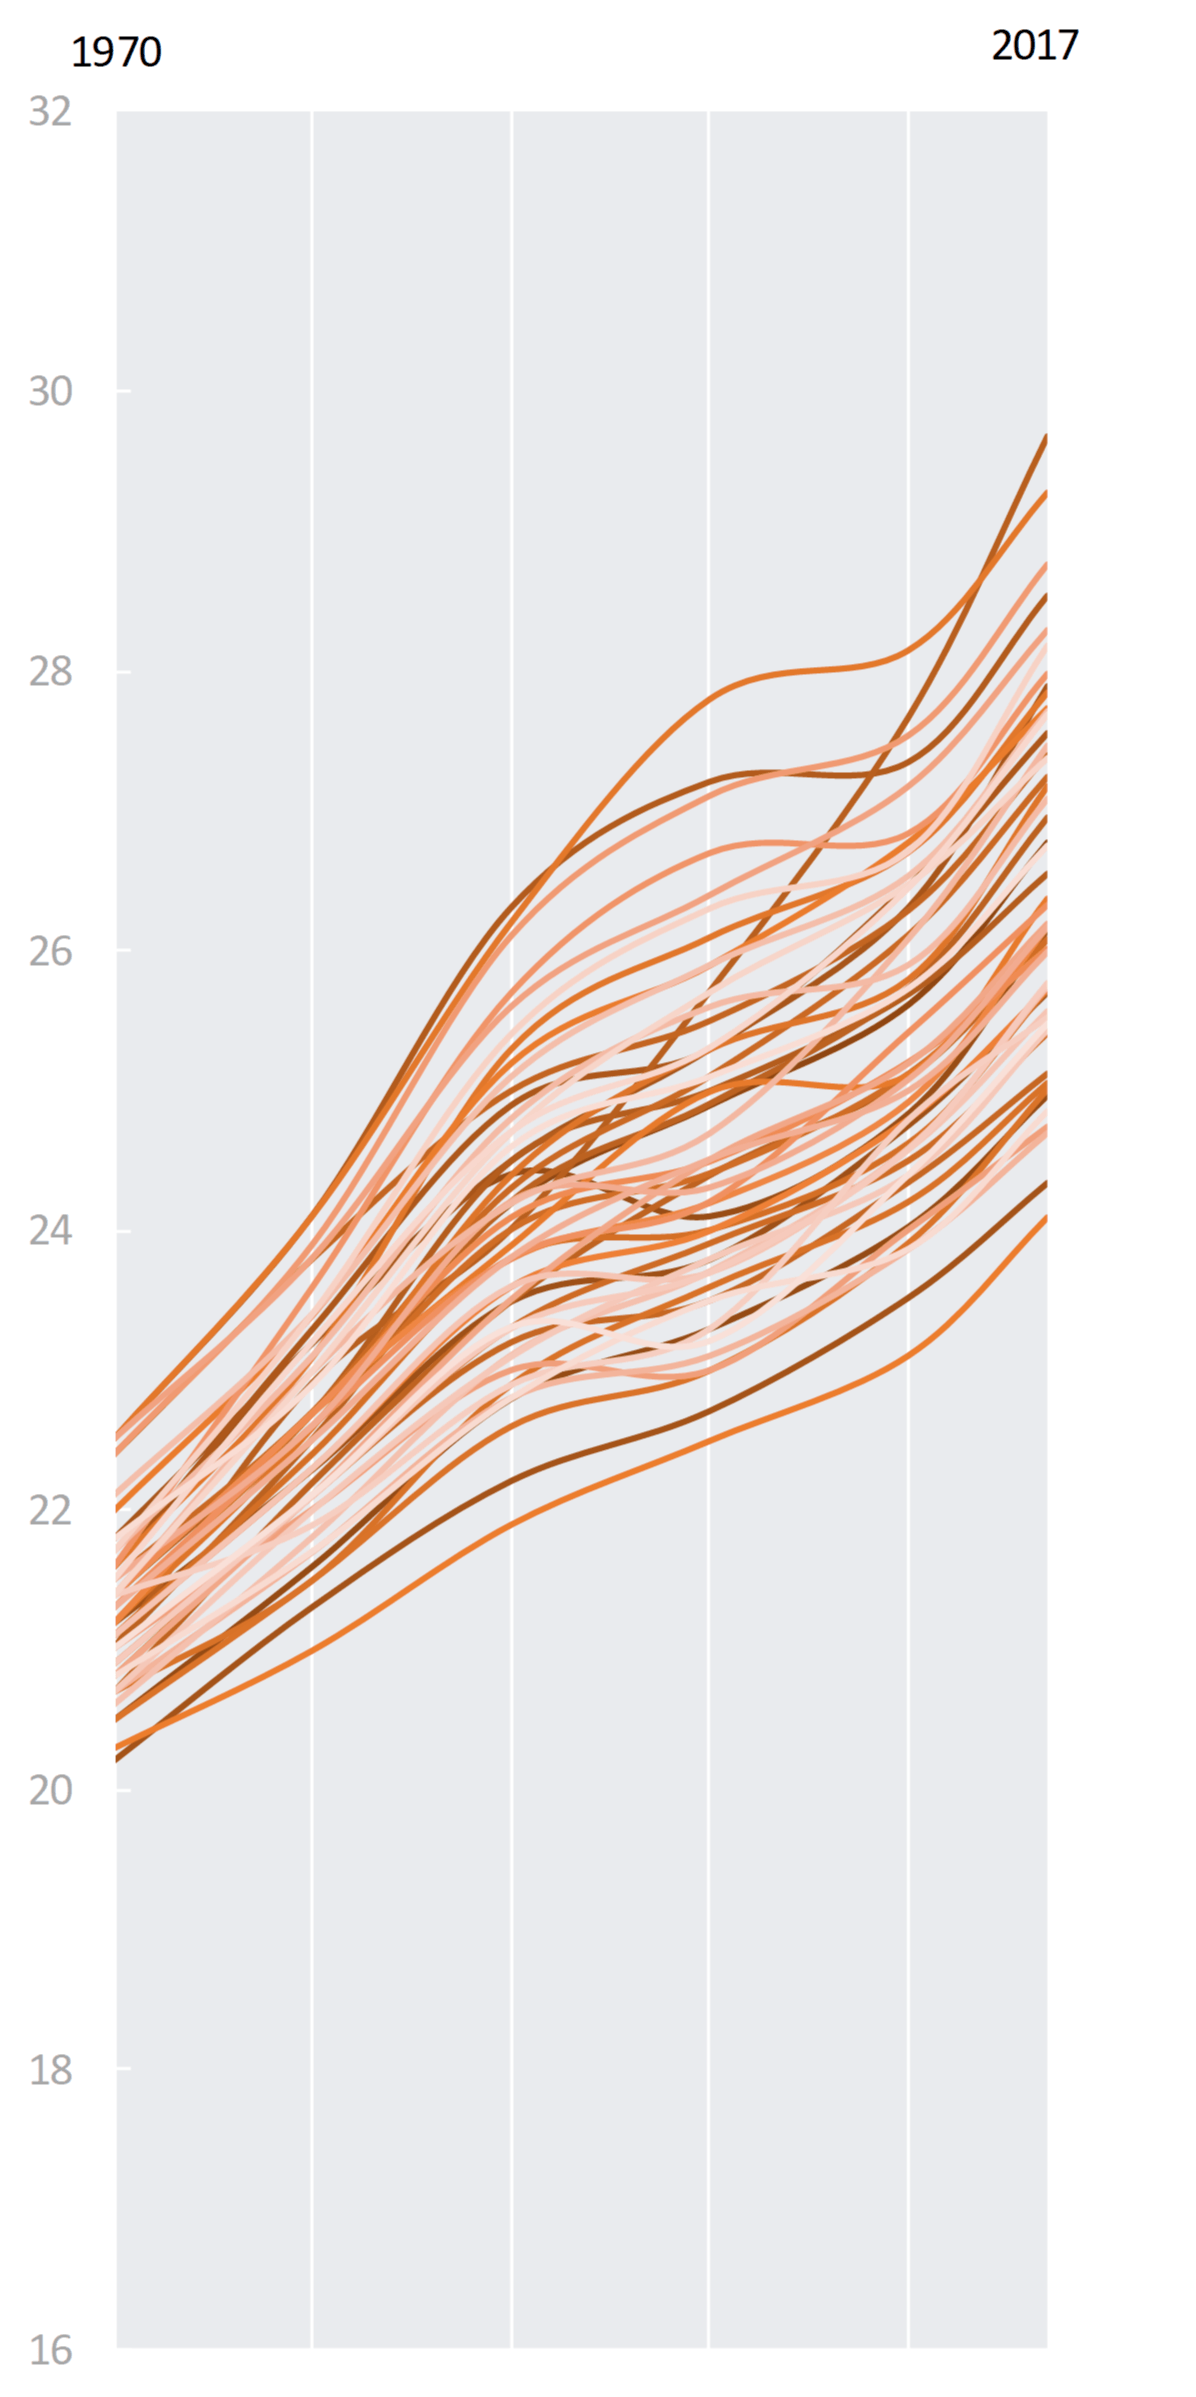
Trends in Mean Maternal Ages of First Births, 1970-2017
For the U.S. overall, the mean age at first birth increased from 21.4 years in 1970 to 26.8 years in 2017, not shown.
- The pace of increase in the mean ages at first birth varied over time.
- Mean ages increased sharply during the 1970s and 1980s.
- The pace of increase slowed during the 1990s and early 2000s.
- The pace began increasing more quickly around the time of the Great Recession (December 2007 - June 2009).
- The gap between states in women’s mean ages at first birth widened between 1970 and 2017.
- In 1970, the gap was 2.3 years between the states with the youngest and oldest mean ages at first birth (20.2 and 22.5, respectively; see below for specific states).
- By 2010, the gap had widened between the youngest (24.1 years) and oldest (29.7 years) mean ages at first birth, reaching 5.6 years.
Figure 1. State-level Trends in Mean Maternal Ages of First Births, 1970-2017

Five Youngest and Oldest Mean Maternal Ages of First Births, 1970 and 2017
- In 1970, Arkansas (20.2 years) and Mississippi (20.3 years) had the youngest mean maternal age at first birth. These two states continued to have the youngest ages in 2017 but had reversed positions, with Mississippi having a younger mean age of first birth than Arkansas (24.1 and 24.3, respectively).
- The three states rounding out the five youngest mean ages changed between 1970 and 2017.
- Connecticut, Massachusetts, and New York tied for the oldest mean age of first birth at 22.5 years in 1970. Four of the five states with the oldest mean ages in 1970 also had the oldest ages in 2017.
- The oldest mean age at first birth occurred in Washington, D.C., at 29.7 years in 2017.
- The oldest mean age at first birth occurred in Washington, D.C., at 29.7 years in 2017.
| 1970 | 2017 | ||||
| 1. | Arkansas | 20.2 |
1. | Mississippi | 24.1 |
| 2. | Mississippi | 20.3 |
2. |
Arkansas |
24.3 |
| 3. | Alabama | 20.5 |
3. |
Oklahoma | 24.7 |
3. |
Louisiana |
20.5 |
4. |
New Mexico |
24.8 |
| 5. | South Carolina |
20.6 |
5. |
West Virginia |
24.9 |
U.S. |
21.4 |
U.S. |
26.8 |
||
47. |
Hawaii |
22.4 |
47. |
New York |
28.3 |
47. |
New Jersey |
22.4 |
48. | Connecticut |
28.5 |
49. |
Connecticut |
22.5 |
48. |
New Jersey |
28.8 |
49. |
Massachusetts |
22.5 |
49. | Massachusetts | 29.3 |
| 49. | New York |
22.5 |
51. |
Washington, D.C. |
29.7 |
Source: NCFMR analyses of NCHS; CDC WONDER
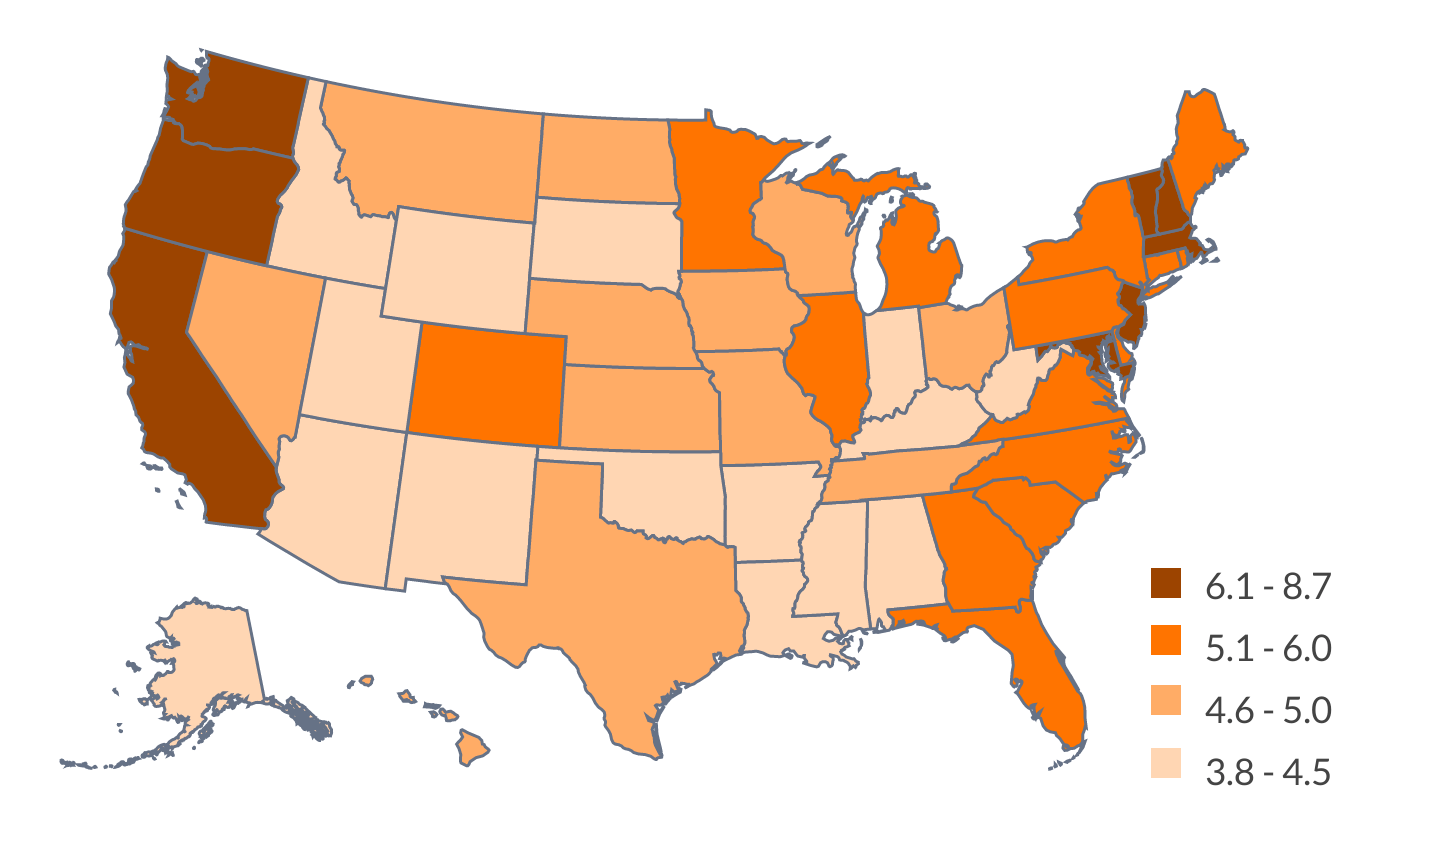
Total Change in Mean Maternal Age of First Births, 1970 and 2017
Although all states experienced an increase in women’s mean age at first birth between 1970 and 2017, the absolute change varied across the states.
- As shown by the darker colors on the map, the largest increases were generally found along the coasts.
- The greatest increase in mean age (8.7 years) was in Washington, D.C. Nine states, including, D.C., exhibited increases of more than six years. These states, were along the West Coast and in the northern part of the East Coast.
- Three states had increases of four years or less.
- New Mexico and Mississippi had the smallest over time, both increasing by about 3.8 years followed by Oklahoma with 4.0 years.
Figure 2: State-level Change in Mean Maternal Ages of First Births, 1970-2017

References
- Eickmeyer, K. J., Payne, K. K., Brown, S. L., & Manning, W. D. (2017). Crossover in the median age at first marriage and first birth: Thirty-Five years of change. Family Profiles, FP-17-22. Bowling Green, OH: National Center for Family & Marriage Research. https://doi.org/10.25035/ncfmr/fp-17-22
- Mathews, T. J. & Hamilton, Brady E. (2002). Mean age of mother, 1970-2000. National Vital Statistics Reports, 51(1). Hyattsville, MD: National Center for Health Statistics.
- United States Department of Health and Human Services (US DHHS), Centers for Disease Control and Prevention (CDC), National Center for Health Statistics (NCHS), Division of Vital Statistics, Natality public-use data 2007-2017, on CDC WONDER Online Database, October 2018. Accessed at http://wonder.cdc.gov/natality-current.html on October 23, 2018 10:19:40 AM
Suggested Citation
- Guzzo, K. B. & Payne, K. K. (2018). Average age at first birth, 1970 - 2017. Family Profiles, FP-18-25. Bowling Green, OH: National Center for Family & Marriage Research. https://doi.org/10.25035/ncfmr/fp-18-25.
Updated: 11/07/2025 03:55PM

