Maternal and Paternal Age: Births to Individuals Aged 40 and Older, 2016-2021
Family Profile No. 21, 2023
Author: Karen Benjamin Guzzo
Although there has been an overall decline in birth rates in the U.S. in recent years, the birth rate of women 40 and older has consistently increased (Hamilton, Martin, and Osterman, 2023). This reflects the shift to a later age at first birth among women (Guzzo and Payne, 2018) as well as shifts in men’s childbearing behaviors to later ages (Khandwala, Zhang, Lu, and Eisenberg, 2017). In this profile, we use vital statistics birth data from CDC Wonder for the years 2016-2021 to consider the contributions of births to men and women 40 and older to the total number of births. We also examine the age distribution of the other parent for women and men 40 and older. Paternal age, which is reported by mothers, is unknown for 11.8% of all births, and we include these births in all calculations.
Contribution of Births to Individuals 40 and Older to Total Births, 2016-2021
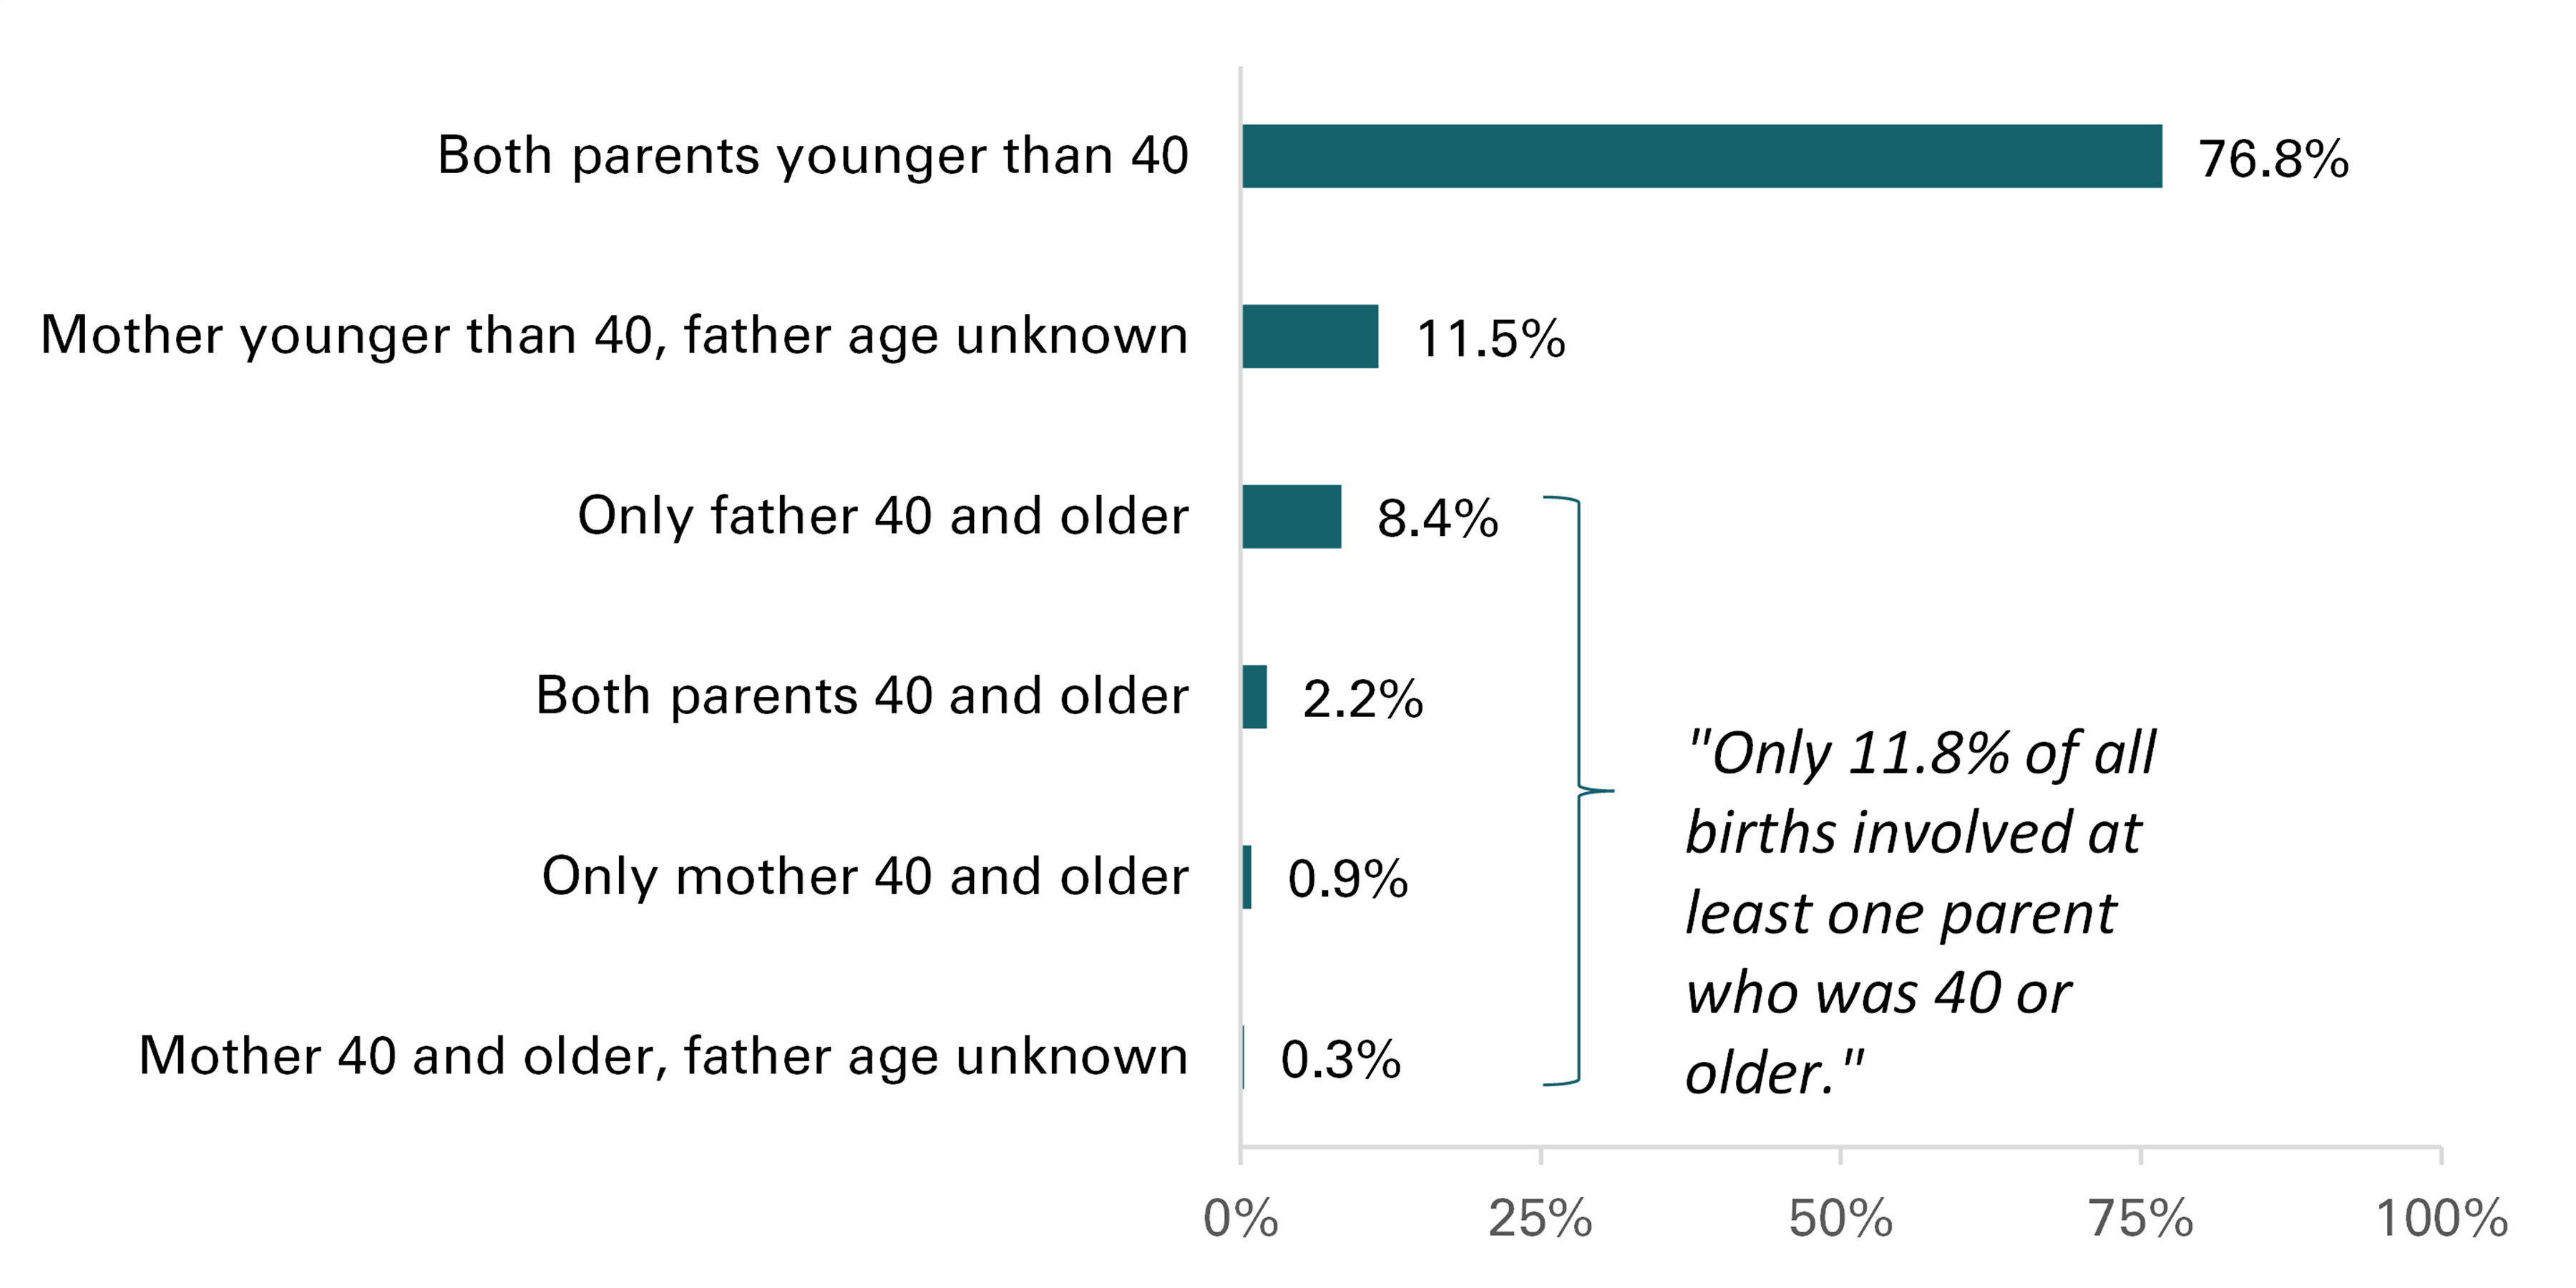
- The majority of births (76.8%) occurring from 2016-2021 were to parents who were both under age 40.
- An additional 11.5% of all births were to women under 40 for which the age of the father was unknown.
- Only 11.8% of all births involved at least one parent who was aged 40 or older.
- Most of these births were births in which the father was aged 40 or older but the mother was not (8.4% of all births).
- Only 2.2% of all births from 2016-2021 involved two parents aged 40 or older.
Figure 1. Share of Births by Parents' Age

Age Distribution of the Other Parent for Births to Individuals Over 40, by Gender
There are stark gender differences in the age of the other parent among births to men and women 40 and older.
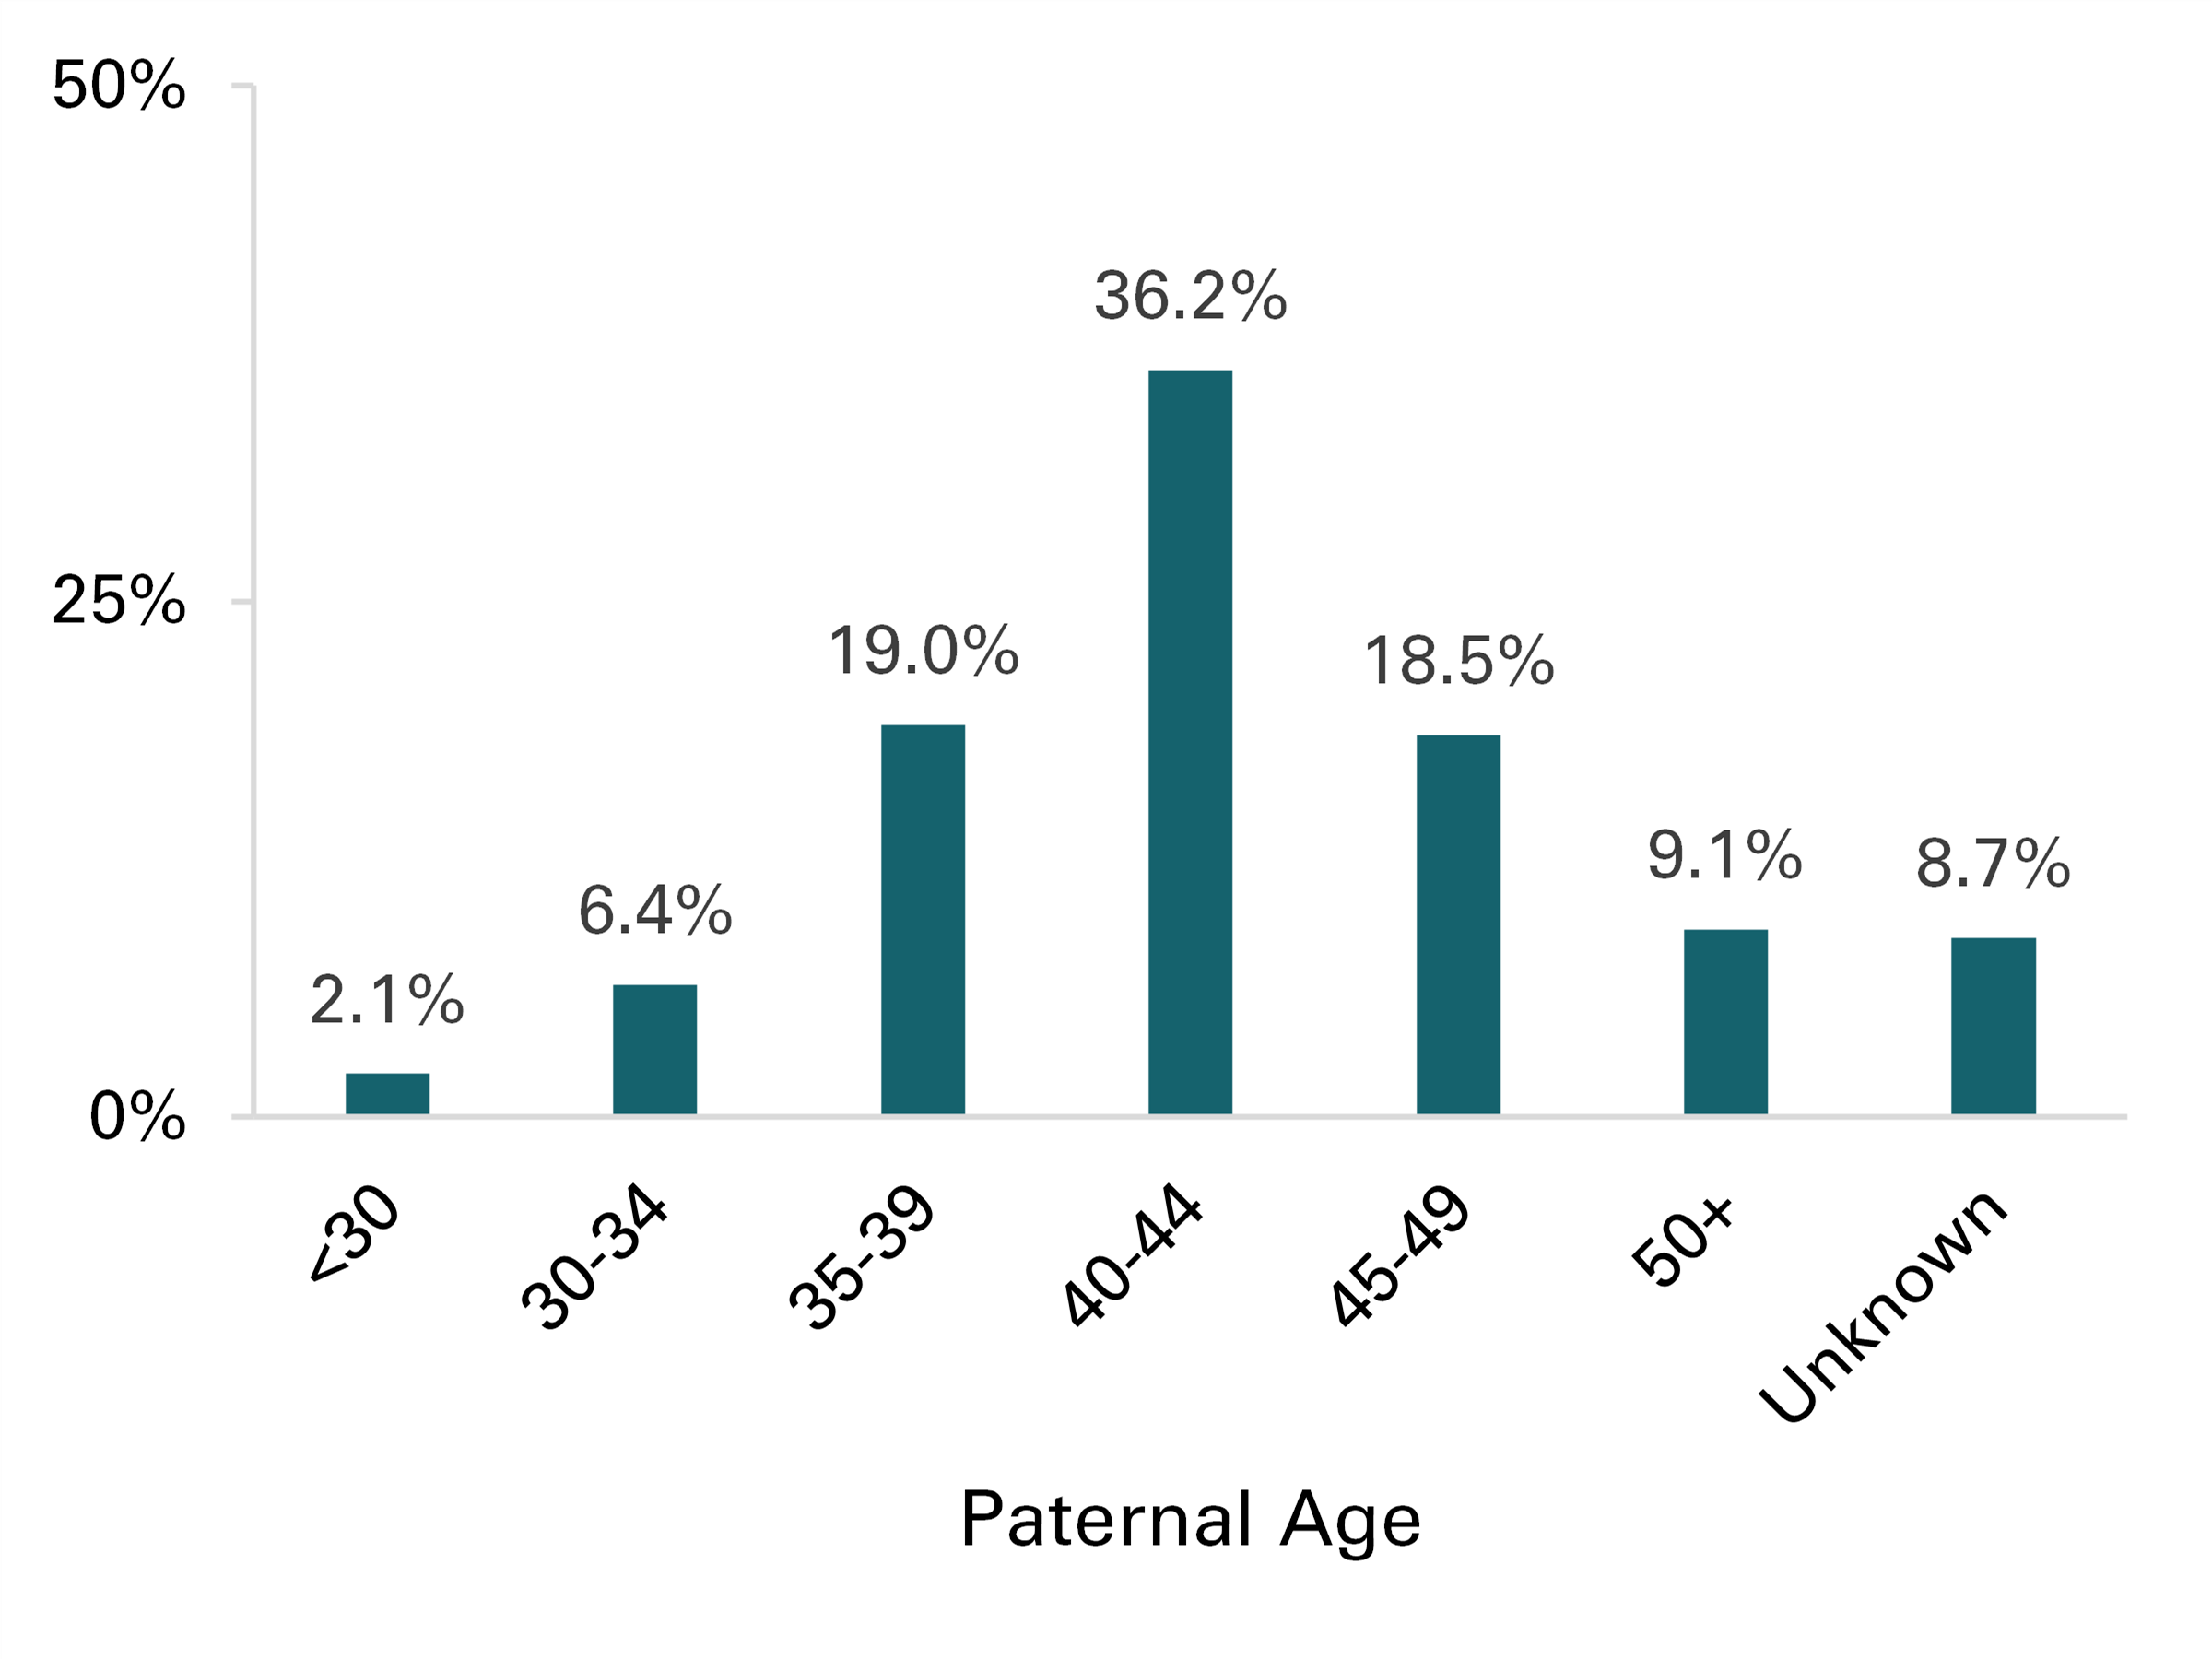
- Among births to women aged 40 and older (Figure 2a), 64% had a fathers’ age of 40 and older.
- The most common paternal age for births to women aged 40 and older was age 40-44 (36.2%).
- Similar shares of births to women aged 40 and older had a paternal age of 50 or higher (9.1%) or an unknown paternal age (8.7%)
- Very few of these births involved a father under age 30 (2.1%).
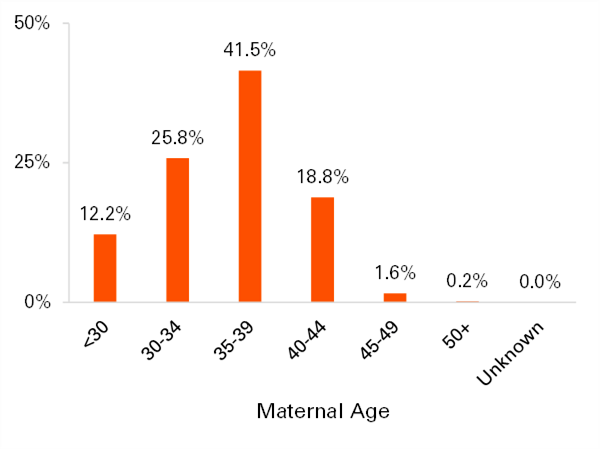
- Unlike births to women aged 40 and older, only one fifth (20.6%) of births to fathers aged 40 and older (Figure 2b) had a mother who was also 40 and older.
- More than four-in-ten (41.5%) births to fathers aged 40 and older involved a birth to women 35-39.
- A quarter (25.8%) of births to fathers aged 40 and older were to a mother 30-34, with 12.2% including a mother under 30.
Figure 2a. Among Births to Women Aged 40 and Older

Figure 2b. Among Births to Men Aged 40 and Older

Data Source:
Centers for Disease Control and Prevention, National Center for Health Statistics. National Vital Statistics System, Natality on CDC WONDER Online Database. Data are from the Natality Records 2016-2021, as compiled from data provided by the 57 vital statistics jurisdictions through the Vital Statistics Cooperative Program. Accessed at http://wonder.cdc.gov/natality-expanded-current.html on Jun 21, 2023, 4:23:30 PM
References:
Guzzo, K. B. & Payne, K. K. (2018). Average age at first birth, 1970 - 2017. Family Profiles, FP-18-25. Bowling Green, OH: National Center for Family & Marriage Research. https://doi.org/10.25035/ncfmr/fp-18-25.
Hamilton, B.E., Martin, J.A., & Osterman, M. J. K. (2023). Births: Provisional data for 2022. National Vital Rapid Release, 28. Hyattsville, MD: National Center for Health Statistics. https://www.cdc.gov/nchs/data/vsrr/vsrr028.pdf
Khandwala, Y. S., Zhang, C. A., Lu, Y., & Eisenberg, M. L. (2017). The age of fathers in the USA is rising: An analysis of 168 867 480 births from 1972 to 2015. Human Reproduction, 32(10), 2110-2116. https://academic.oup.com/humrep/article/32/10/2110/4096427
Suggested Citation:
Guzzo, K. B. (2023). Maternal and paternal age of births to individuals 40 and older, 2016-2021. Family Profiles, FP-23-21. National Center for Family & Marriage Research. https://doi.org/10.25035/ncfmr/fp-23-21
Updated: 11/07/2025 03:54PM

