Recent Changes in Men’s Childbearing Goals
Family Profile No. 14, 2021
Author: Karen Benjamin Guzzo
Recent declines in U.S. birth rates raise questions about future population trends. Childbearing goals play an important role in understanding fertility levels, but most research focuses on women’s desires and plans, to the exclusion of men. In this profile, we analyze the childbearing goals of men aged 15-44 using four cycles of the National Survey of Family Growth (NSFG): 2002, 2006-2010 (representing 2008 when weighted), 2011-15 (representing 2013 when weighted), and 2015-2019 (representing 2017 when weighted). We consider (1) intentions to have any children in the future, (2) average actual + intended number of children (the number of children men already have plus the number they intend to have in the future), and among those who intend to have children, (3) the expected timing of their (next) birth (for 2013 and 2017 only due to data limitations). We show estimates for all men as well as estimates disaggregated by fatherhood status.
Intentions to Have Any Children
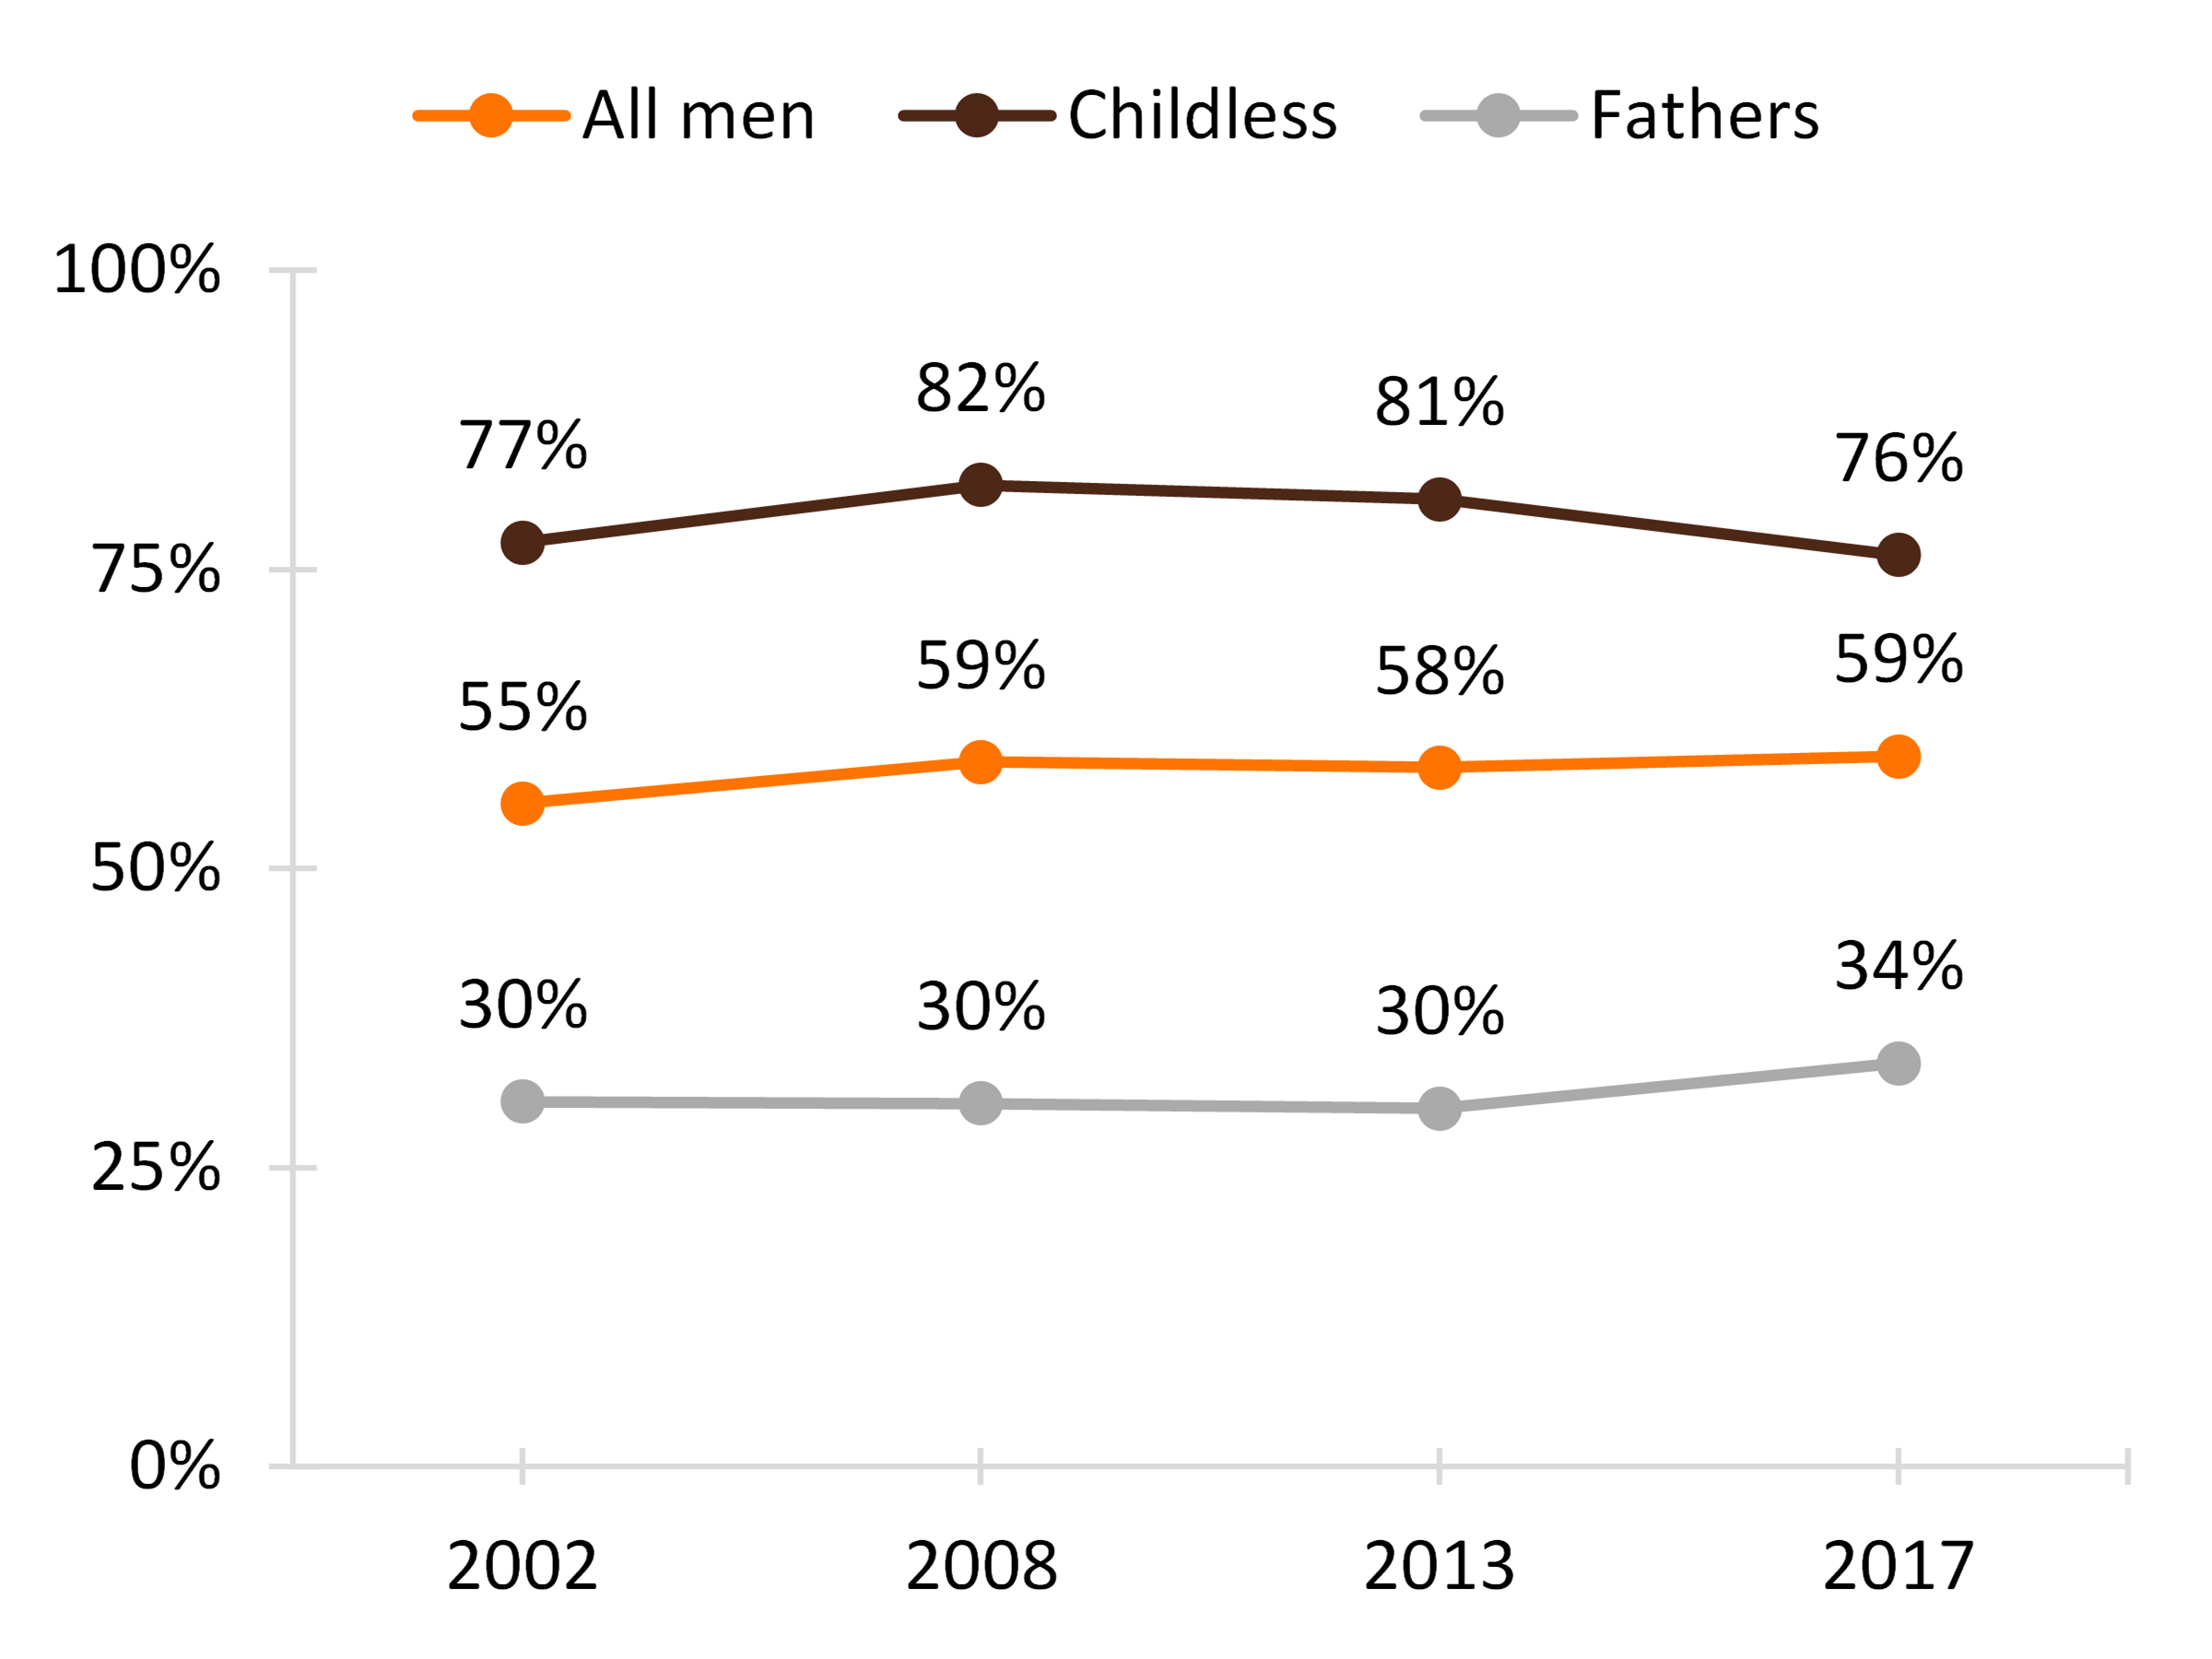
Across all four time periods, about six in ten men aged 15-44 intended to have at least one child in the future.
- Compared to fathers, a larger share of childless men intended to have a child.
- The share of fathers who intended to have a child was stable at 30% from 2002 to 2013, increasing to 34% in 2017.
- Most childless men reported intentions to have a child. In 2002, 77% intended to have a child, rising above 80% in 2008 and 2013 before declining to 76% in 2017.
Figure 1. Trend in Share of Men 15-44 Intending to Have Any Children, by Fatherhood Status

Average Actual + Intended Number of Children
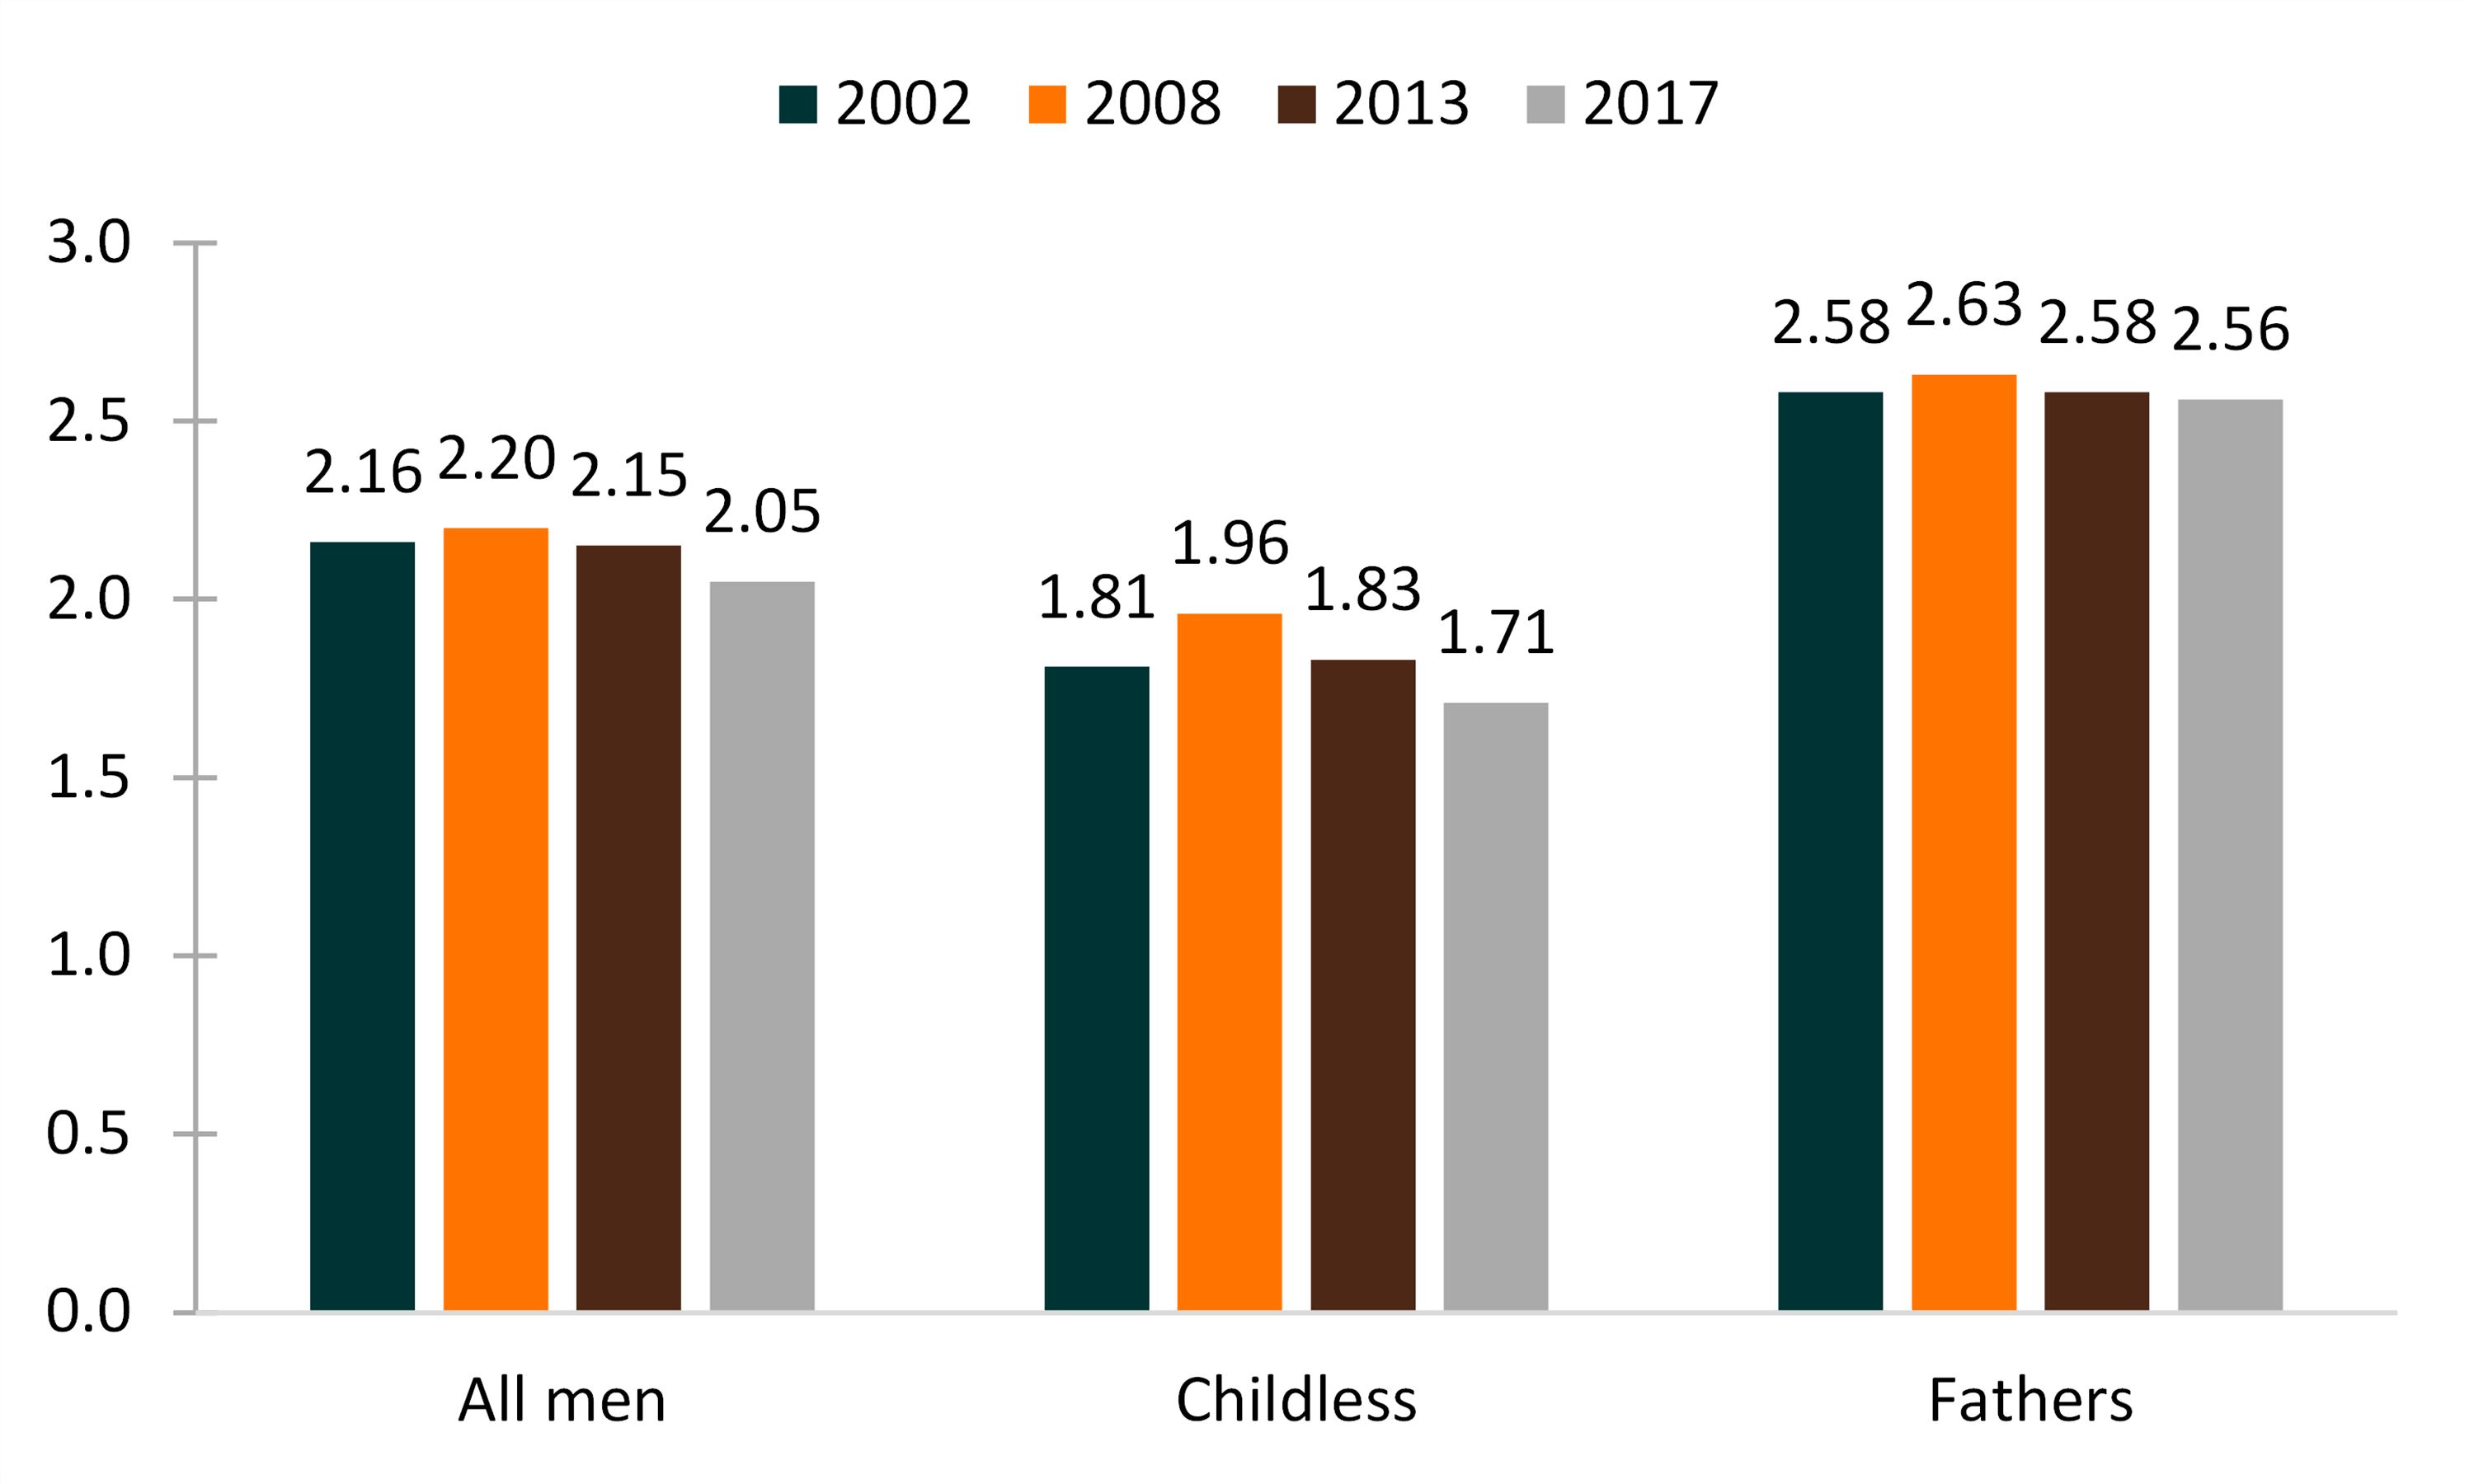
Among all men aged 15-44, the average number of children they already had at the time of the survey plus the number of children they intended to have was steadily above 2.0 throughout the time periods.
- The average actual + intended number of children for all men was highest in 2008, at 2.20, and then fell to 2.15 in 2013 and to 2.05 in 2017.
- Declines over time in the average actual + intended number of children were larger for childless men than fathers.
- Among childless men, the average + intended number of children was consistently below 2.0 from 2002 to 2017. It peaked in 2008 at 1.96 and reached a low of 1.71 in 2017.
- The average actual + intended number of children was always higher among men who were fathers than among childless men, with the average fluctuating between 2.56 and 2.63.
Figure 2. Changes in Average Actual + Intended Number of Children Among Men 15-44, by Fatherhood Status


Expected Timeframe for Having the (Next) Birth
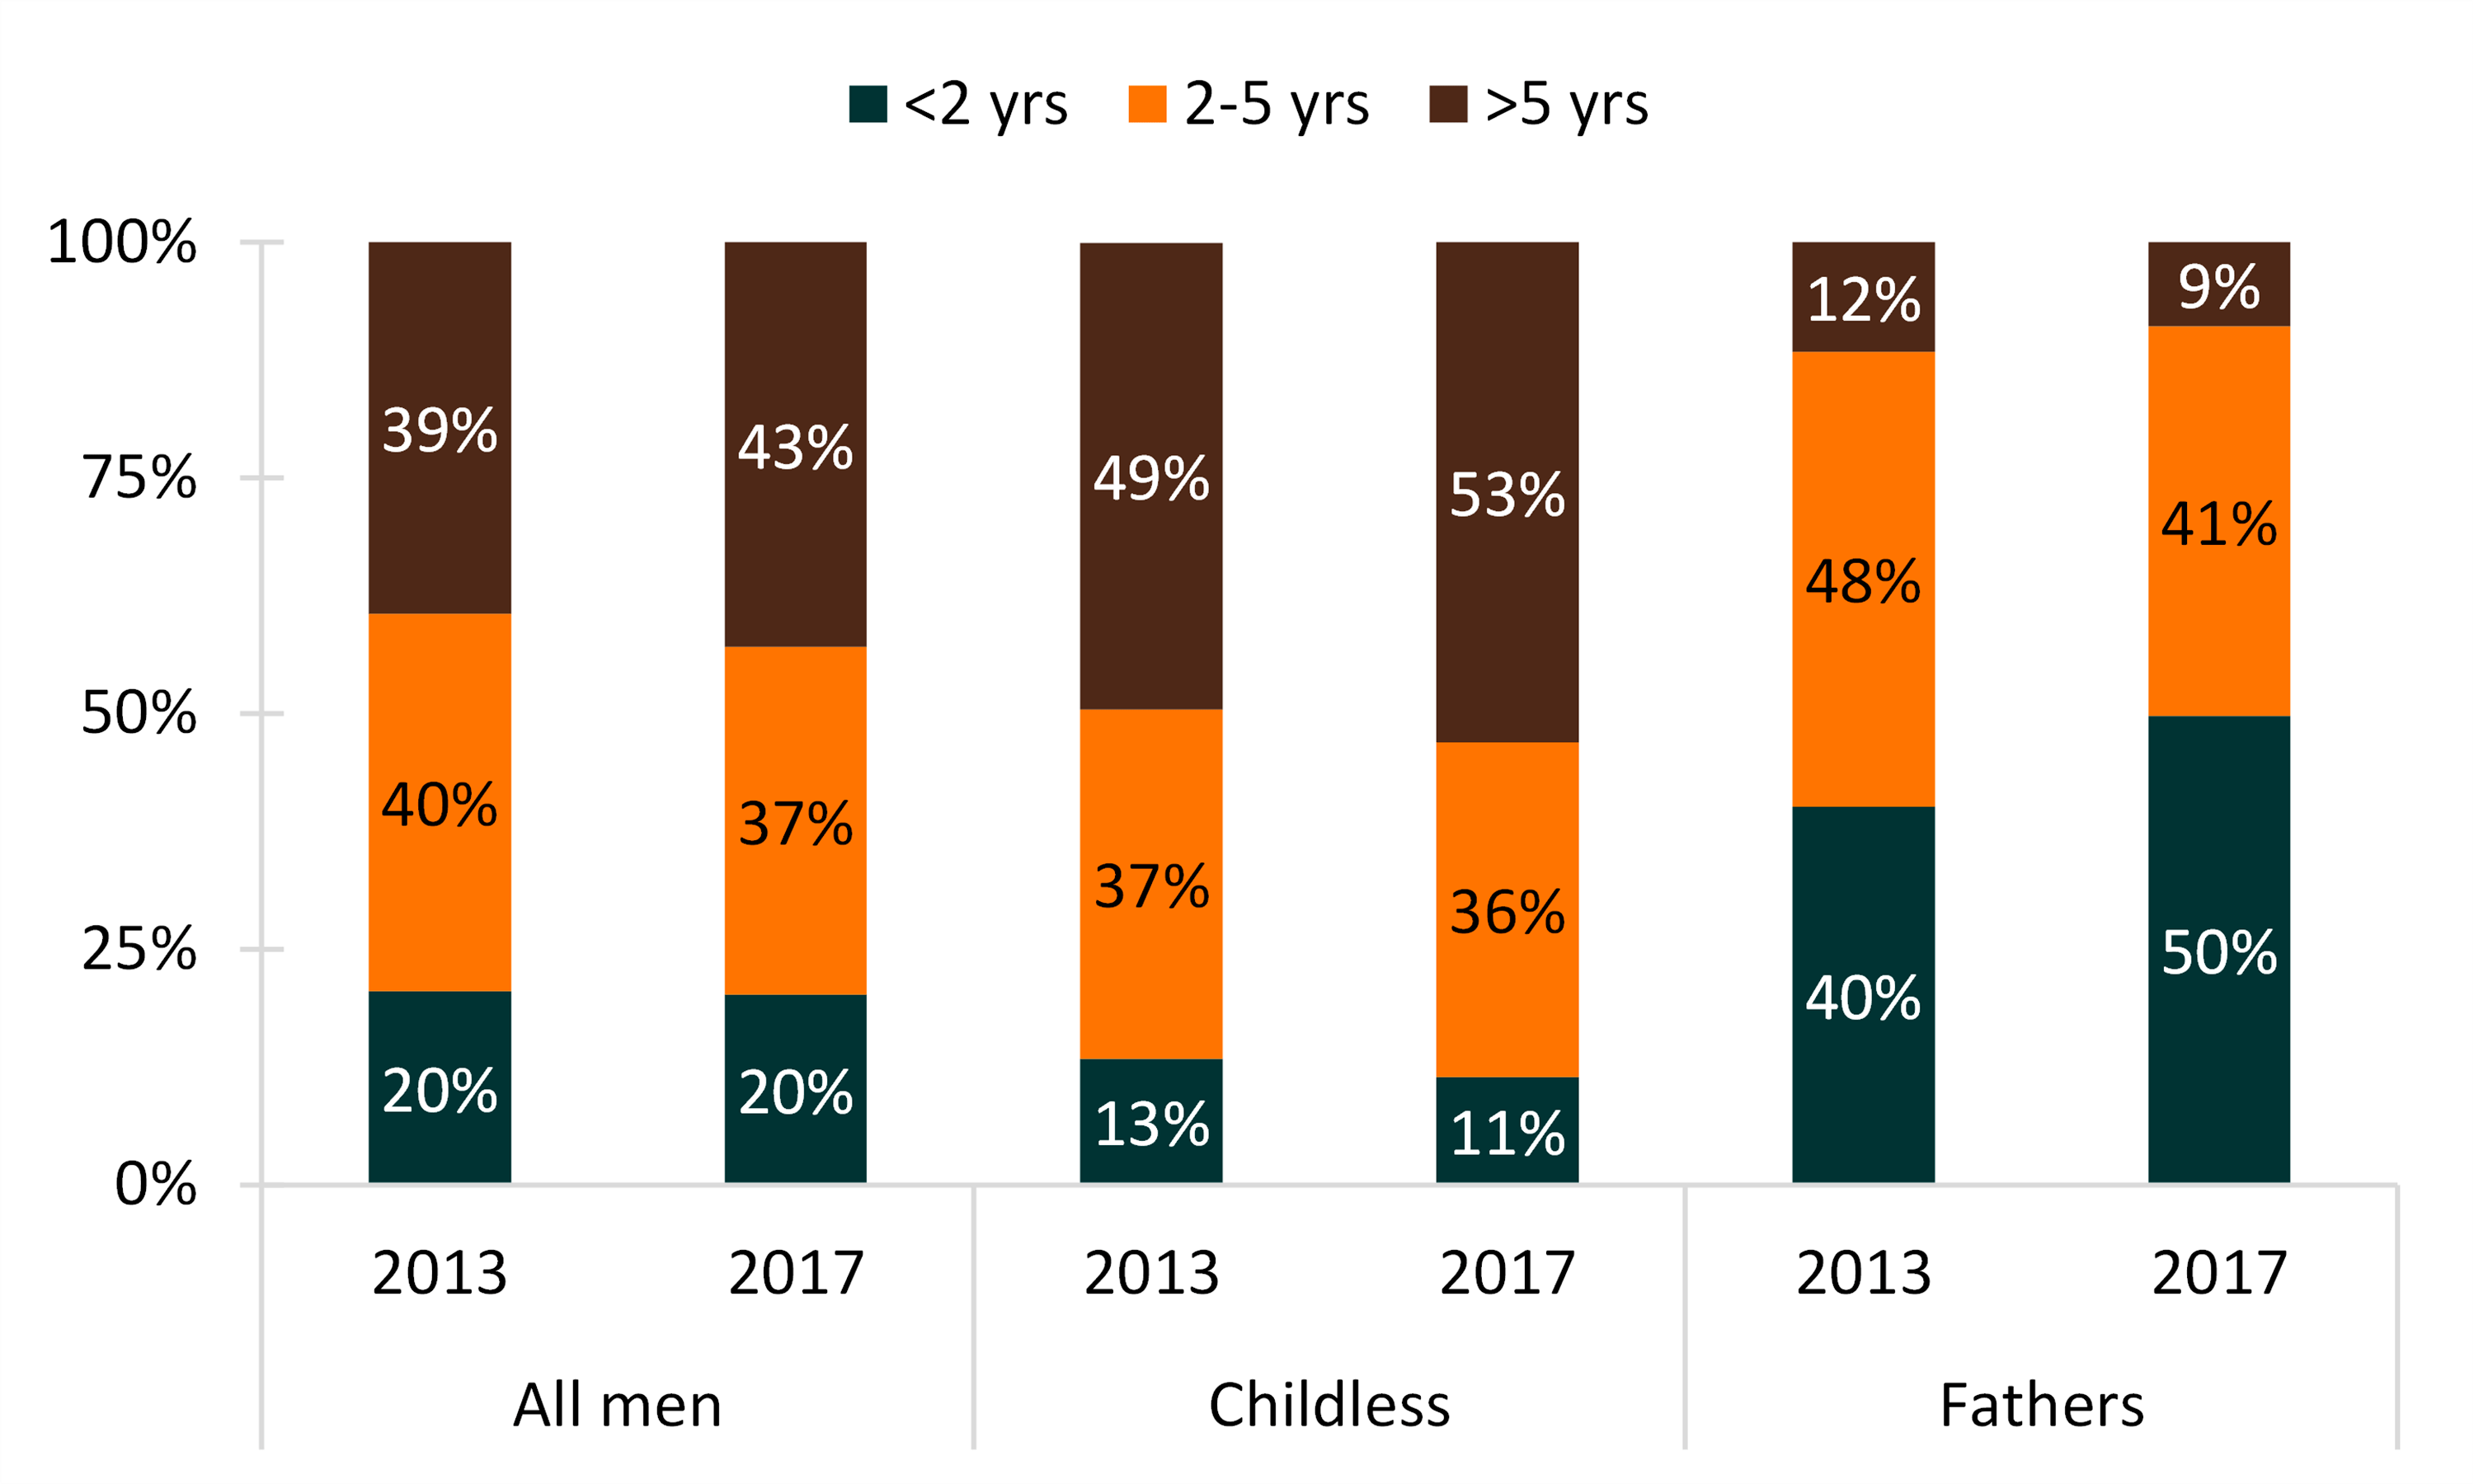
Among those who intended to have a child in the future, only one in five men overall expected to do so within the next two years. Between 2013 and 2017, the share who expected to have a birth more than five years from the survey increased from 39% to 43%.
- Far fewer childless men intended to have a child in the short-term compared to fathers.
- For childless men who intended to have at least one child, the most common response was to expect to have their first child more than five years in the future, rising from 49% to 53% from 2013 to 2017.
- Conversely, fathers rarely expected to wait more than five years to have their next birth (12% in 2013 and 9% in 2017). The share who expected to have a child within in two years rose from 40% in 2013 to 50% in 2017.
Figure 3. Timing of Next Birth Among Men 15-44 Intending to Have a Birth, by
Fatherhood Status

Data Source
- National Center for Health Statistics (NCHS). National Survey of Family Growth Public-Use Data and Documentation. Hyattsville, MD: CDC National Center for Health Statistics. https://www.cdc.gov/nchs/nsfg/index.htm
Suggested Citation
- Guzzo, K. B. (2021). Recent changes in men’s childbearing goals. Family Profiles, FP-21-14. Bowling Green, OH: National Center for Family & Marriage Research. https://doi.org/10.25035/ncfmr/fp-21-14
Updated: 11/07/2025 03:53PM


