Marriage in the U.S.: Twenty-five Years of Change, 1995-2020
Family Profile No. 29, 2020
Author: Lisa Carlson
The marriage rate in the U.S. has fallen over the last 25 years, while the rate of premarital cohabitation has increased (Cherlin 2020; FP-17-05). In 1995, the marriage rate was about 45 per 1,000 women, falling to about 31 per 1,000 women by 2020 (FP-20-21). Using data from the 1995 and 2020 Current Population Survey, this family profile investigates 25 years of change in marriage among women aged 18-49. Updating FP-15-17, the profile also examines variation in the share of women ever married by age, race/ethnicity, and educational attainment.
Age Variation
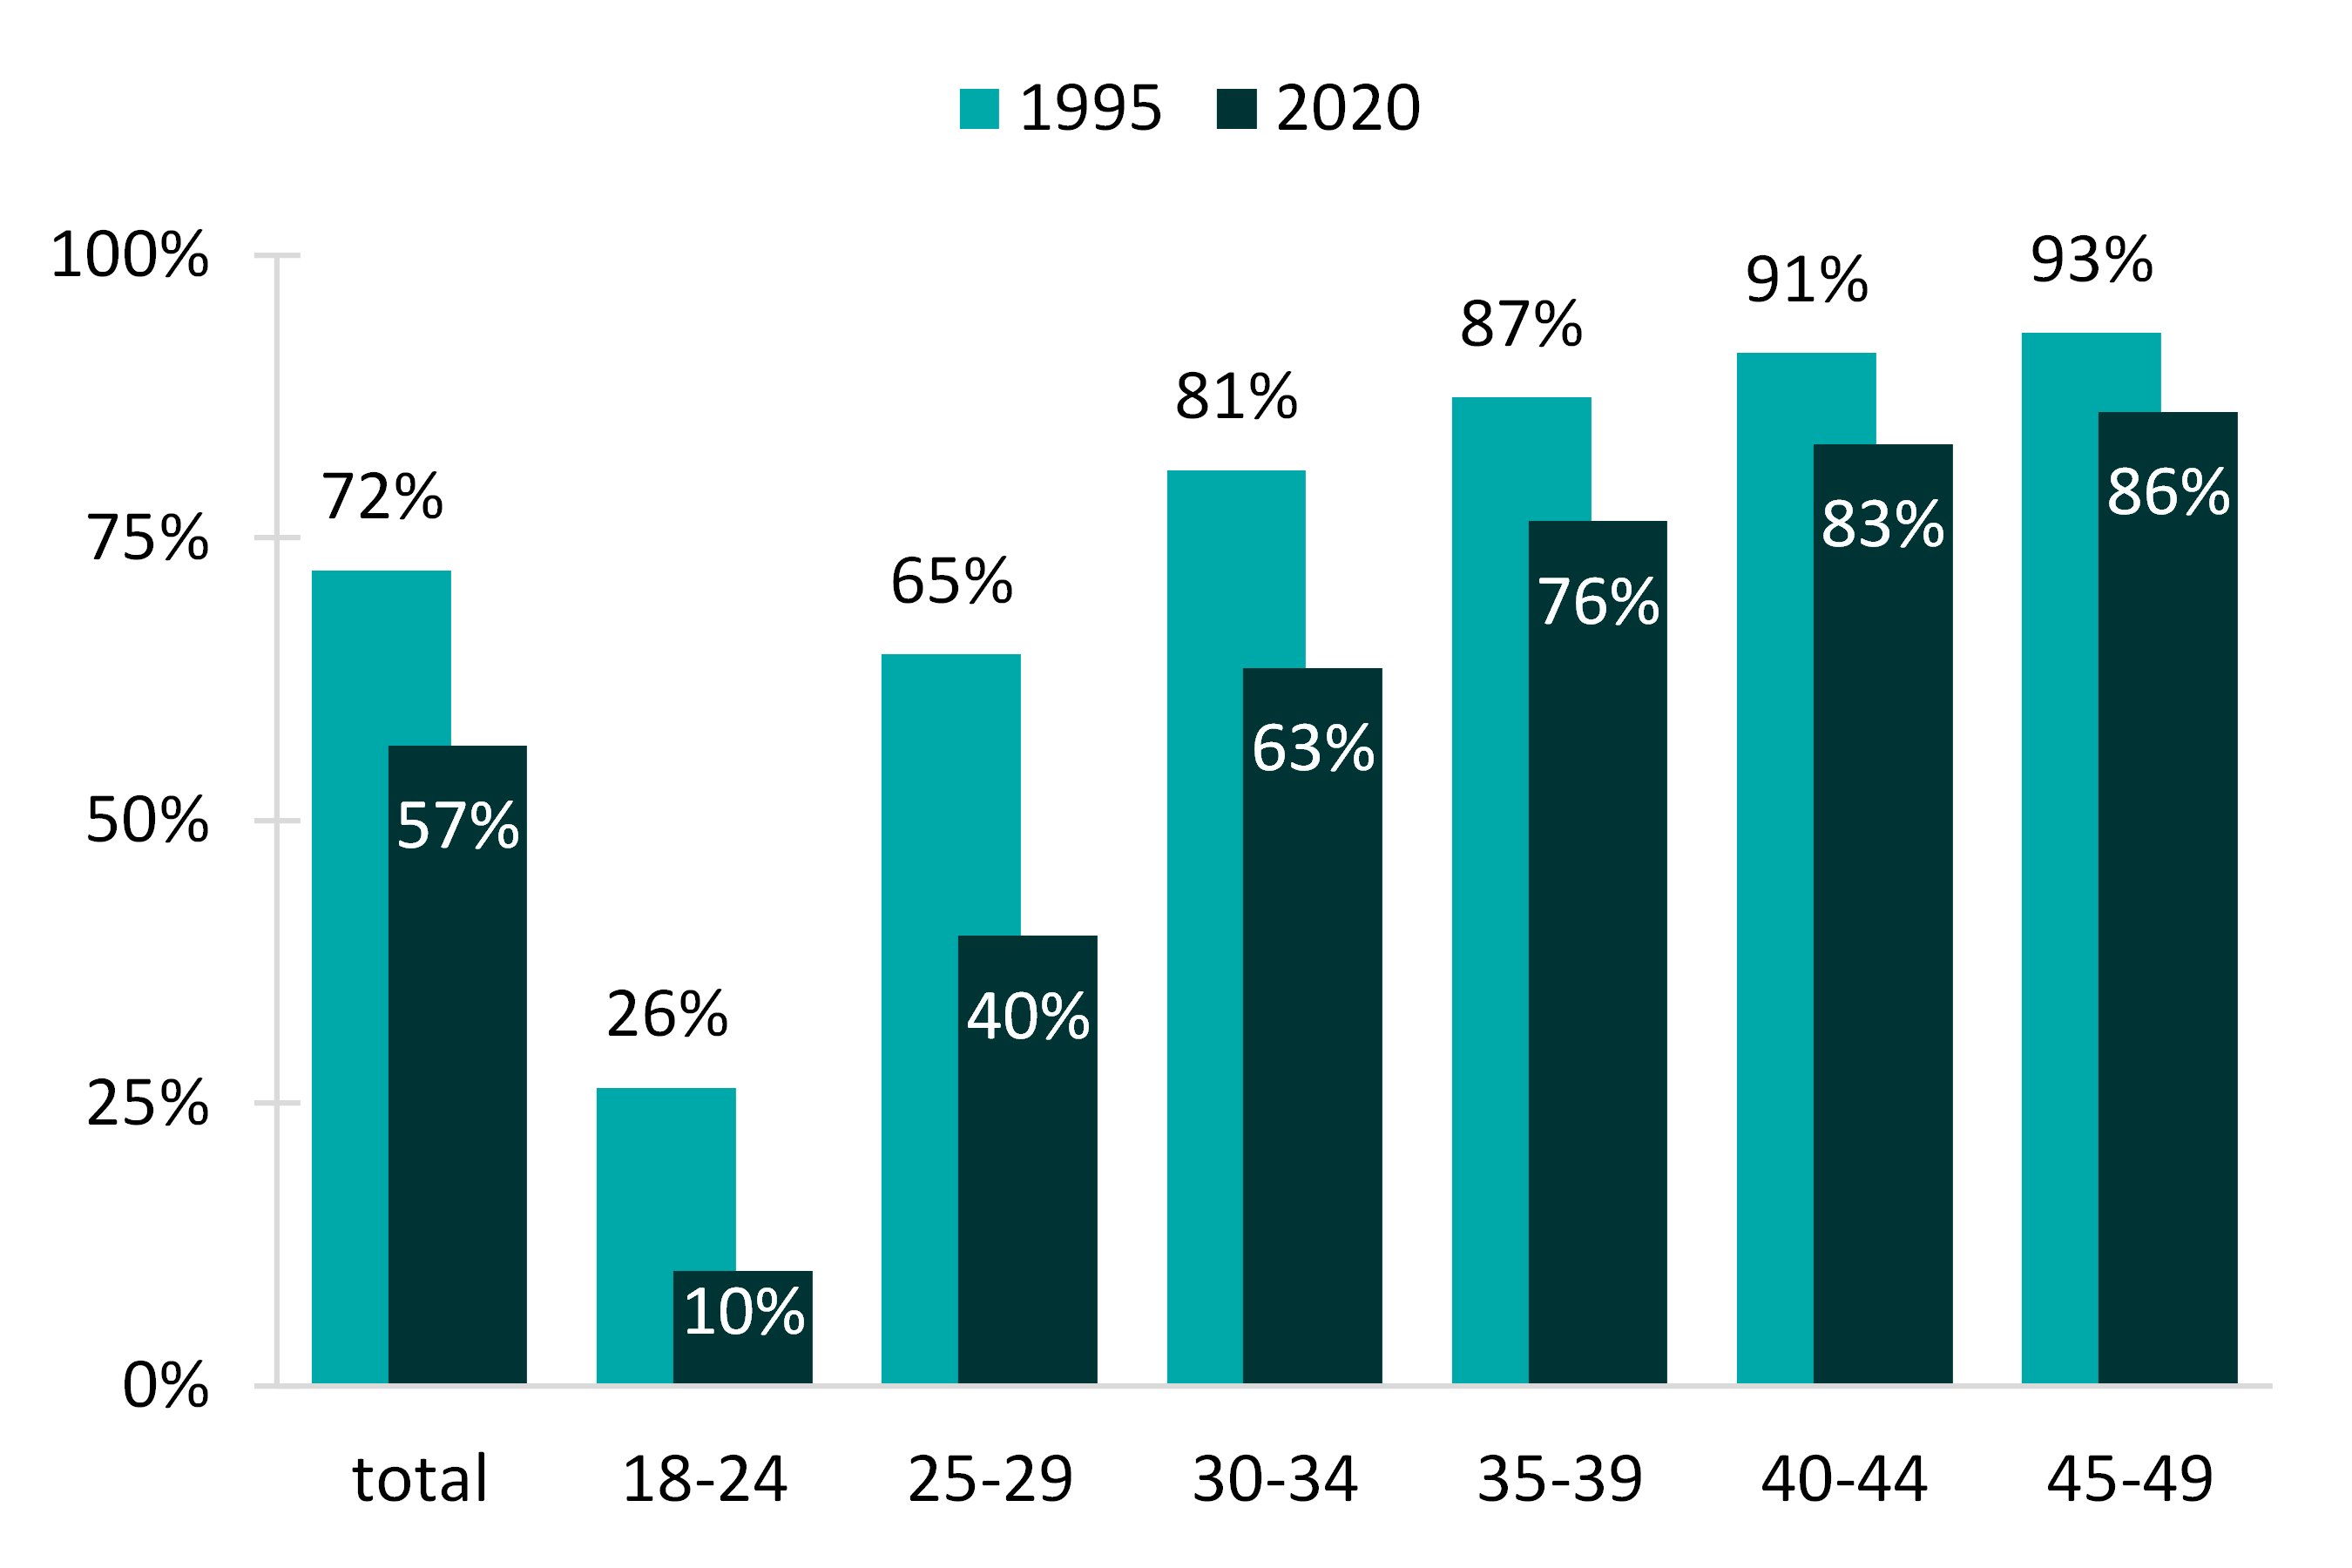
- Between 1995 and 2020, the share of women ever married decreased by 15 percentage points (from 72% to 57%).
- The proportion of women between 18-49 who ever married decreased for all age groups.
- The relative size of the decrease between 1995 and 2020 was largest for women aged 18-24 and smallest for women aged 45-49.
- For women aged 18-24, the proportion of women ever married was about 60% smaller in 2020 compared with 1995 (26%to 10%, respectively).
- For women aged 45-49, the share of women ever married decreased by 7 percentage points between 1995 and 2020 (about 8% smaller).
Figure 1. Twenty-five Years of Change in the Share of Women (18-49) Who Ever Married by Age at Interview

Race/Ethnicity
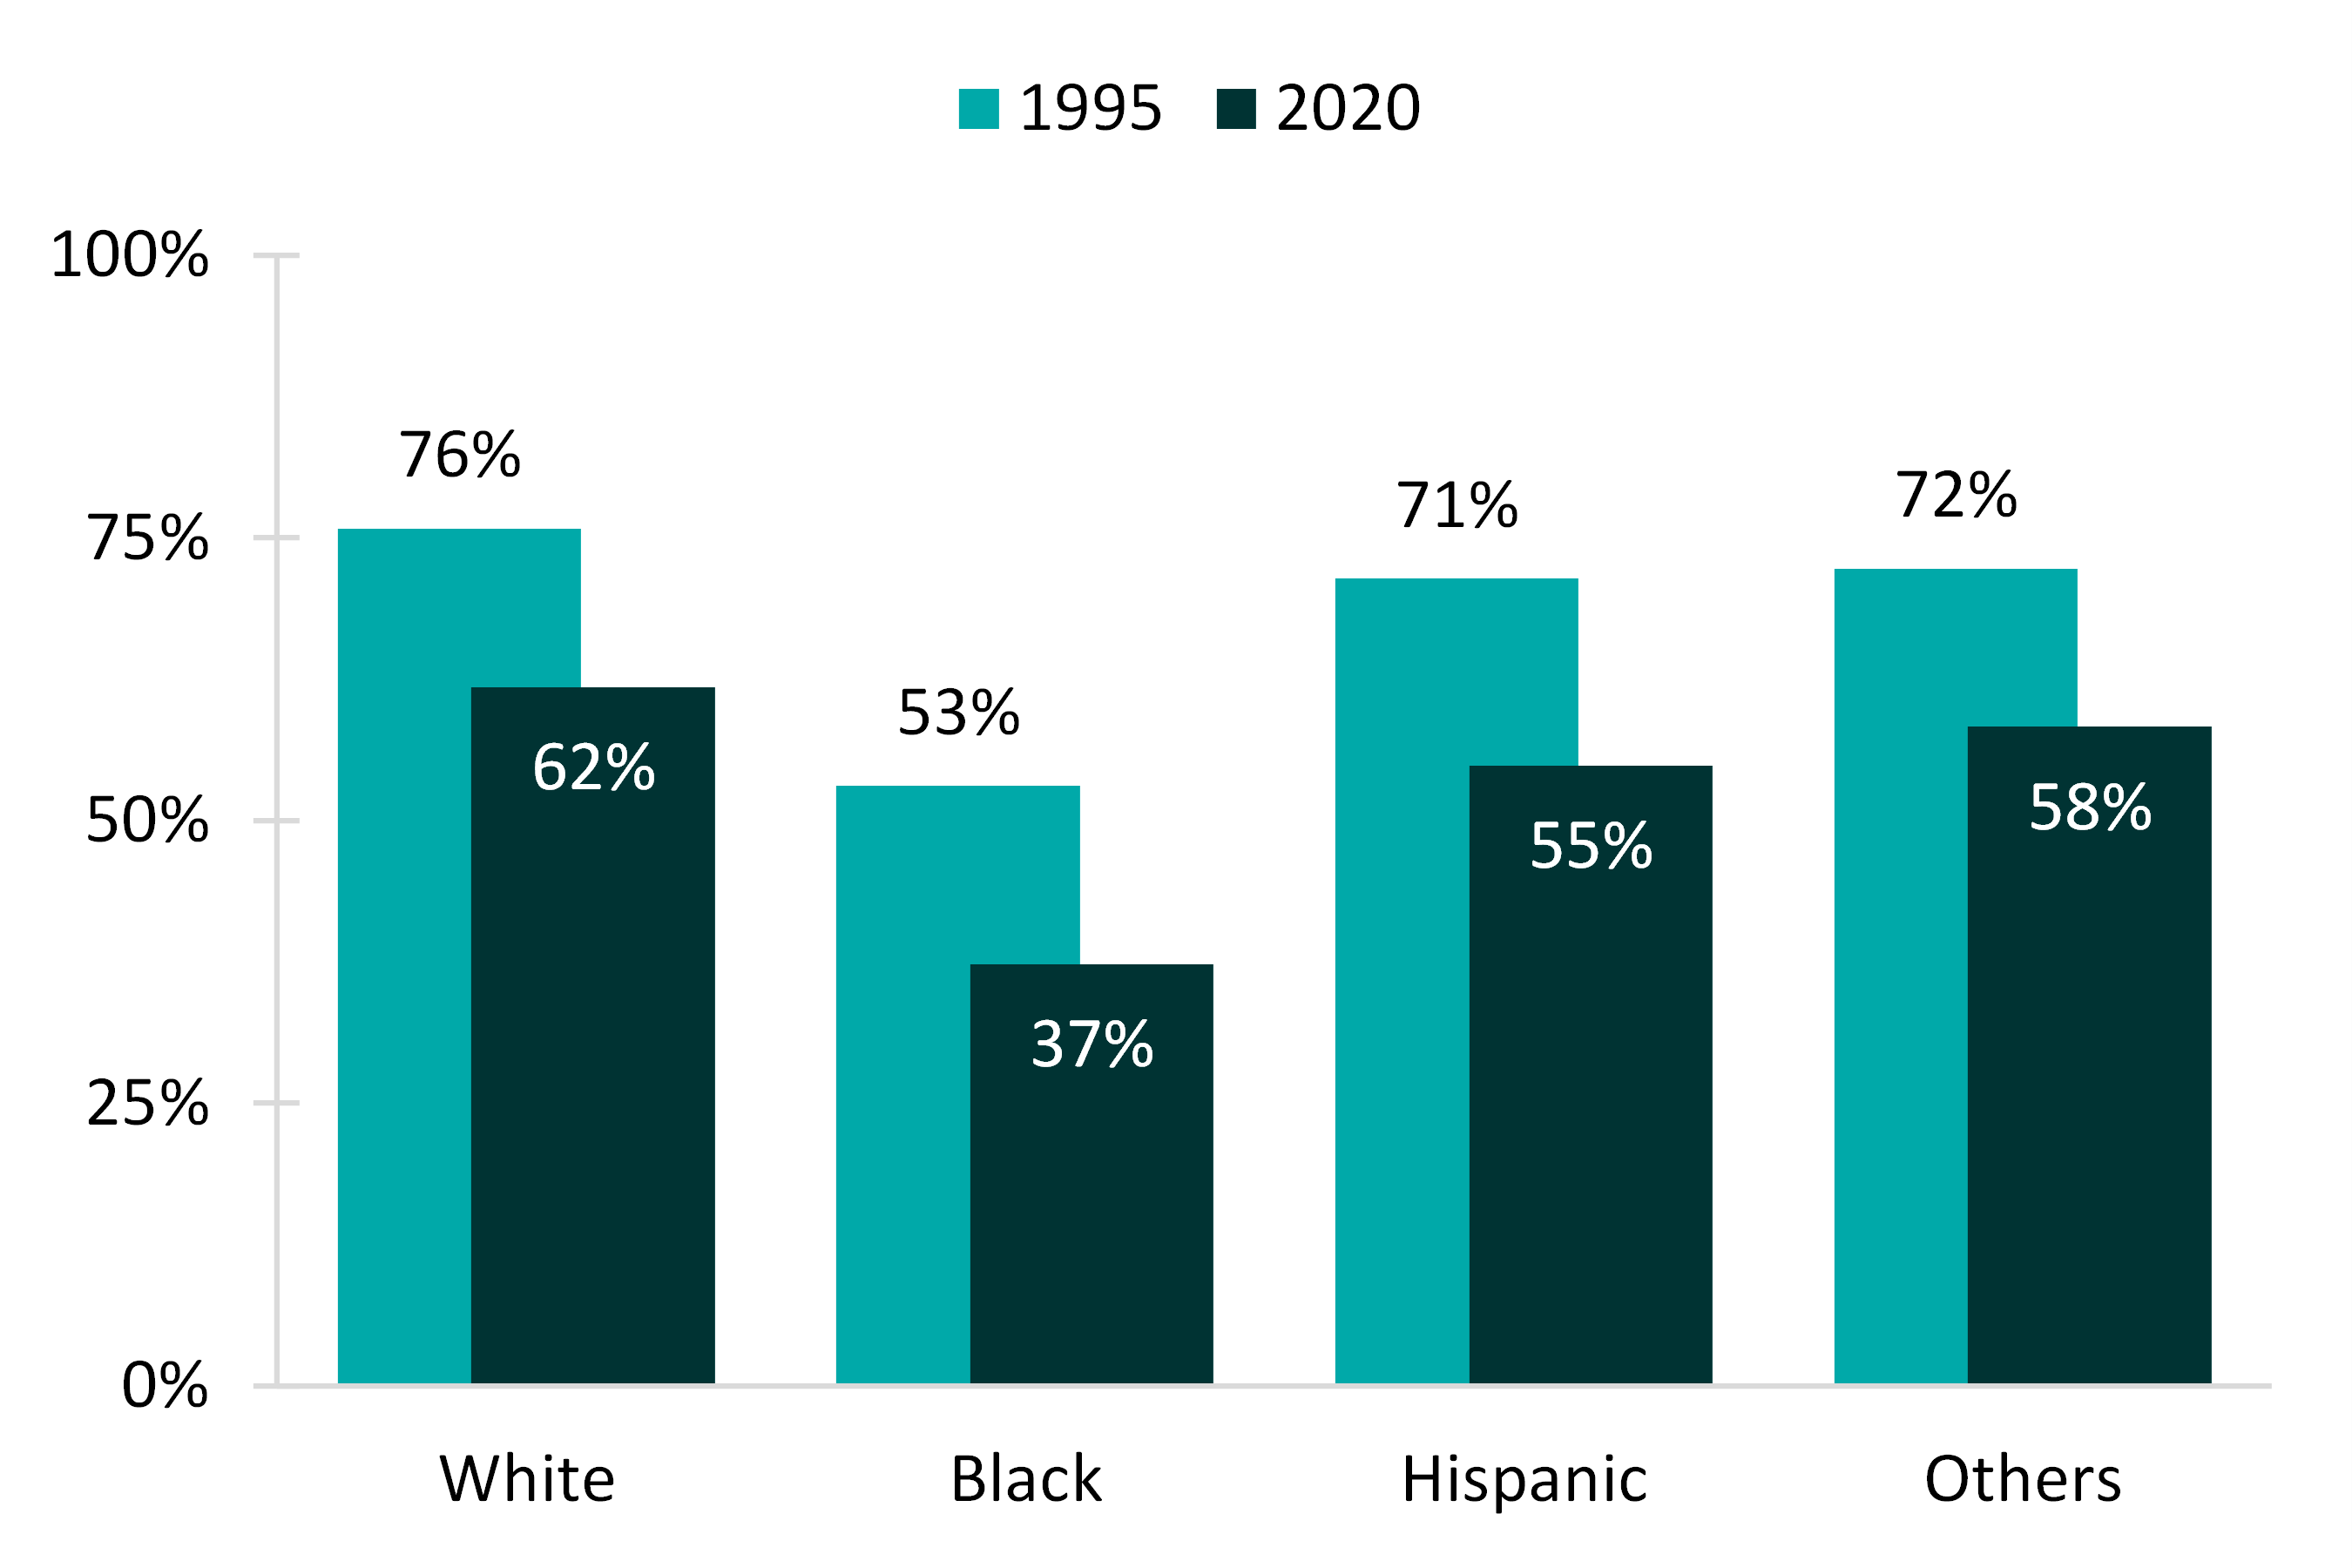
- The share of women ever married decreased between 1995 and 2020 for all racial and ethnic groups.
- The change in the proportions of women ever married between 1995 and 2020 differed across racial/ethnic groups.
- The shares of White women, Hispanic women and women in the ‘Other’ racial/ethnic group were all around one-fifth smaller in 2020 compared to 1995, with the greatest decline in the share for Hispanic women (22.5% compared to 18.4% for White women and 19.4% for women of Other races/ethnicities).
- The proportion of women ever married declined the most among Black women for whom the proportion was 30% smaller in 2020 than in 1995 (37% versus 53%).
Figure 2: Twenty-five Years of Change in the Share of Women (18-49) Who Ever Married by Racial/Ethnic Status

Educational Attainment
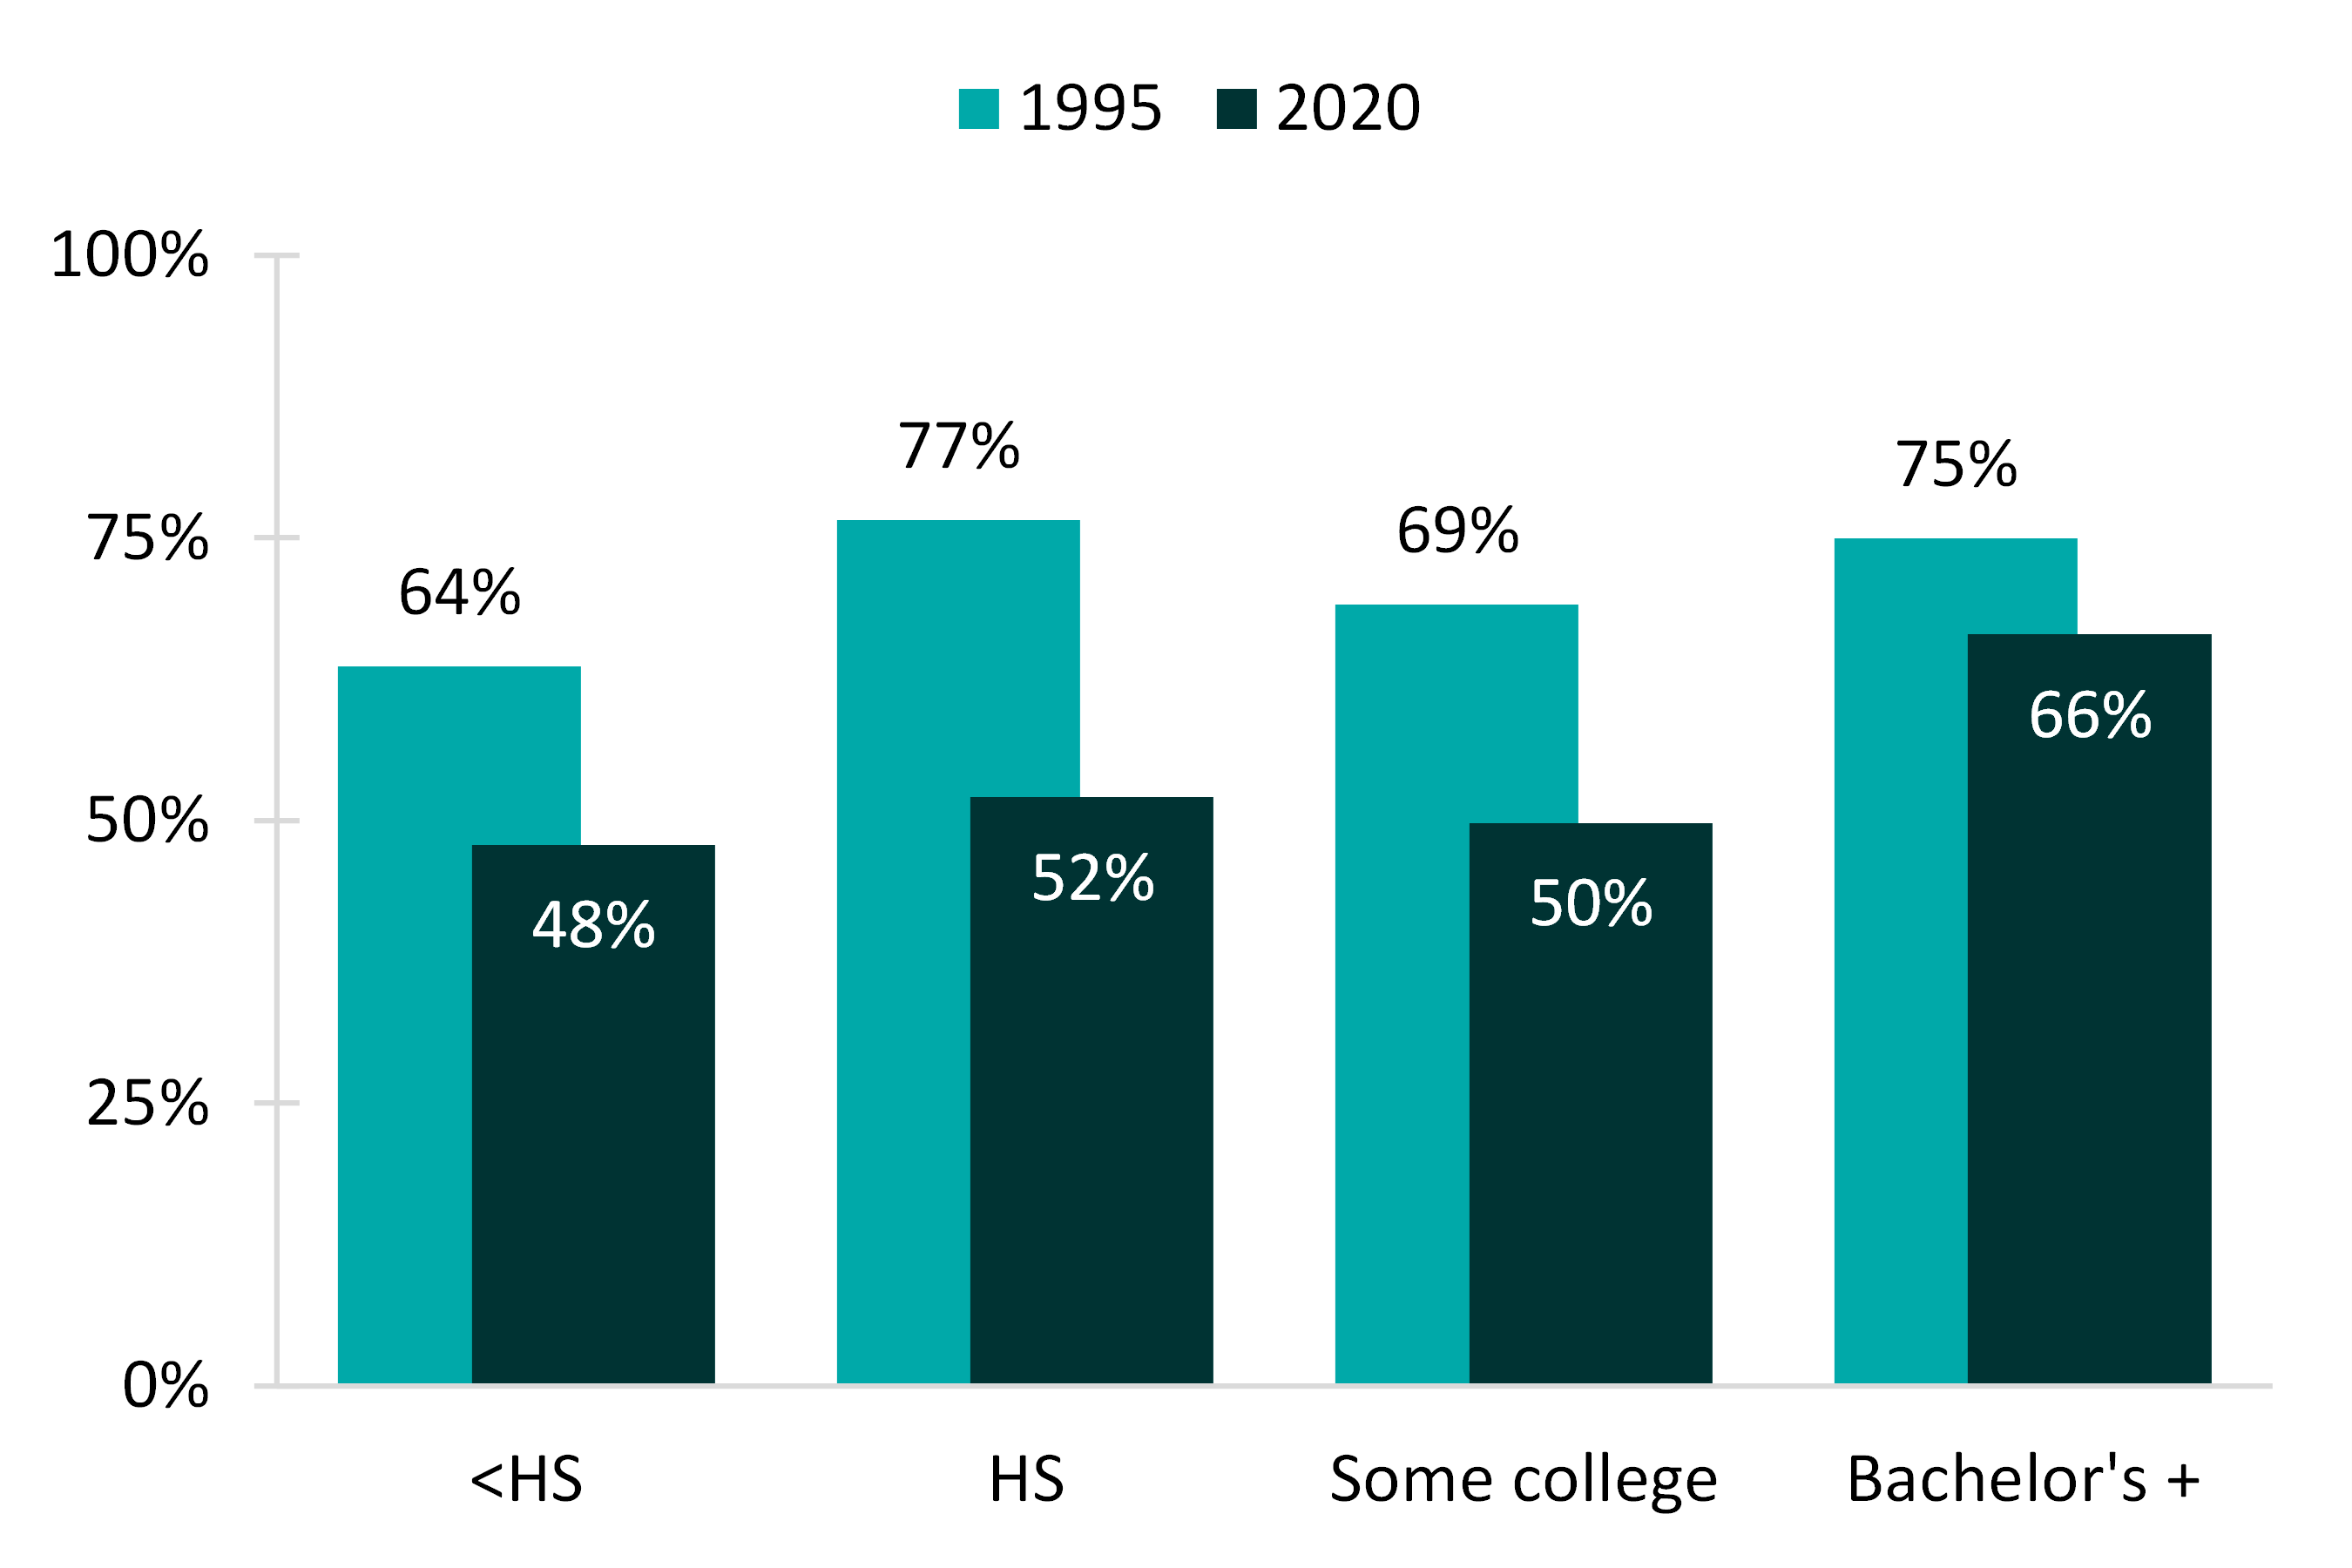
- The proportion of women ever married declined from 1995 to 2020 for all levels of educational attainment.
- The decline in the share of women ever married differed across education levels.
- The largest decrease in the proportion ever married was among women with a high school degree. In 2020, the proportion was about two-thirds of the proportion in 1995 (52% versus 77%).
- The decline in the share ever married for those with less than a high school diploma and those who had some college education were about a quarter smaller in 2020 compared to 1995 (decreased by 25% and 27%, respectively).
- Among women with at least a bachelor’s degree, the decline between 1995 and 2020 was about one-third as large as the decline among women with a high school degree (declines of 12% and 32%, respectively).
Figure 3: Twenty-five Years of Change in the Share of Women (18-49) Who Ever Married by Educational Attainment


Between 1995 and 2020, the share of women ever married decreased by 15 percentage points (from 72% to 57%).

References
- Cherlin, A. J. (2020). Degrees of change: An assessment of the deinstitutionalization of marriage thesis. Journal of Marriage and Family, 82(1), 62-80.
- Flood, S., King, M., Rodgers, R., Ruggles, S., & Warren, R. (2020). Integrated Public Use Microdata Series, Current Population Survey: Version 8.0 [dataset]. Minneapolis, MN: IPUMS, 2020. https://doi.org/10.18128/D030.V8.0
- Hemez, P. & Manning, W. D. (2017). Thirty years of change in women's premarital cohabitation experience. Family Profiles, FP-17-05. Bowling Green, OH: National Center for Family & Marriage Research. http://www.bgsu.edu/ncfmr/resources/data/familyprofiles/hemez-manning-30-yrs-change-women-premarital-cohab-fp-17-05.html
- Lamidi, E. (2015). Marriage in the U.S.: Twenty-five Years of Change, 1989-2014. Family Profiles, FP-15-17. Bowling Green, OH: National Center for Family & Marriage Research. http://www.bgsu.edu/ncfmr/resources/data/family-profiles/lamidi-marriage-25-yrs-change-fp-15-17
- Schweizer, V. J. (2020). Marriage: More than a century of change. Family Profiles, FP-20-21. Bowling Green, OH: National Center for Family & Marriage Research. https://doi.org/10.25035/ncfmr/fp-20-21
Suggested Citation
- Carlson, L. (2020). Marriage in the U.S.: Twenty-five years of change, 1995-2020. Family Profiles, FP-20-29. Bowling Green, OH: National Center for Family & Marriage Research. https://doi.org/10.25035/ncfmr/fp-20-29


This project is supported with assistance from Bowling Green State University. From 2007 to 2013, support was also provided by the U.S. Department of Health and Human Services, Office of the Assistant Secretary for Planning and Evaluation. The opinions and conclusions expressed herein are solely those of the author(s) and should not be construed as representing the opinions or policy of any agency of the state or federal government.
Updated: 04/06/2021 01:55PM

