Recent Marriages to Same-sex and Different-sex Couples: Marital History and Age at Marriage, 2023
Family Profile No. 18, 2025
Authors: Christopher A. Julian, Krista K. Westrick-Payne, & Wendy D. Manning
The year 2025 marks a decade since the U.S. Supreme Court legalized marriage for same-sex couples nationwide. Using the American Community Survey, 2023 1-year estimates from IPUMS USA (Ruggles et al., 2024), we present updated national estimates of individuals entering into same-sex and different-sex marriages in the last year (newlywed couples), building on our earlier profiles based on 2019 (Payne & Manning, 2021) and 2022 data (Westrick-Payne & Manning, 2023). We compare same-sex and different-sex newlyweds by marital history, average age at most recent marriage, and age gap between spouses, presenting estimates with 95% confidence intervals. A “first marriage” is a union where both spouses are marrying for the first time, while a “remarriage” involves at least one spouse who has been married before. Analyses are restricted to householders and their spouses. We use the term “sex,” rather than “gender,” to align with the language used in the ACS household roster, which, beginning in 2019, directly identified “same-sex” relationships (Kreider & Gurrentz, 2019).
Marriages in the Last Year
- In 2023, the American Community Survey (ACS) identified approximately 73,000 newlywed same-sex households and 1.8 million newlywed different-sex households.
- Same-sex couples accounted for roughly 4% of all newlywed households in 2023. This is consistent with levels reported since 2019.
- In 2023, 53% of same-sex newlyweds were female-female couples and 47% were male-male couples—similar to the distribution observed in 2019. However, the gap between the two groups was more pronounced in earlier years, peaking in 2021 when 60% of same-sex marriages were between female couples and just 40% between male couples.
Note: The standard 2020 ACS 1-year data products were not released due to the impact of the COVID-19 pandemic on data collection and quality (for more information, click here). As such, the estimates for the year 2020 were derived from NCFMR analyses of ACS 1-year Experimental PUMS data.
Figure 1. Share of Newlywed Same-sex Couples by Sex Composition of the Couple, 2019-2023

Source: NCFMR analyses of Community Survey, 1-year estimates, 2019-2023 from IPUMS USA, University of Minnesota, www.ipums.org
Marriages in the Last Year for Same-sex and Different-sex Couples: First Marriages and Remarriages
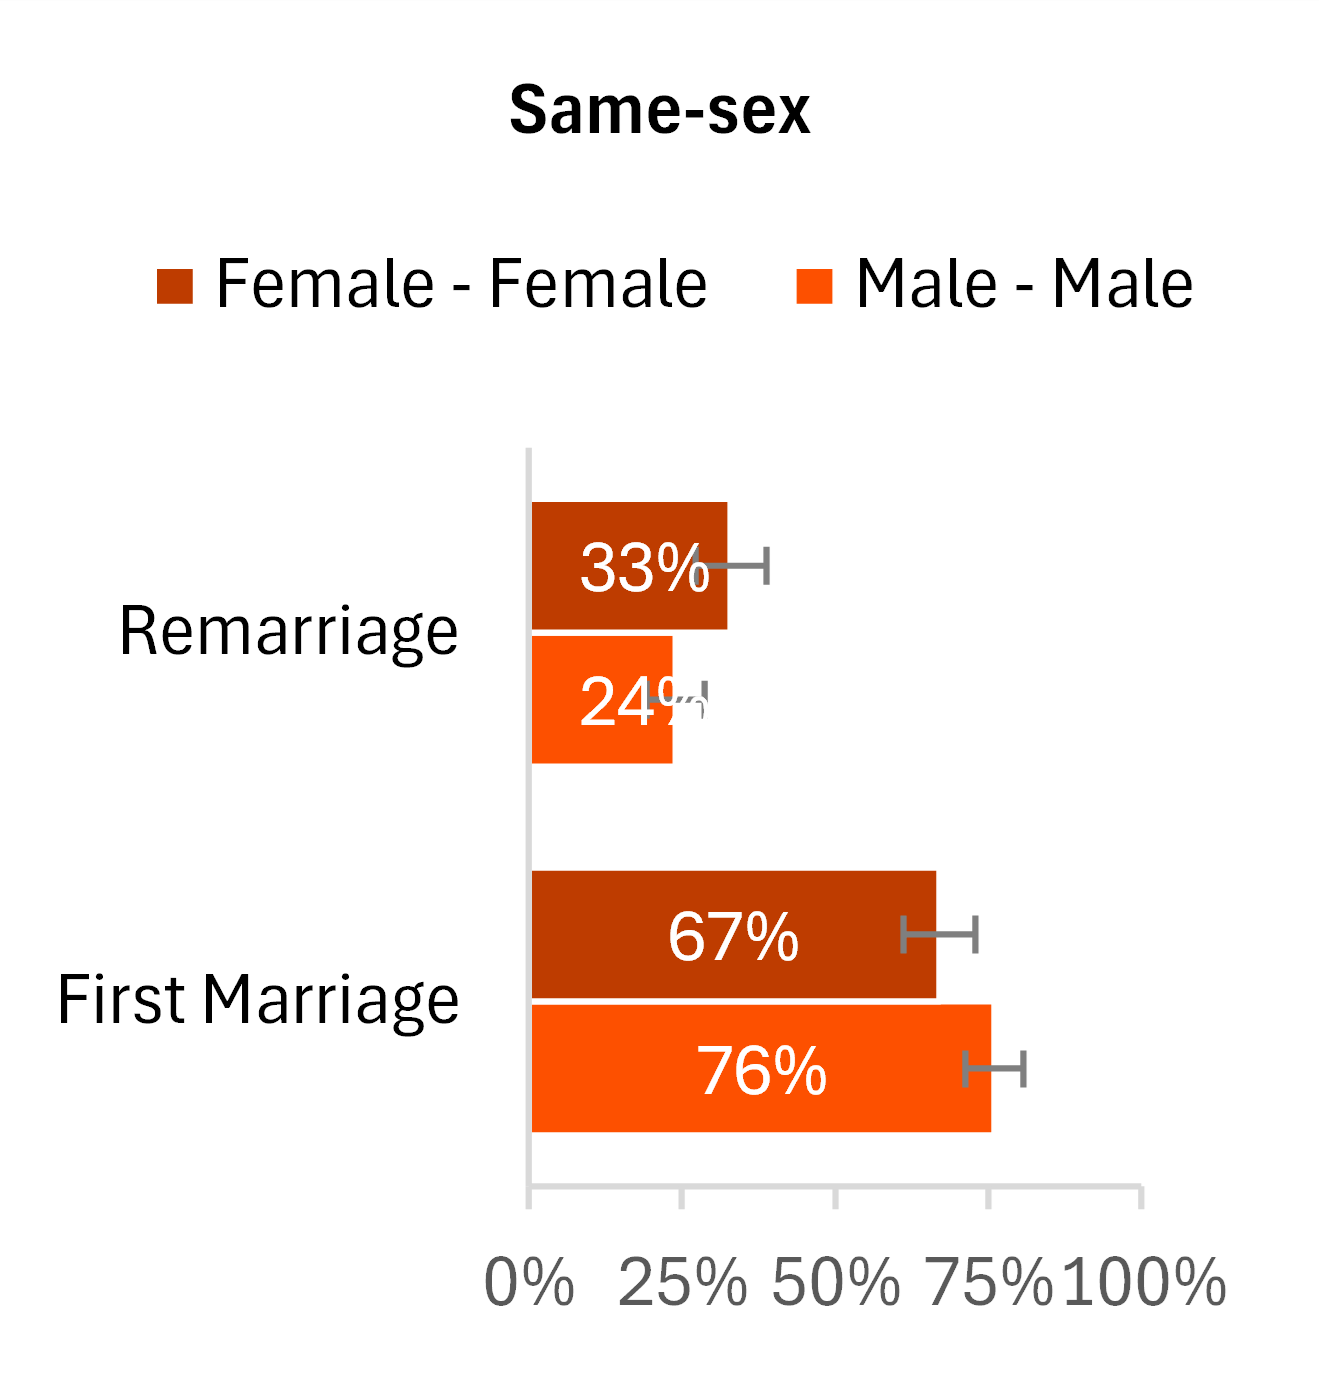
Figure 2. First Marriage and Remarriage for Same-sex and Different-sex Couples, 2023


Source: NCFMR analyses of Community Survey, 1-year estimates, 2023 from IPUMS USA, University of Minnesota, www.ipums.org
- The vast majority of recent marriages were first marriages for both spouses, regardless of the couple’s sex composition.
- Around one-third (33%) of male-female and female-female couples entered into a remarriage, compared to about one-quarter (24%) of male-male couples.
Mean Age at First Marriage Among Newlyweds: First Marriages and Remarriages
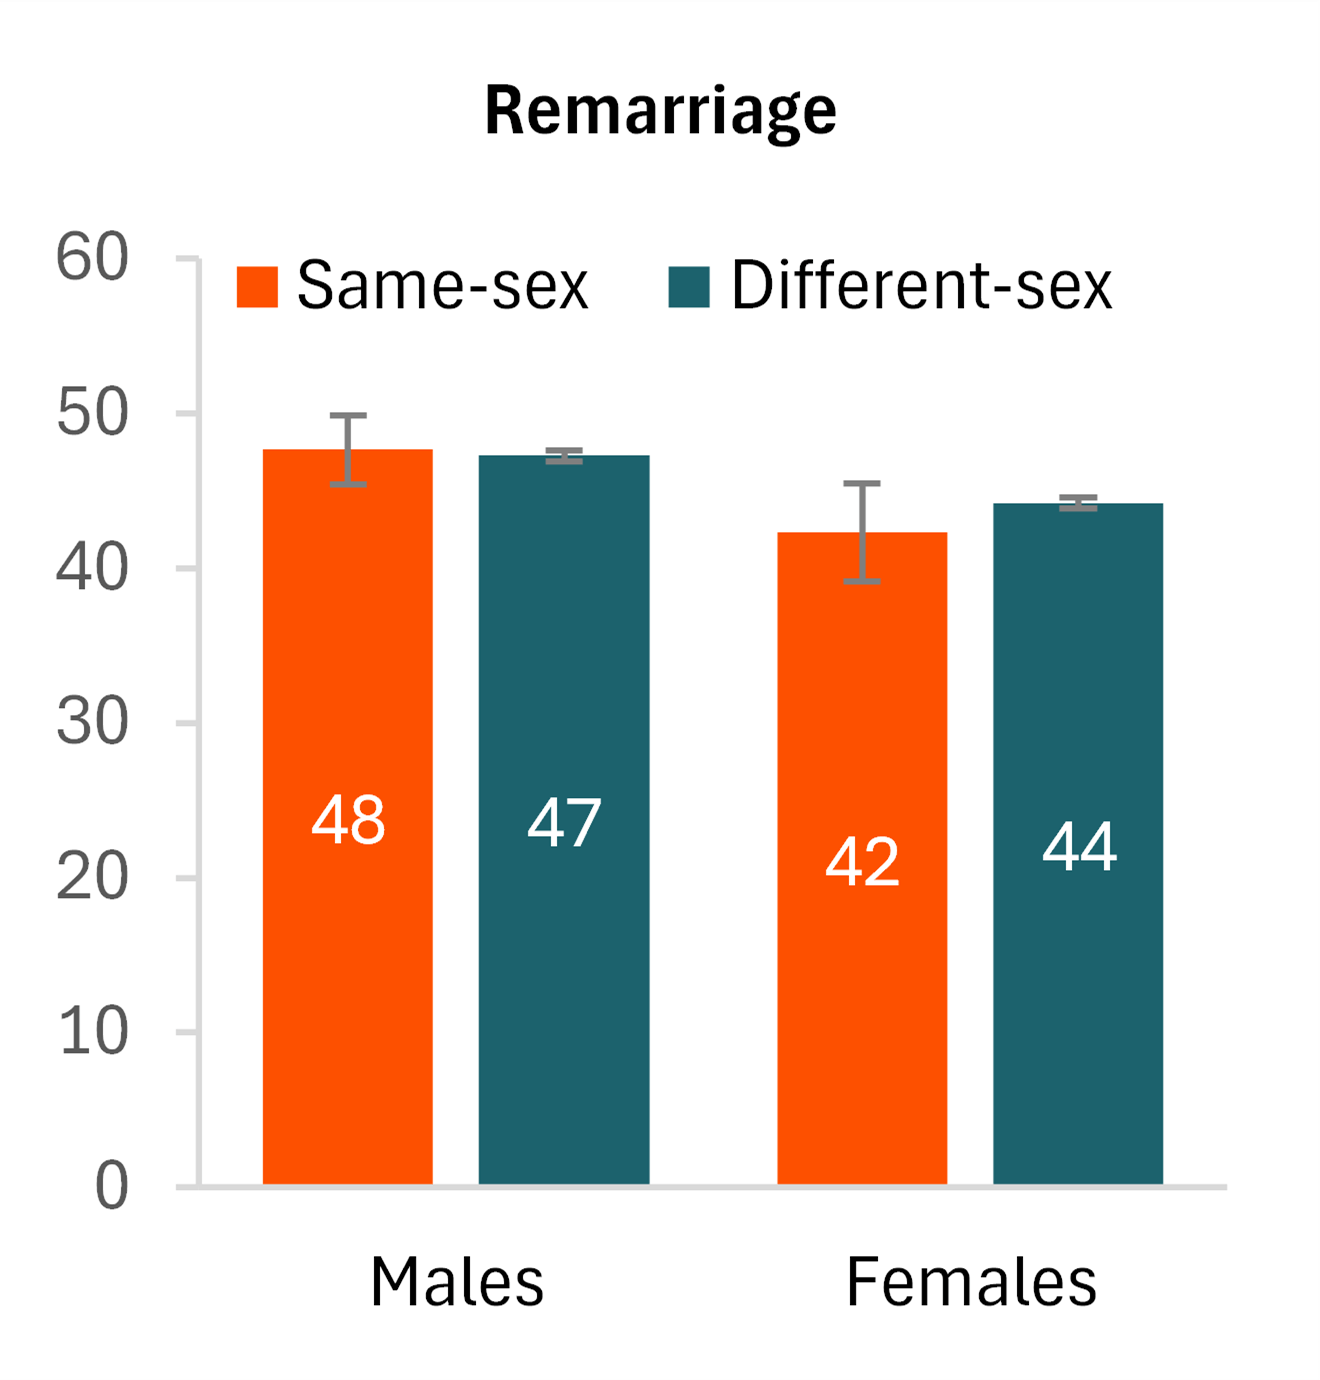
- Among first-time newlyweds, same-sex couples—both male and female—were older at the time of marriage than their different-sex counterparts.
- The average age at first marriage for females in same-sex couples was 32, compared to 29 for females in different-sex couples.
- Among males, the average age at first marriage was 38 for those in same-sex couples, compared to 31 for males in different-sex couples.
- Among remarried couples, same-sex and different-sex spouses had a similar average age at marriage, and they were married at older ages than first-time newlyweds.
Figure 3. Mean Age at Marriage and Marital History for Same-sex and Different-sex Couples Married in the Last Year, 2023


Source: NCFMR analyses of Community Survey, 1-year estimates, 2023 from IPUMS USA, University of Minnesota, www.ipums.org
Newlyweds’ Age Gap for Same-sex and Different-sex Couples: First Marriages and Remarriages
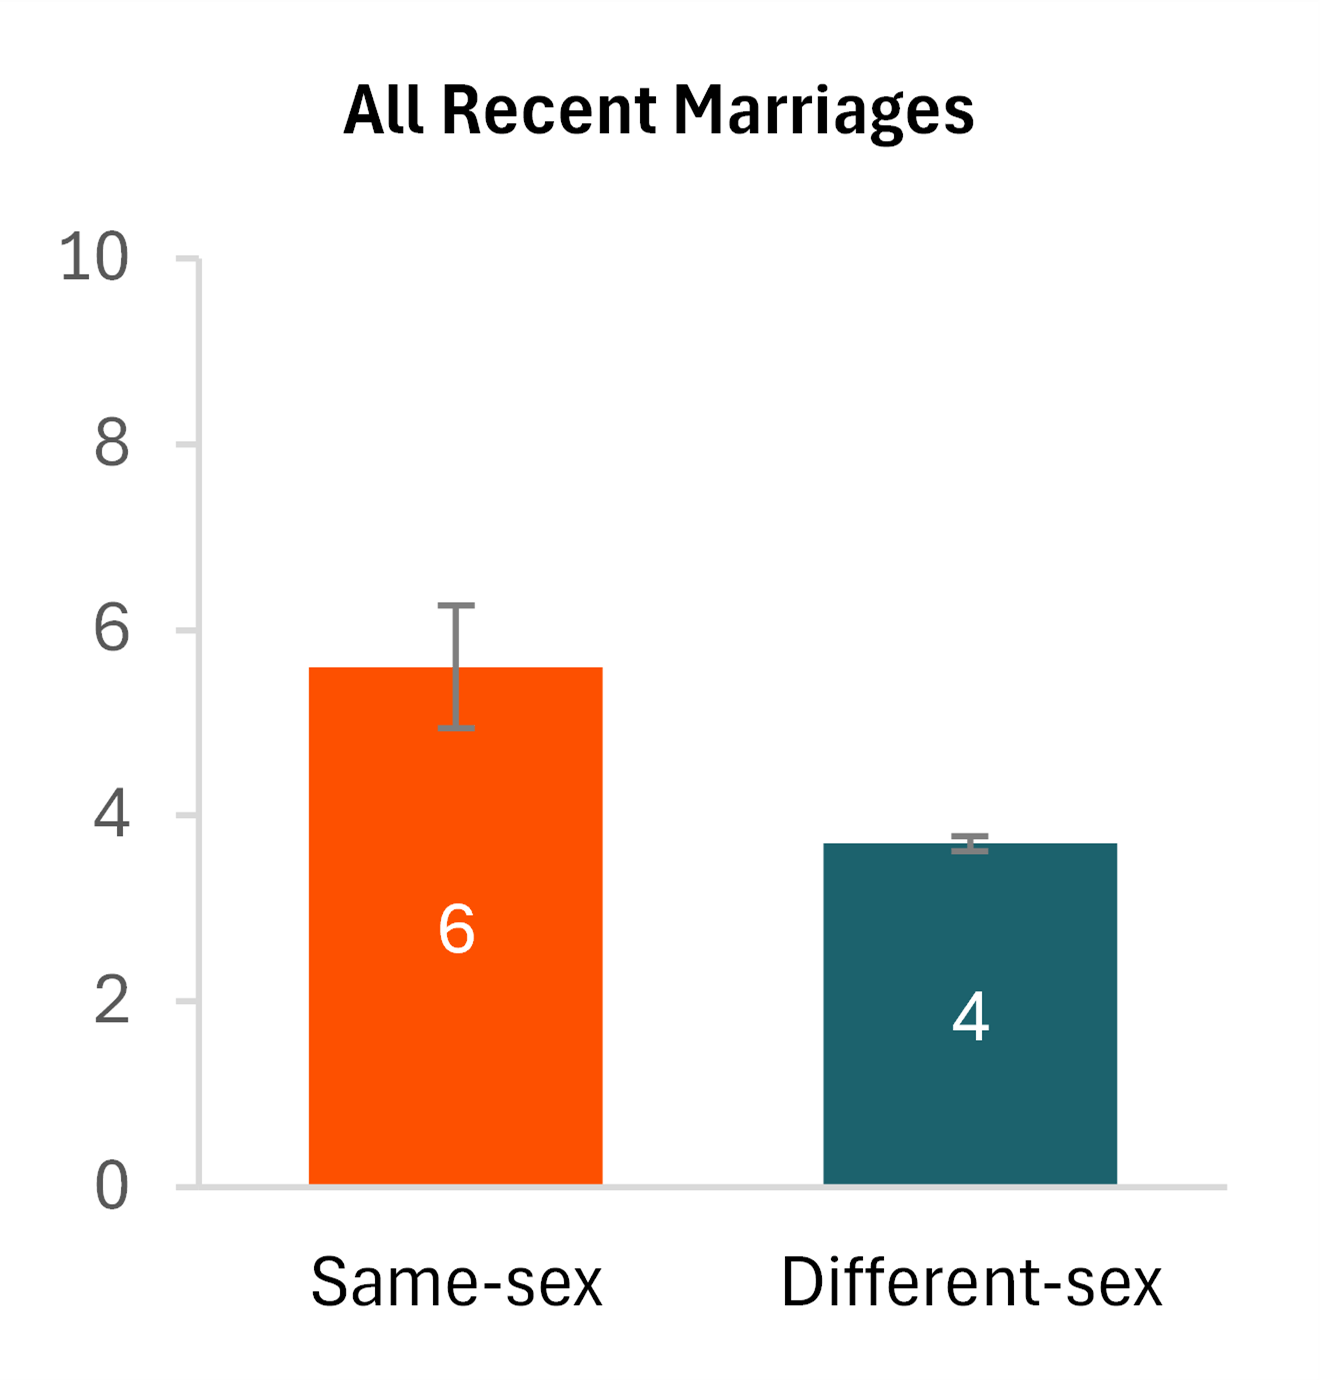
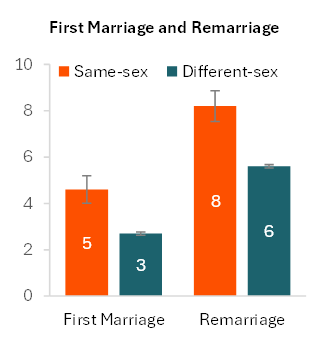
Figure 4. Mean Age Difference & Marital History for Same-sex and Different-sex Couples Married in the Last Year, 2023


Source: NCFMR analyses of Community Survey, 1-year estimates, 2023 from IPUMS USA, University of Minnesota, www.ipums.org
- Among couples who married in the past year, same-sex couples had a larger average age difference between spouses (6 years) compared to 4 years for different-sex couples.
- The age gap between spouses was smaller among recent first marriages, especially among different-sex couples, averaging 3 years compared to 5 years among same-sex couples.
- The average age gap was larger among remarried couples. Among same-sex couples the gap was 8 years compared to different-sex couples with a gap of 6 years.
Data Sources
Ruggles, S., Flood, S., Sobek, M., Backman, D., Chen, A., Cooper, G., Richards, S., Rodgers, R., & Schouweiler, M. (2024). IPUMS USA: Version 15.0 [dataset]. Minneapolis, MN: IPUMS. https://doi.org/10.18128/D010.V15.0.
References
Kreider, R. M., & Gurrentz, B. (2019). Updates to collection and editing of household relationship measures in the Current Population Survey. U.S. Census Bureau. Retrieved from: https://www.census.gov/content/dam/Census/library/working-papers/2019/demo/SEHSD-WP-2018-30.pdf.
Payne, K. K., & Manning, W. D. (2021). Recent (2019) marriages to same-sex and different-sex couples: Marital history and age at marriage. Family Profiles, FP-21-19. Bowling Green, OH: National Center for Family & Marriage Research. https://doi.org/10.25035/ncfmr/fp-21-19
Westrick-Payne, K. K. & Manning, W. D. (2023). Recent marriages to same-sex and different-sex couples: Marital history and age at marriage, 2022. Family Profiles, FP-23-27. Bowling Green, OH: National Center for Family & Marriage Research. https://doi.org/10.25035/ncfmr/fp-23-27
Suggested Citation
Julian, C. A., Westrick-Payne, K. K., & Manning, W. D. (2025). Recent marriages to same-sex and different-sex couples: Marital history and age at marriage, 2023. Family Profiles, FP-25-18. Bowling Green, OH: National Center for Family & Marriage Research. https://doi.org/10.25035/ncfmr/fp-25-18
This project is supported with assistance from Bowling Green State University. From 2007 to 2013, support was also provided by the U.S. Department of Health and Human Services, Office of the Assistant Secretary for Planning and Evaluation. The opinions and conclusions expressed herein are solely those of the author(s) and should not be construed as representing the opinions or policy of any agency of the state or federal government.
Updated: 06/13/2025 11:16AM

