Median Age at First Divorce, 2018
Family Profile No. 18, 2020
Author: Valerie Schweizer
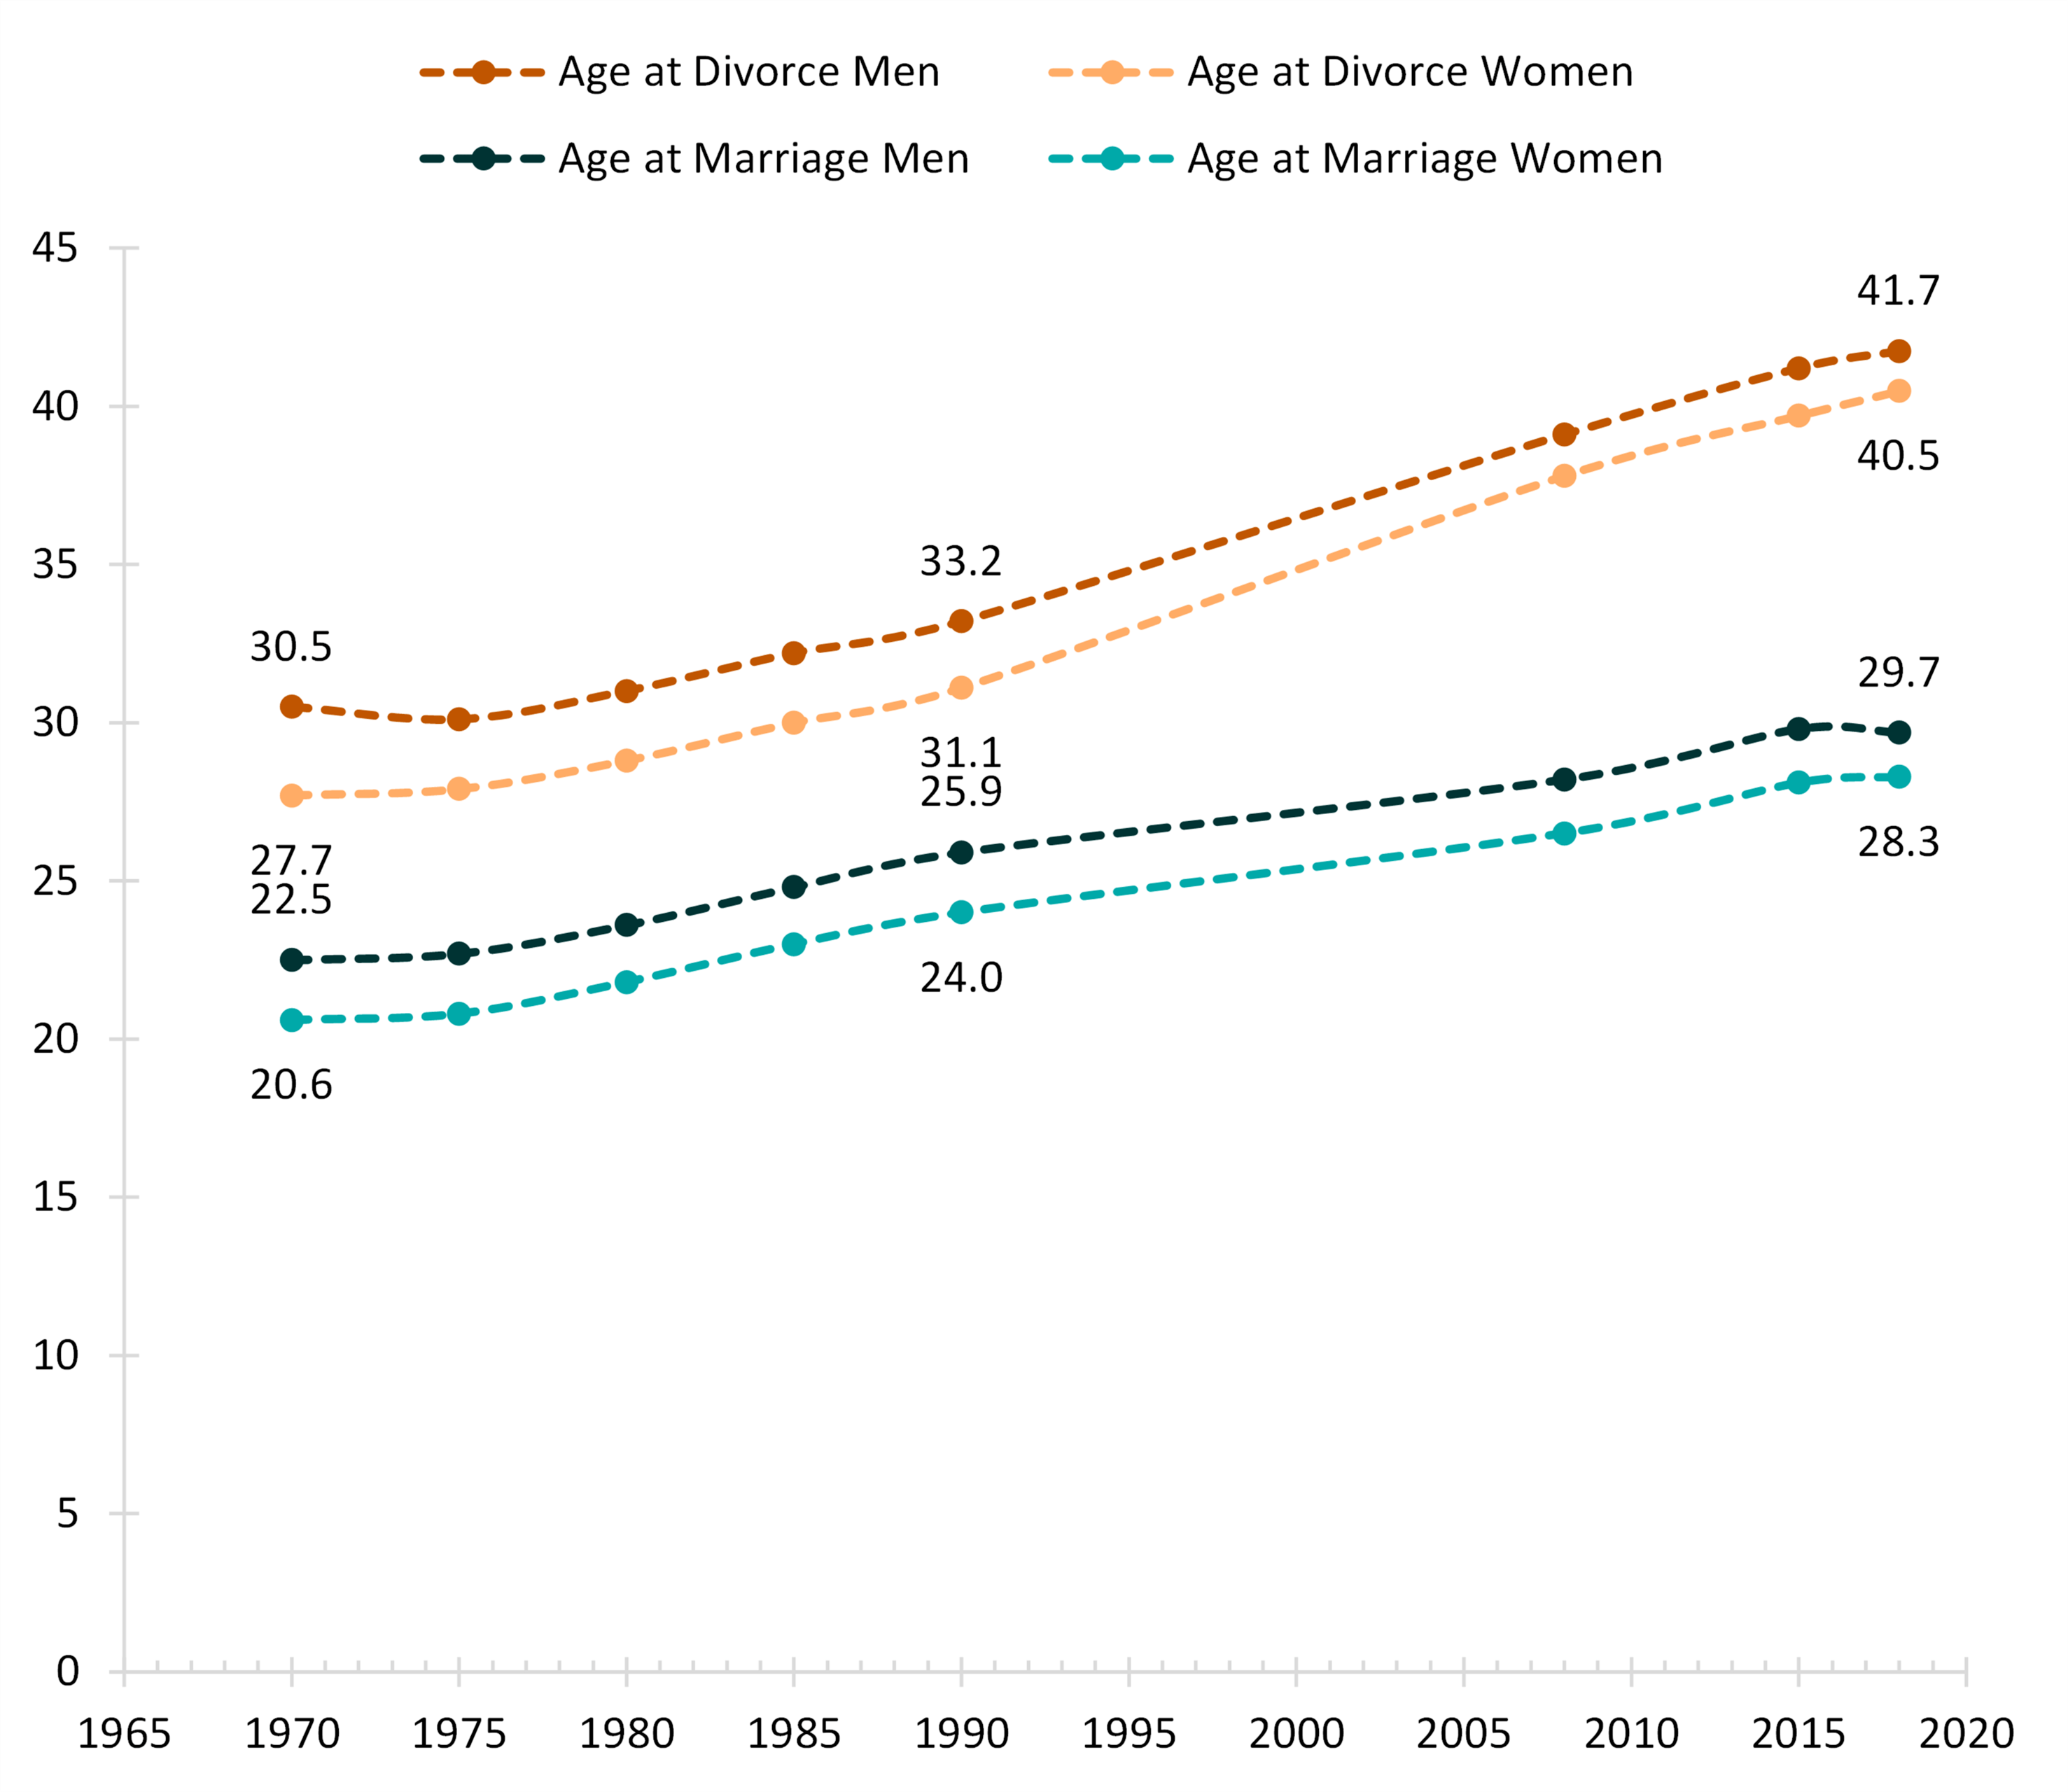
The median age at first marriage has increased over the last few decades. In 1950, on average, women married at age 20 and men at age 22. By 2018, the average age had increased to 28 for women and 30 for men (FP-19-06). The counterpart to the median age at first marriage is the median age at first divorce, which has also risen despite overall declines in the U.S. divorce rate (FP-19-23). For more information on marriage and divorce rate trends, see FP-19-22 and FP-19-23. This profile uses the 2018 American Community Survey, 1-year estimates to examine the median age at first divorce for men and women by race/ethnicity and educational attainment, beginning with an overall trend figure comparing median ages at marriage and divorce for men and women. This profile is an update to FP-17-03.
Median Ages at First Marriage and Divorce, 1970-2018
- The median ages at first marriage and first divorce have been increasing for men and women since 1970. However, the median age at first divorce has risen more rapidly than the age at first marriage.
- A persistent gender gap characterizes the median age at first marriage and divorce, with men experiencing both events at older ages compared with women.
Figure 1. Median Ages at First Marriage and Divorce, 1970-2018

Age Group
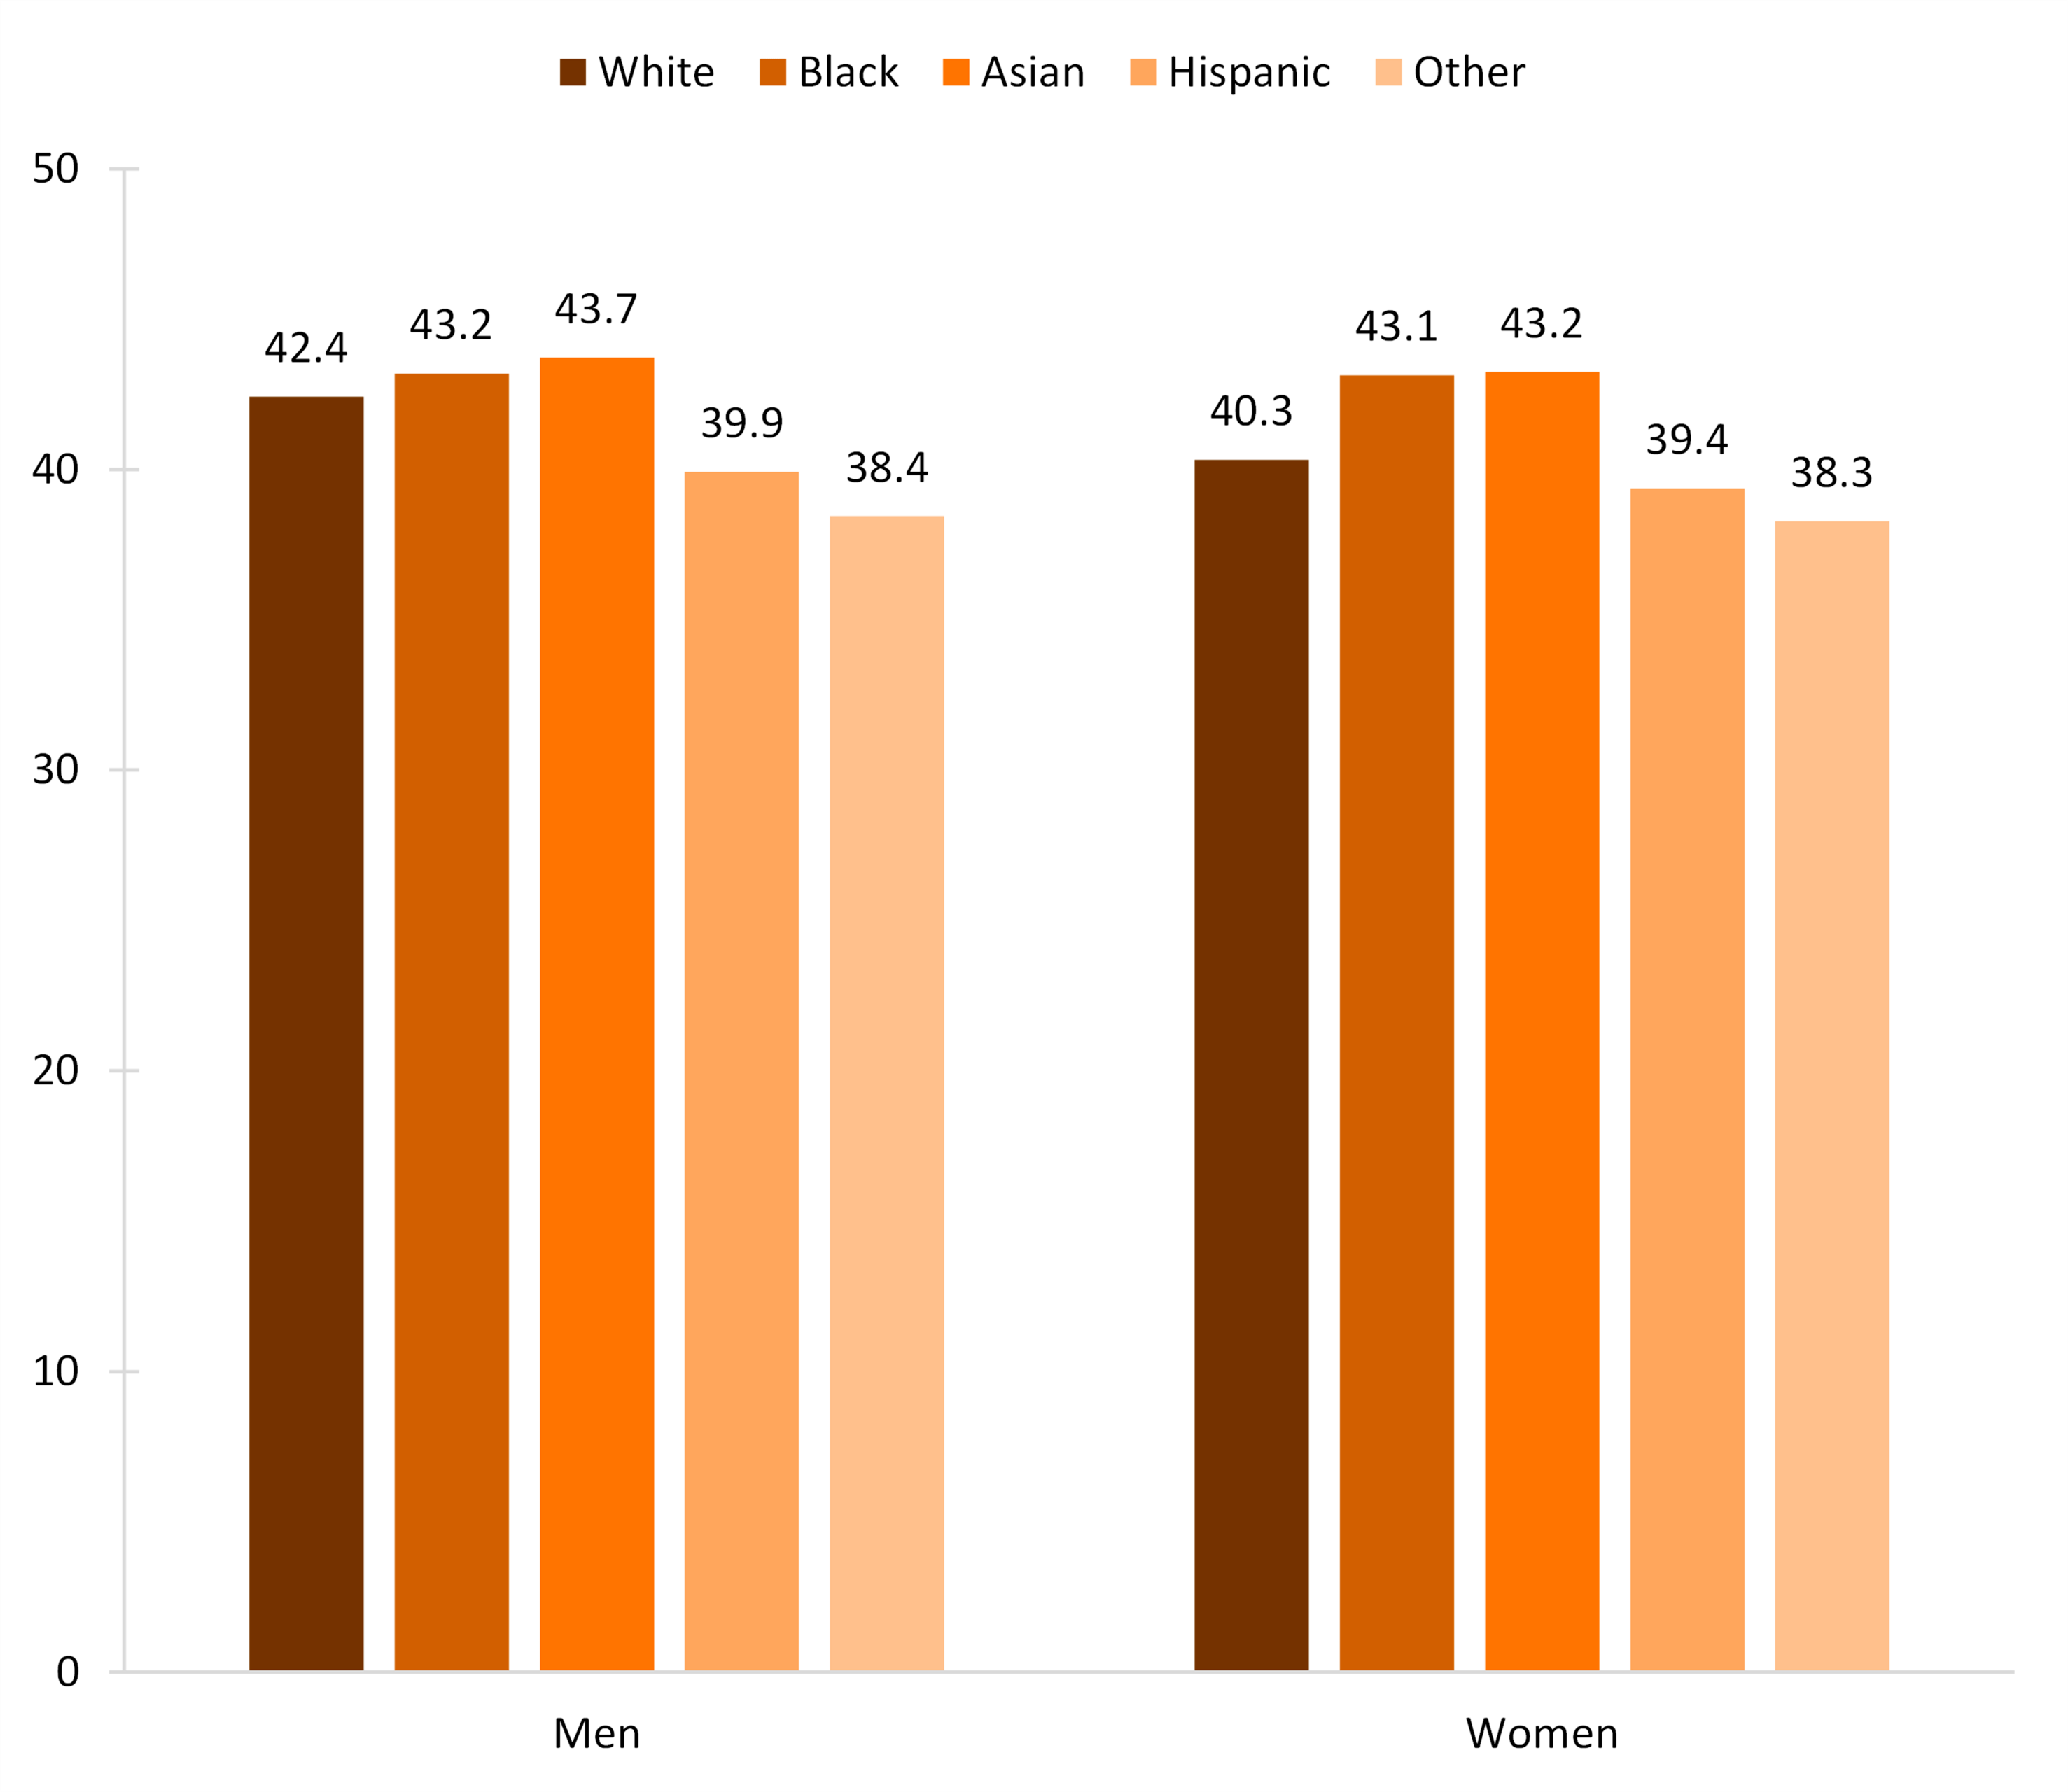
- Asian men and women had the highest median ages at first divorce at 43.7 and 43.2, respectively.
- Men and women in the ‘Other’ racial/ethnic groups had the lowest median ages at first divorce at 38.4 for men and 38.3 for women.
- White men and women have the largest gender gap in median ages at first divorce at 2.1 years. All other groups have smaller gender gaps, with nearly the same age at first divorce for women and men.
Figure 2. Median Age at First Divorce by Race/Ethnicity, 2018

Variation by Educational Attainment
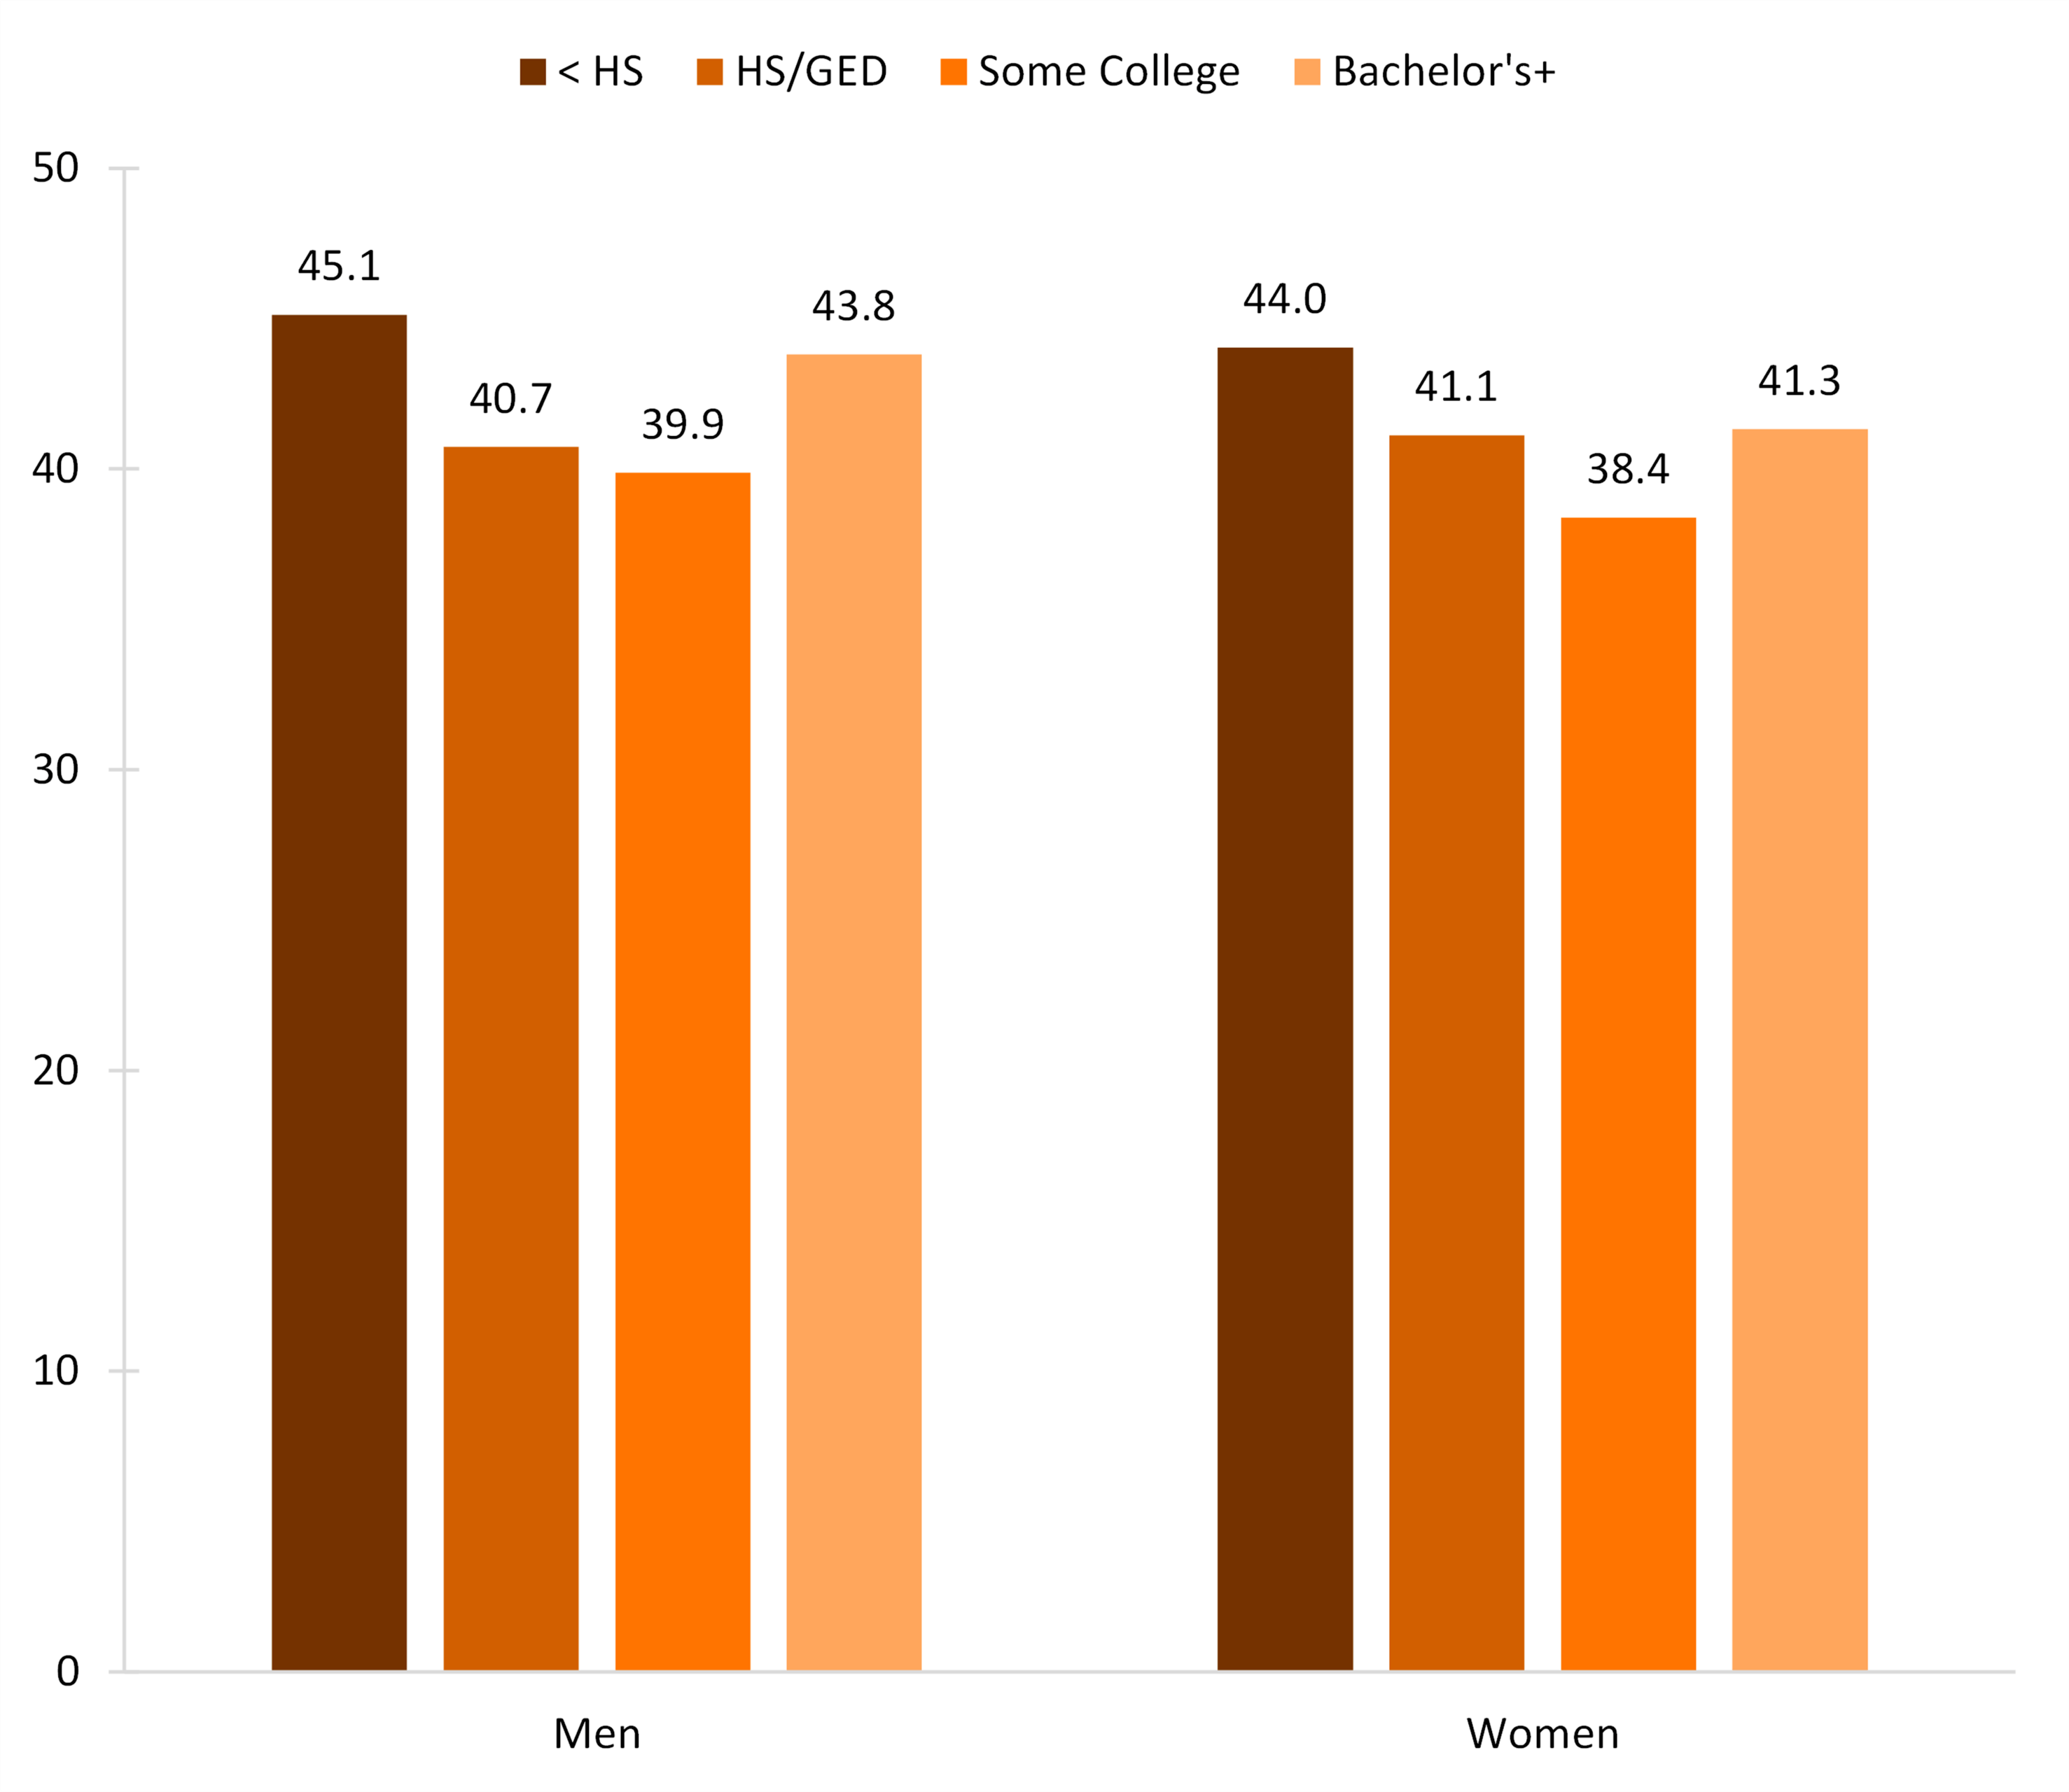
- Men and women with some college education had the lowest median ages at first divorce at 39.9 and 38.4, respectively.
- Those with less than a high school education had the highest median age at first divorce for both men (45.1) and women (44.0).
- The largest gender gap in the median age at first divorce was among those with a bachelor’s degree or higher (2.5 years).
Figure 3. Median Age at First Divorce by Education, 2018

Data Source
- U.S. Census Bureau; American Community Survey (ACS), One-Year Public Use Microdata Sample (PUMS), 2018.
- U.S. Centers for Disease Control; National Center for Health Statistics, National Vital Statistics System, 1970-1990.
References
- Allred, C. (2019). Marriage rate in the U.S.: Geographic variation, 2018. Family Profiles, FP-19-22. Bowling Green, OH: National Center for Family & Marriage Research. https://doi.org/10.25035/ncfmr/fp-19-22.
- Allred, C. (2019). Divorce rate in the U.S.: Geographic variation, 2018. Family Profiles, FP-19-23. Bowling Green, OH: National Center for Family & Marriage Research. https://doi.org/10.25035/ncfmr/fp-19-23
- Anderson, L. R. (2017). Median age at first divorce, 2015. Family Profiles, FP-17-03. Bowling Green, OH: National Center for Family & Marriage Research. http://www.bgsu.edu/ncfmr/resources/data/family-profiles/anderson-median-age-first-divorce-fp-17-03.htmI
- Payne, K. K. (2019). Median age at first marriage, 2017. Family Profiles, FP-19-06. Bowling Green, OH: National Center for Family & Marriage Research. https://doi.org/10.25035/ncfmr/fp-19-06.
Suggested Citation
- Schweizer, V. J. (2020). Median age at first divorce, 2018. Family Profiles, FP-20-18. National Center for Family & Marriage Research. https://doi.org/10.25035/ncfmr/fp-20-18
This project is supported with assistance from Bowling Green State University. From 2007 to 2013, support was also provided by the U.S. Department of Health and Human Services, Office of the Assistant Secretary for Planning and Evaluation. The opinions and conclusions expressed herein are solely those of the author(s) and should not be construed as representing the opinions or policy of any agency of the state or federal government.
Updated: 04/06/2021 01:50PM


