Marriage Rate in the U.S.: Geographic Variation, 2018
(This profile is an update of the following: FP-09-01, FP-13-11, FP-14-10, FP-15-20, FP-16-22, FP-17-25, FP-18-20)

Family Profile No. 22, 2019
Author: Colette Allred
U.S. Marriage Rate, 2018*
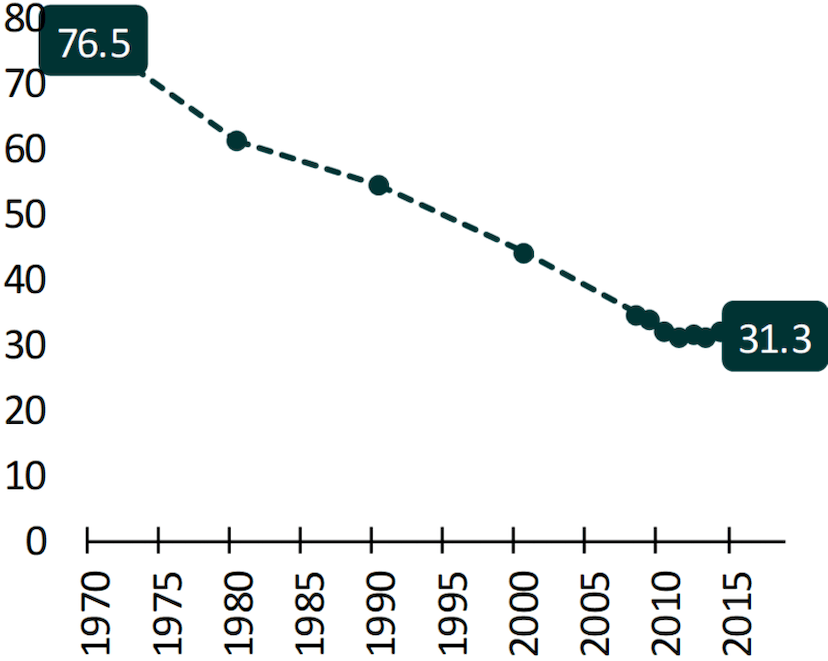
- Although the marriage rate has fallen by 59% since 1970, it has been stable since 2010, remaining at a 45-year low.
- In 2018, there were 31.3 marriages per 1,000 unmarried women, similar to the 2017 marriage rate of 32.2 (FP-18-20).
- Nearly 2.3 million women (2,268,129) married in 2018.
Figure 1. Women’s Adjusted Marriage Rate, 1990-2018

Source: NCFMR analyses of 1970-2000, National Center for Health Statistics; 2008-2018, U.S. Census Bureau, American Community Survey, 1-yr est.
*Rates are represented as the number of women aged 15 or older who married in the past year per 1,000 unmarried women aged 15 or older.
Five Highest and Lowest Marriage Rates, 2018
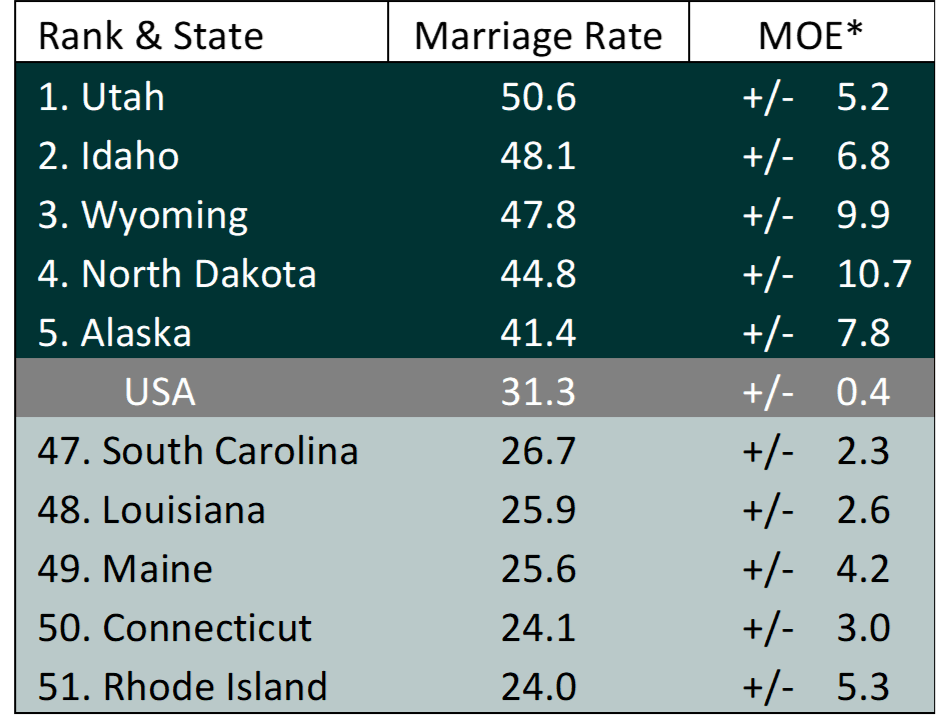
- Utah continued to have the highest marriage rate in the United States. More than 50 per 1,000 unmarried women over the age of 15 married in 2018.
- Utah’s marriage rate was also the highest in 2017, with nearly 60 (59.4) marriages per 1,000 unmarried women over the age of 15 (FP-18-20).
- Rhode Island continued to have the lowest marriage rate, with 24 marriages per 1,000 unmarried women over the age of 15.
- Rhode Island also held the lowest marriage rate in 2017, with 19 women marrying per 1,000 unmarried women over the age of 15 (FP-18-20).
Figure 2. Women's Highest and Lowest Marriage Rates

Source: NCFMR analyses of U.S. Census Bureau, American Community Survey, 2018 1-yr est.
*MOE = Margin of Error. The MOE is a measure of sampling error and expresses the maximum range in which the rate is expected to differ from the actual proportion. The MOE is calculated for the derived estimates at the 90% confidence level.
State Rankings and Geographic Variation in Marriage Rates, 2018
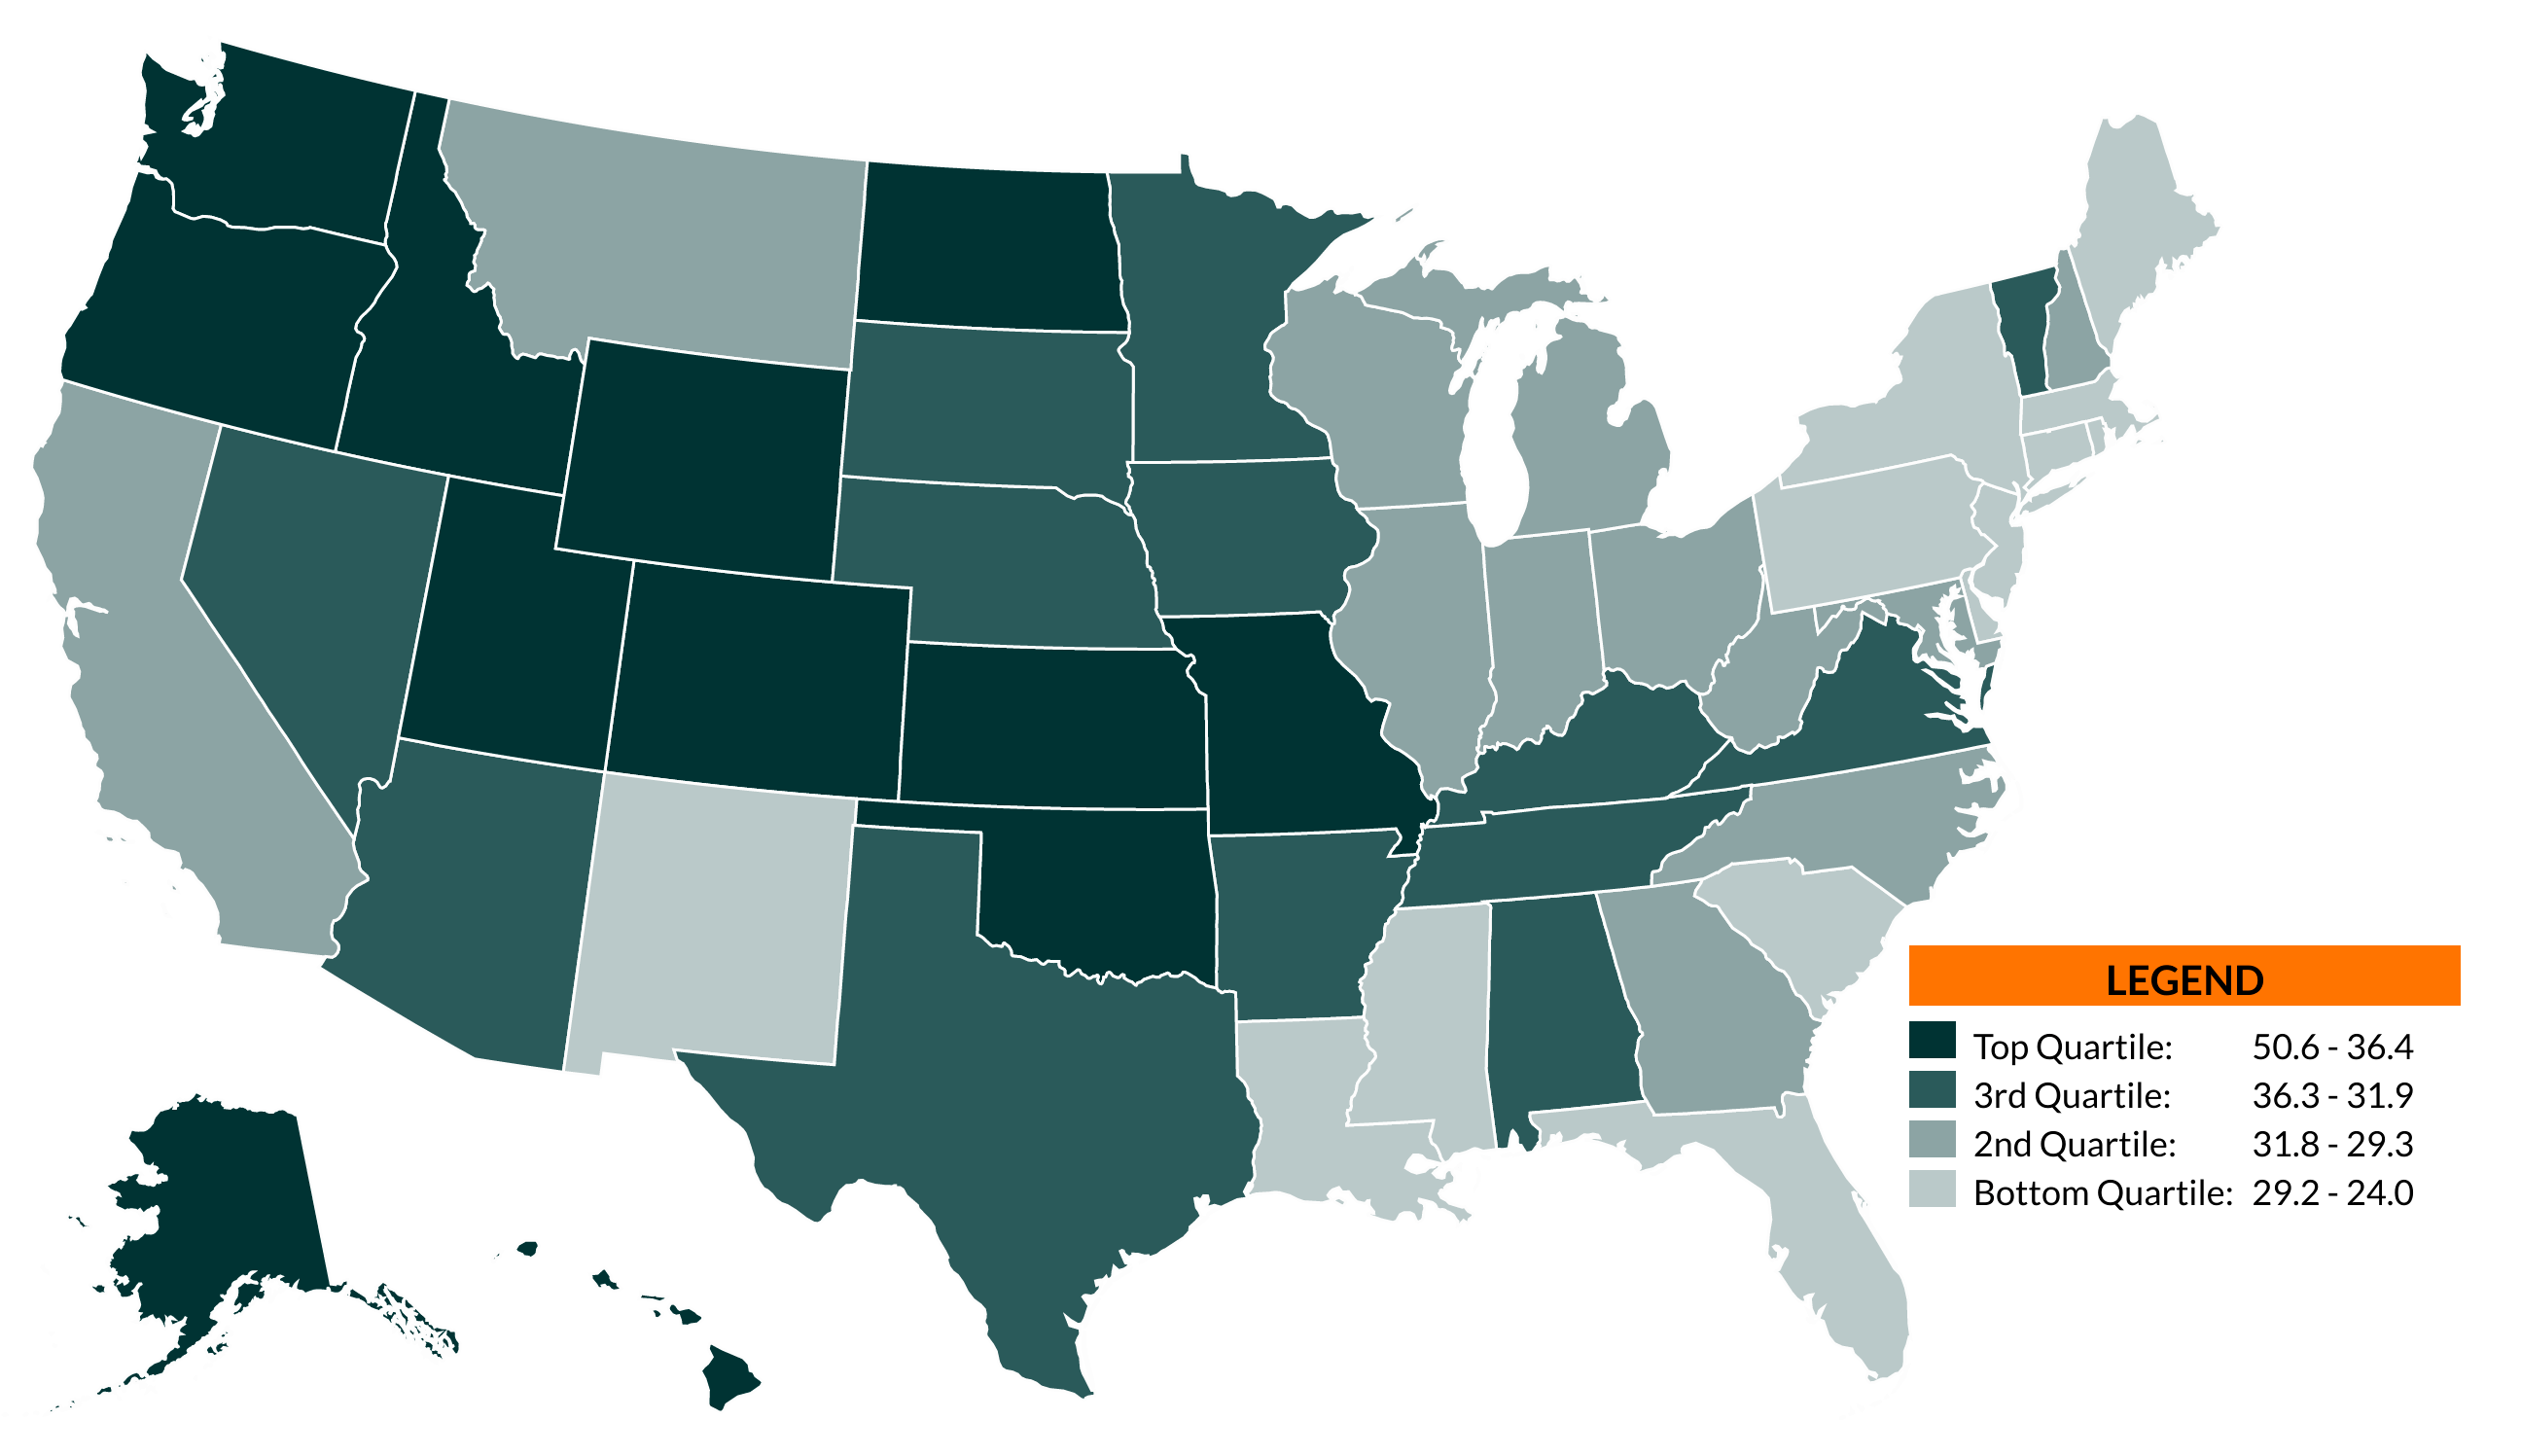
Figure 3. State Variation in the Adjusted Marriage Rate per 1,000 Unmarried Women Aged 15+ by Quartile, 2018

- The 12 states that experienced the highest marriage rates (making up the first quartile) in 2018 had rates of at least 36.3 marriages per 1,000 unmarried women aged 15 and older.
- The 13 states with the lowest marriage rates (making up the fourth quartile) had fewer than 29.2 marriages per 1,000 unmarried women aged 15 and older.
- Most states in the Western region of the country had high marriage rates (first or second quartile).
- Exceptions include Montana, California, and New Mexico.
- States in the Midwestern region of the country all exhibited marriage rates in the top three quartiles, with the largest share found in the third quartile.
- Most states in the Southern region of the country had marriage rates in the bottom three quartiles
- Oklahoma, which was in the first quartile, was the only exception.
- Almost all states in the Northeastern region of the country had low marriage rates (third or fourth quartile).
- The only exception was Vermont, where the marriage rate was in the second quartile.
Figure 4. Geographic Variation of Women’s Adjusted Marriage Rate Among States, 2018

Source: NCFMR analyses of U.S. Census Bureau, American Community Survey, 2018 1-yr est.
Data Sources
- Clarke. S. C. (1995). Advanced report of final marriage statistics, 1989 and 1990. Monthly Vital Statistics Report, 42(12). National Center for Health Statistics. https://www.cdc.gov/nchs/data/mvsr/supp/mv43_12s.pdf
- National Center for Health Statistics (1974). Summary report final marriage statistics, 1970. Monthly Vital Statistics Report, 23(2), Supp.1. U.S. Department of Health, Education, and Welfare. https://www.cdc.gov/nchs/data/mvsr/supp/mv23_02s1acc.pdf
- National Center for Health Statistics (1983). Advance report of final marriage statistics, 1980. Monthly Vital Statistics Report, 32(5), Supp. U.S. Department of Health and Human Services. https://www.cdc.gov/nchs/data/mvsr/supp/mv32_05s.pdf
- National Center for Health Statistics (2001). Births, marriages, divorces, and deaths: Provisional data for January-December, 2000. National Vital Statistics Report, 49(6), Associated Table 3. Department of Health & Human Services, Center for Disease Control and Prevention. https://www.cdc.gov/nchs/data/nvsr/nvsr49/nvsr49_06.pdf
- U.S. Census Bureau (2019). American Community Survey, 2018 1-Year Estimates [Table B12001]. Retrieved from: https://data.census.gov/cedsci/table?q=B12001&lastDisplayedRow=18&table=B12001&tid=ACSDT1Y2018.B12001
- U.S. Census Bureau (2019). American Community Survey, 2018 1-Year Estimates [Table B12501]. Retrieved from: https://data.census.gov/cedsci/table?q=B12501&lastDisplayedRow=10&table=B12501&tid=ACSDT1Y2018.B12501
References
- Schweizer, V. (2018). Marriage rate in the U.S.: Geographic variation, 2017. Family Profiles, FP-18-20. Bowling Green, OH: National Center for Family & Marriage Research. https://doi.org/10.25035/ncfmr/fp-18-20.
Suggested Citation
- Allred, C. (2019). Marriage rate in the U.S.: Geographic variation, 2018. Family Profiles, FP-19-22. Bowling Green, OH: National Center for Family & Marriage Research. https://doi.org/10.25035/ncfmr/fp-19-22.
This project is supported with assistance from Bowling Green State University. From 2007 to 2013, support was also provided by the U.S. Department of Health and Human Services, Office of the Assistant Secretary for Planning and Evaluation. The opinions and conclusions expressed herein are solely those of the author(s) and should not be construed as representing the opinions or policy of any agency of the state or federal government.
Updated: 04/14/2021 11:37AM


