R3D Align Bar Diagrams
The alignment bar diagrams provide a concise yet detailed graphical display of the alignment and the local geometric similarity between the two structures. R3D Align produces two types of bar diagrams, which differ only in the addition of basepairing information in the “Basepair” Bar Diagram.
Standard Bar Diagram
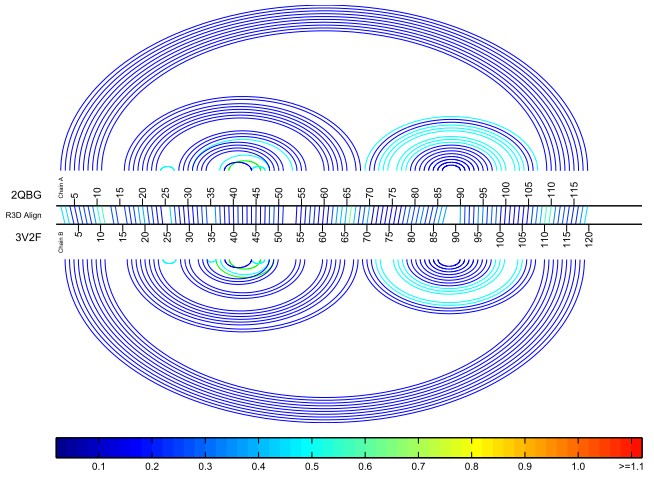
The Standard Bar Diagram diagram shows all of the nucleotide to nucleotide correspondences as determined by R3D Align. The lines are colored to provide a visual summary of the local structural similarities of the aligned nucleotides. Here is an example from the alignment of the 5S ribosomal RNA from E. coli and T. thermophilus:

The nucleotide numbers of the first structure are listed along the top horizontal line of the bar and the nucleotides of the second structure along the bottom horizontal line. Nucleotides aligned by R3D Align are connected with a line segment. The line segment is colored to give an indication of how well the local neighborhoods superimpose in 3D space. Specifically, for each nucleotide in the first structure that has a corresponding nucleotide in the second, the four nearest neighboring nucleotides with a correspondence are found and the geometric discrepancy between those five nucleotides and the corresponding five is computed to use as the basis for the coloring the line. The color bar which appears below each bar diagram displays the mapping of the discrepancy values to the colors of the lines uses a progression of blues (low discrepancy – high structural similarity) to reds (high discrepancy – structural similarity).
Basepair Bar Diagram
The Basepair Bar Diagram is an enhancement of the Standard Bar Diagram that includes a visual display of the basepairing interactions that occur within each structure.

For each structure, nucleotides that form a basepair are connected with an arc that is colored according to the type of basepairing interaction:
- Nested cWW (cis Watson-Crick/Watson-Crick) basepairs are colored royal blue. These form the basis of RNA helices.
- Non-nested cWW basepairs are colored red. These are often called pseudoknots.
- Nested non-cWW basepairs are colored light blue. These often appear in internal loops.
- Non-nested, non-cWW basepairs are colored green. Tertiary contact often involve such basepairs.
Nesting of basepairs is determined by starting at hairpin loops. The cWW basepairs closest to hairpins are declared to be nested, and, working out from the hairpins, additional cWW basepairs are declared to be nested if the arcs representing them in the diagram above do not cross arcs from cWW basepairs already declared to be nested. After the cWW basepairs are classified, non-cWW basepairs are classified according to whether they cross a nested cWW basepair’s arc or not. Thus, most non-cWW basepairs in RNA internal loops and across the insides of 3-way junctions are not nested, but tertiary contacts between locations that are distant in the secondary structure are nested.
Interpreting Bar Diagrams
Example 1: Good alignment of two large structures
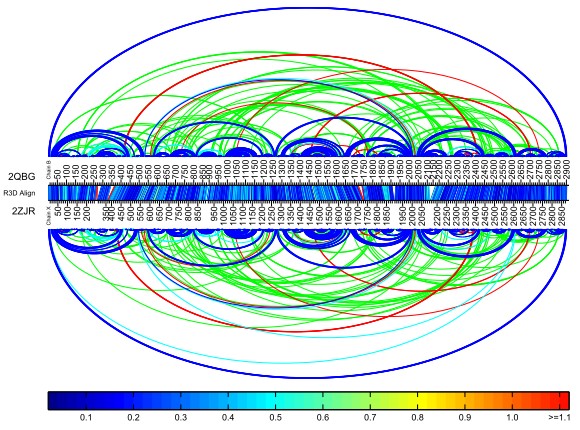
The bar diagram below represents the alignment of two 23S rRNA structures – E. coli (pdb id 2QBG, Chain B) and Deinococcus radiodurans (pdb id 2ZJR, Chain X) and can be found in the gallery of featured alignments.

The bar diagram has many connecting lines which indicates that R3D Align determined there to be many nucleotide to nucleotide correspondences between the two structures. The many blue lines illustrate that the local neighborhoods of aligned nucleotides have high structural similarity. The bar diagram indicates that overall the 23S molecules E. coli and Deinococcus radiodurans are very similar structurally and that the alignment produced by R3D Align is suitable.
The red bars in the bar diagram indicate relatively low structural similarity between the neighborhoods of aligned nucleotides. These nucleotides and their surrounding regions can be investigated in further detail using the alignment basepair spreadsheet provided on the output page. In the figure above, the red bars all occur near regions of insertions in one structure relative to the other.
The bar diagram provides a quick way to detect insertions, which appear in the bar diagrams as triangular white spaces. In the example above, there is an insertion in structure 2QBG in the 2100-2180 nucleotide range. The blue colors surround the region indicates that R3D Align has properly aligned this region. The Basepair Bar Diagram, provided below, confirms that there is an inserted helix in 2QBG. Note that the Basepair Bar Diagram can be downloaded as a high resolution pdf file for closer inspection and zooming purposes.

Example 2: Poor alignment of two large structures
The next example illustrates a poor alignment of two 16S rRNA structures - Thermus thermophilus (pdb id 1FJG, Chain A) and Thermomyces lanuginosus (pdb id 3JYV, Chain A). A better alignment of these two structures can be found in the gallery of featured alignments. In this case, the 3-iteration suggested default parameters were not used; instead, one iteration was performed using p = 1 (1 neighborhood per nucleotide) and Bandwidth (β) = 60 was used.

With a small value of p, fewer local neighborhoods are examined for each nucleotide. This provides less information and less likelihood of finding a corresponding set of nucleotides in the the other structure. This results in open areas with no correspondences and bars appearing sporadically and often red in color. Nevertheless, this is a good strategy for the first iteration of R3D Align as long as a large enough bandwidth is used.
With a small value of bandwidth β, the R3D Align method is more dependent upon the internally produced sequence alignment that is used as the seed since it has less ability to consider nucleotides farther away from the seed alignment. The bandwidth should be increased to allow for greater exploration of nucleotides. Too small a bandwidth can also result in large open areas with no correspondences. The bar diagram above is typical of a situation in which the bandwidth used was too small. With a bandwidth of 60, R3D Align will only look 30 nucleotides away from the seed alignment in either direction. If the seed alignment is off by more than 30 positions in the sequence, R3D Align will not find the correct alignment, and will be left with nothing much to align. This appears to be the case in the left half of the bar diagram above.
Too produce a better alignment, p and β should both be increased. Since increasing both increases the run time, an iterative approach should be used as suggested by the default parameters for large structures. The alignment produced in each iteration is used as the seed for the next. p should be increased from one iteration to the next to produce a more accurate alignment. Since each iteration is progressively better, the bandwidth β can be lowered as the iterations progress in order to fine tune the alignment. Progressively lowering β while increasing p has the desirable effect of increasing accuracy while maintaining a manageable run time.
The bar diagram below represents the alignment produced when using the default suggested parameters for large structures.

It is immediately apparent that the resulting alignment is more accurate than the one above although there are a few individual nucleotides and small regions that can be looked into for further investigation.
Updated: 12/02/2017 02:25AM
