Family Formation Experiences: Women’s Median Ages at First Marriage and First Birth, 1979 & 2016
Family Profile No. 16, 2019
Author: Paul Hemez
Changes in the age women experience family formation events over the past several decades have led scholars to argue marriage and childbearing have become decoupled (Hayford, Guzzo, & Smock, 2014). Furthermore, women’s postponement of marriage has been more pronounced than the delay in childbearing, resulting in a crossover in the ages at first marriage and first birth (FP-17-22). This Family Profile series (companion profile is FP-19-15) explores whether trends in marriage and childbearing over the past 37 years have been experienced similarly for women with different demographic characteristics. The current profile uses data from Vital Statistics Birth Records and the Fertility Supplement of the Current Population Survey to estimate women’s median ages at first marriage and first birth in 1979 and 2016 across racial/ethnic statuses and educational attainment groups. (Note: 2016 is the most current year data from both the CPS Fertility Supplement and Vital Statistics Birth Records are available).
Changes in the Median Ages at First Marriage and First Birth
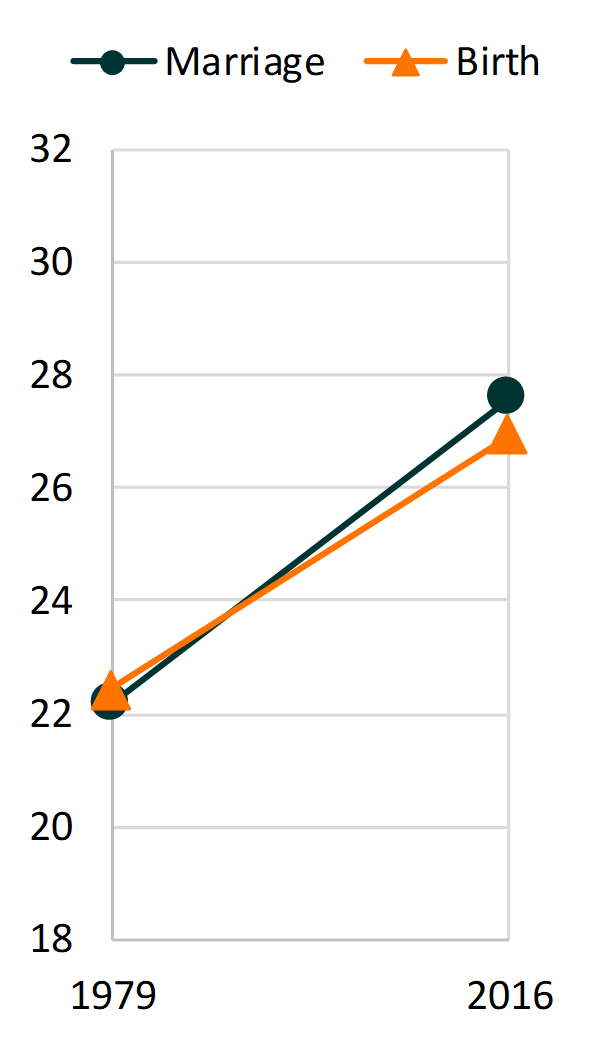
- Between 1979 and 2016, women’s median ages at both first marriage and first birth increased, but the age at marriage increased more than the age at first birth.
- A crossover in the median ages women entered marriage and had a first birth occurred in 1991 (FP-17-22). In 1979, the median age at first marriage (22.2) was less than the age at first birth (22.4). By 2016, the median age at marriage (27.6) was greater than the age at first birth (26.9).
Figure 1. Women’s Median Ages at First Marriage and at First Birth in 1979 & 2016
Source: NCFMR Analyses of Age at Marriage: 1979 & 2016 CPS Fertility Supplement; Age at Birth: National Center for Health Statistics (1979 & 2016)
Race/Ethnicity
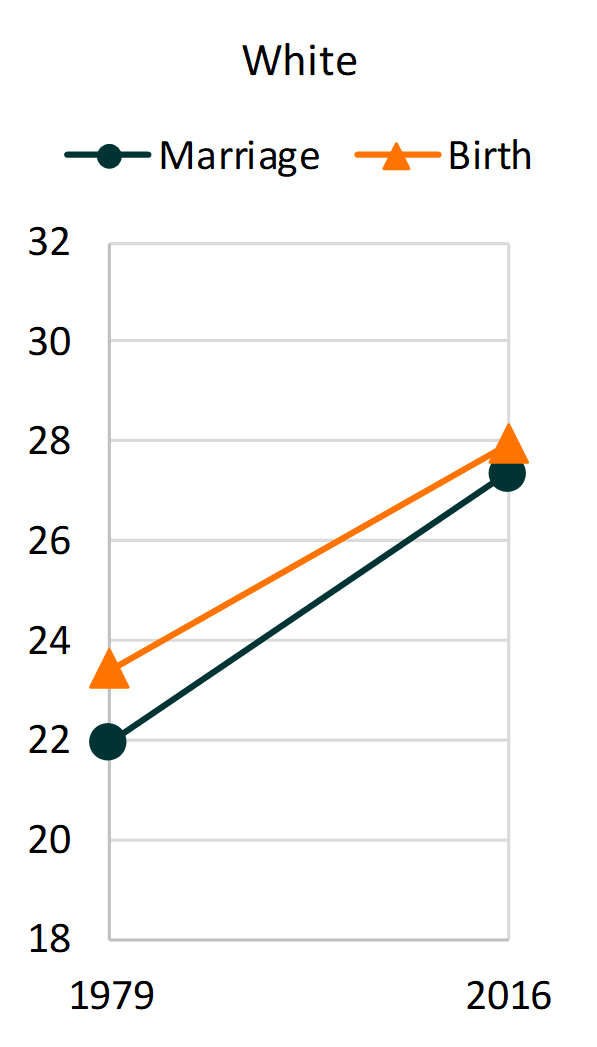
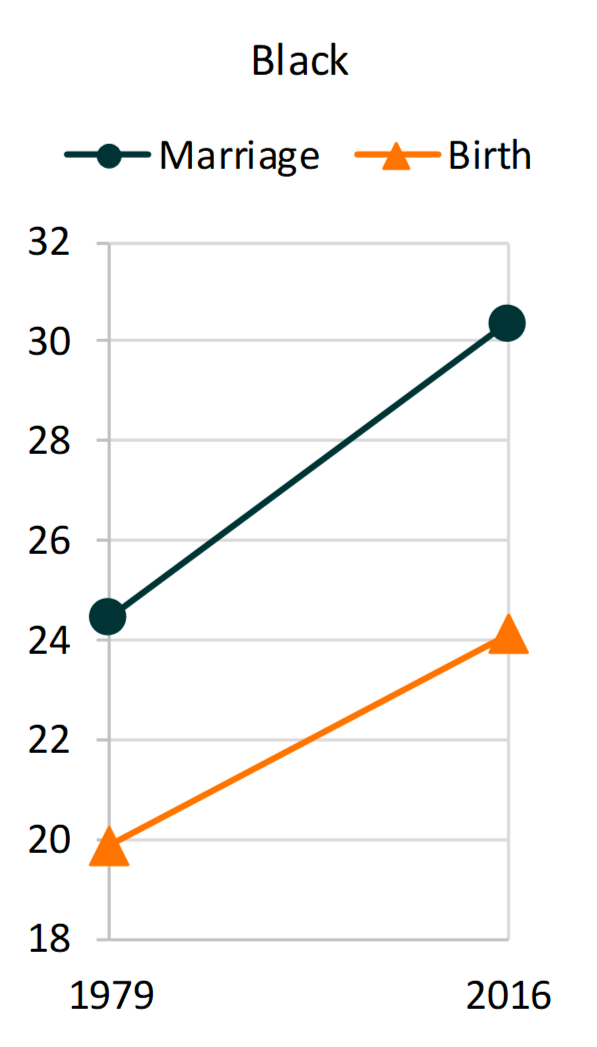
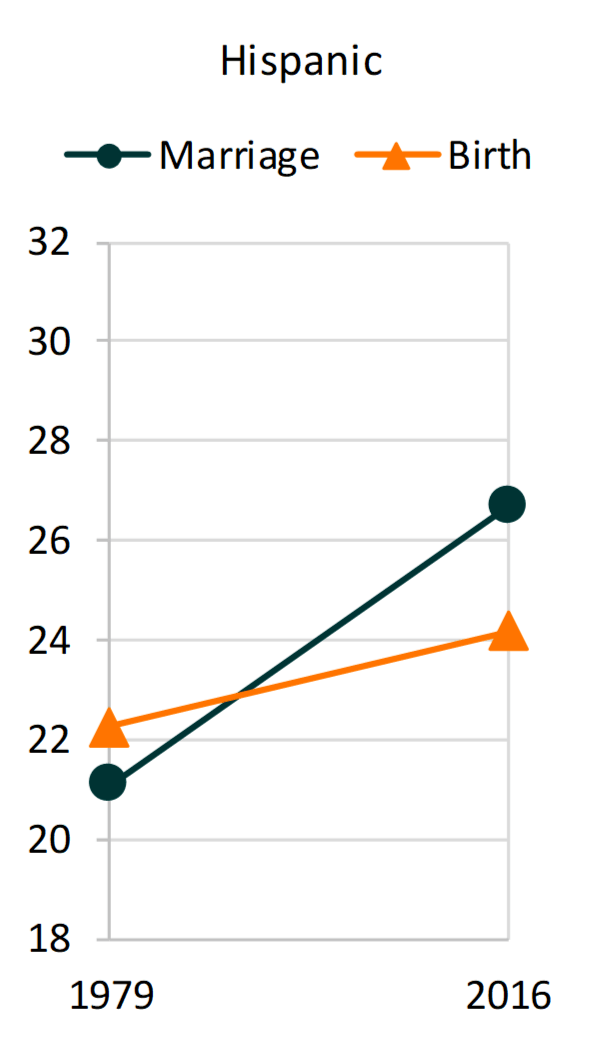
Each racial/ethnic group considered here experienced a postponement in birth and marriage from 1979 to 2016, and for each racial/ethnic group, the ages at marriage increased more than the ages at first birth.
- Among White women, the median age at first marriage was younger than the age at first birth across time points with a narrowing of the gap in age at marriage and first birth.
- Black women experienced younger ages at childbearing than marriage at both time points with a slight widening of the gap in age at marriage and first birth.
- Hispanics were the only racial-ethnic group to experience a crossover in the median ages at marriage and birth that appears to have been driven by a greater increase in the age at marriage.
Figure 2. Women’s Median Ages at First Marriage and at First Birth in 1979 & 2016, by Racial/Ethnic Status
Source: NCFMR Analyses of Age at Marriage: 1979 & 2016 CPS Fertility Supplement; Age at Birth: National Center for Health Statistics (1979 & 2016)
Educational Attainment
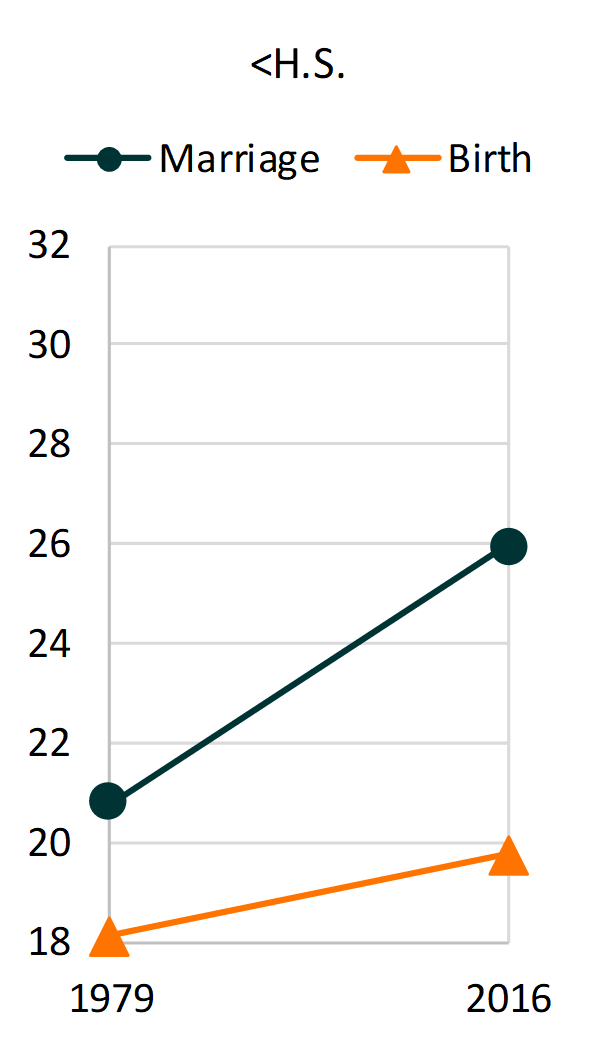
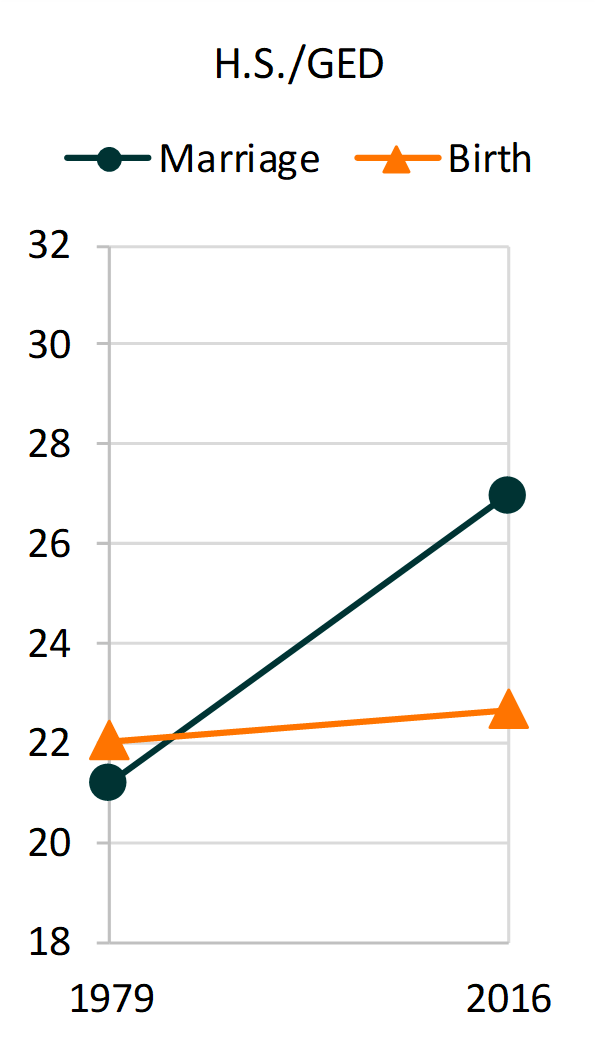
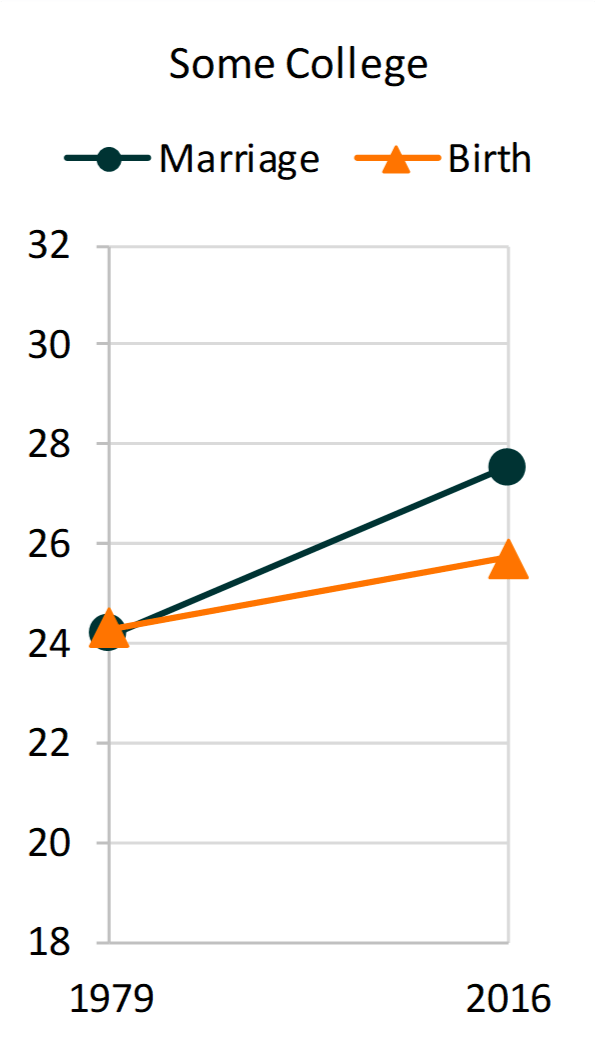
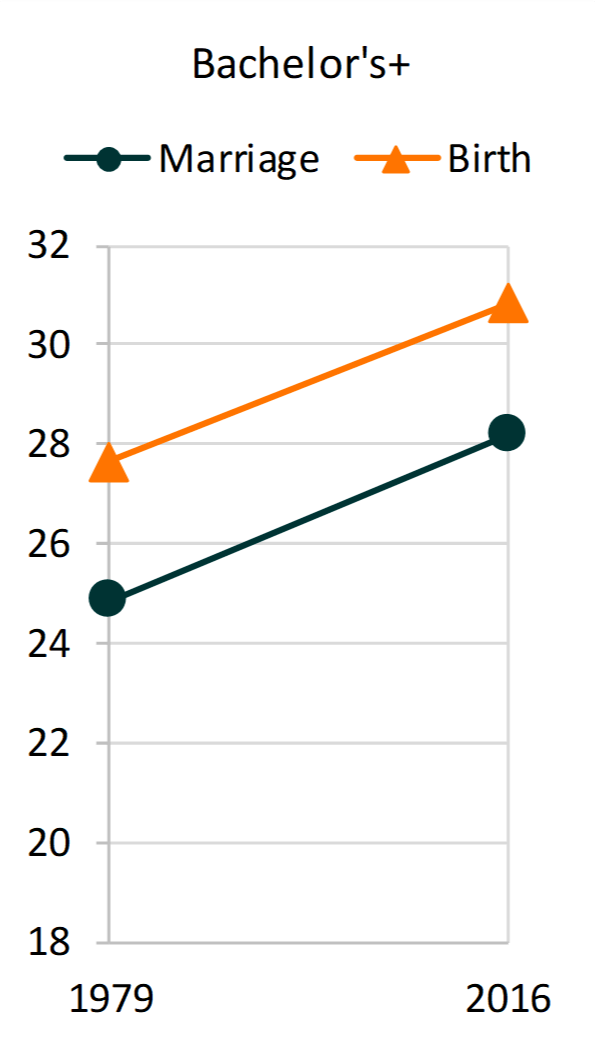
The age at first birth and age at first marriage increased across education levels, but with striking variation in patterns and levels. In 2016, the age at marriage was more similar across education groups than the age at birth. The education levels were measured at time of the event.
- Among women who had less than a high school education, the median age at first birth was younger than the median age of marriage in both 1979 and 2016, and the gap has grown.
- A crossover in the ages at first marriage and birth occurred between 1979 and 2016 for women who reported a high school education and some college education. The gap in the age at first birth and marriage grew more for those with a high school degree than those with some college.
- College educated women experienced parallel increases in their ages at first marriage and birth meaning the gap in age at marriage and birth persisted. The age at marriage remained consistently about three year younger than the age at first birth.
Figure 3. Women’s Median Ages at First Marriage and at First Birth in 1979 & 2016, by Educational Attainment
Source: NCFMR Analyses of Age at Marriage: 1979 & 2016 CPS Fertility Supplement; Age at Birth: National Center for Health Statistics (1979 & 2016)
Data Sources
- Minnesota Population Center. Integrated Public Use Microdata Series, International: Version 7.1 [dataset]. Minneapolis, MN: IPUMS, 2018. https://doi.org/10.18128/D020.V7.1
Citations
- Eickmeyer, K. J., Payne, K. K., Brown, S. L., & Manning, W. D. (2017). Crossover in the median ages at first marriage and first birth: Thirty-five years of change. Family Profiles, FP-17-22. Bowling Green, OH: National Center for Family & Marriage Research. https://doi.org/10.25035/ncfmr/fp-17-22.
- Hayford, S. R., Guzzo, K. B., & Smock, P. J. (2014). The decoupling of marriage and parenthood? Trends in the timing of marital first births, 1945-2002. Journal of Marriage and Family, 76(3), 520-538.
Suggested Citation
- Hemez, P. (2019). Family formation experiences: Women’s median ages at first marriage and first birth, 1979 & 2016. Family Profiles, FP-19-16. Bowling Green, OH: National Center for Family & Marriage Research. https://doi.org/10.25035/ncfmr/fp-19-16
This project is supported with assistance from Bowling Green State University. From 2007 to 2013, support was also provided by the U.S. Department of Health and Human Services, Office of the Assistant Secretary for Planning and Evaluation. The opinions and conclusions expressed herein are solely those of the author(s) and should not be construed as representing the opinions or policy of any agency of the state or federal government.
Updated: 04/06/2021 02:08PM


