Family Formation Experiences: Shares of Women Who Married and Had a Birth, 1979 & 2016
Family Profile No. 15, 2019
Author: Paul Hemez
Family formation experiences have shifted over the past several decades. Marriage, for example, has become increasingly postponed while childbearing prior to a marriage has become more common (FP-17-22; FP-17-04). This Family Profile series (companion profile is FP-19-16) examines differences in marriage and parenthood experiences over the past 37 years among women holding different demographic characteristics. The current Family Profile uses the 1979 and 2016 Fertility Supplement of the Current Population Survey to explore trends in the percentage of women who experienced marriage and the share who had a birth by the end of their childbearing years (ages 40-44). This represents the experiences of women born from 1935 to 1939, which we refer to as the Silent Generation, and women born from 1972 to 1976, whom we label Gen-X. These generational terms are used for descriptive purposes to distinguish between the two cohorts of women. Shares are estimated across racial/ethnic and educational attainment groups.
Changes in the Shares of Women Who Married and Gave Birth
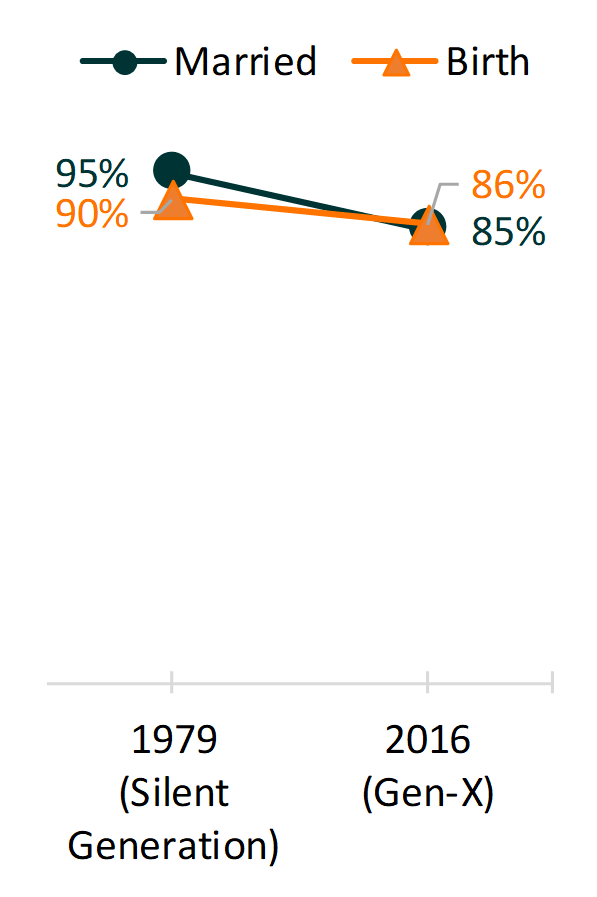
The vast majority of both groups of women married or had a child (Figure 1). The decline in marriage was greater than the decline in the share of women who gave birth.
- Silent Generation women more often married than had a birth, whereas among Gen-Xers, having a birth was a more common experience than marriage.
Figure 1. Shares of Silent Generation and Gen-X Women (40-44) Who Ever Married and Had a Birth in 1979 & 2016
Source: NCFMR analyses of 1979 & 2016 CPS Fertility Supplement
Race/Ethnicity
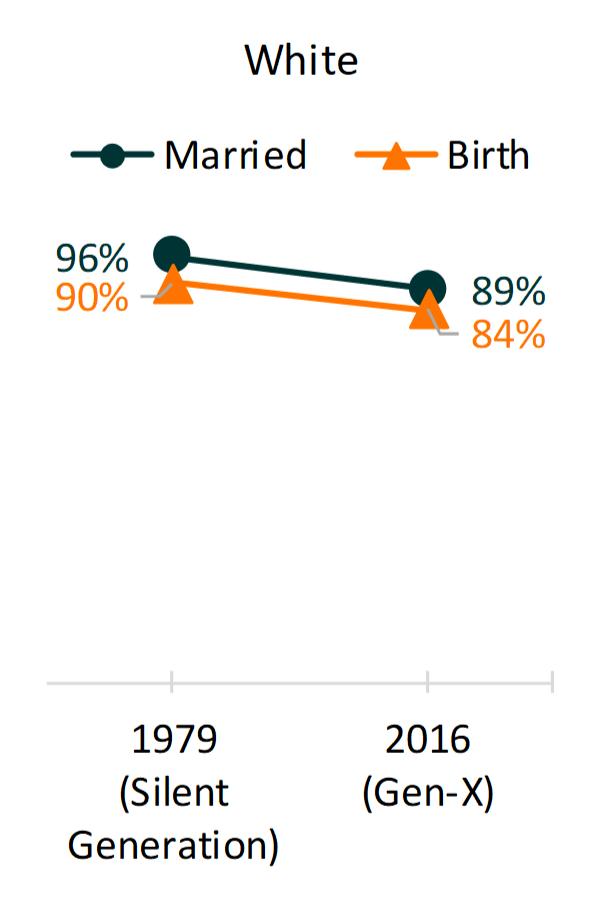
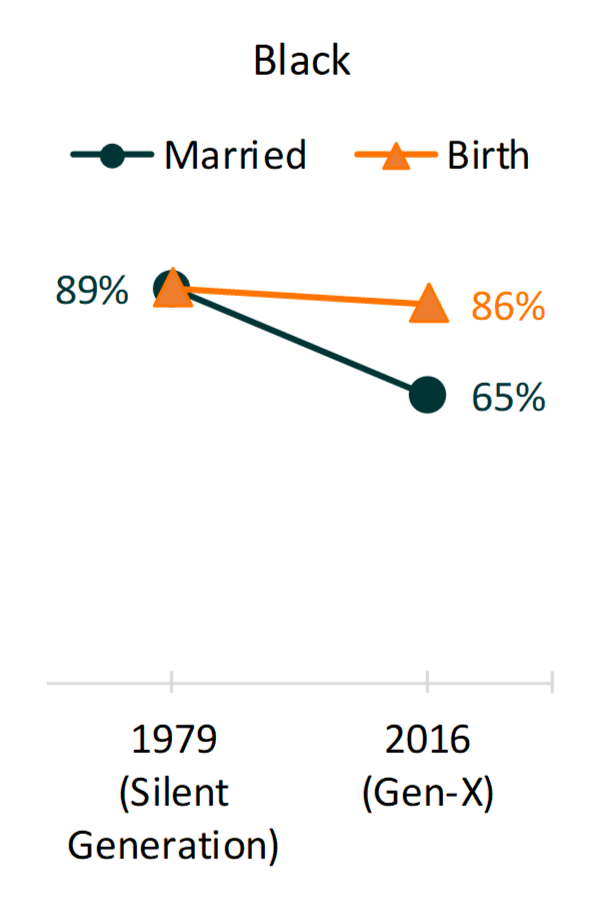
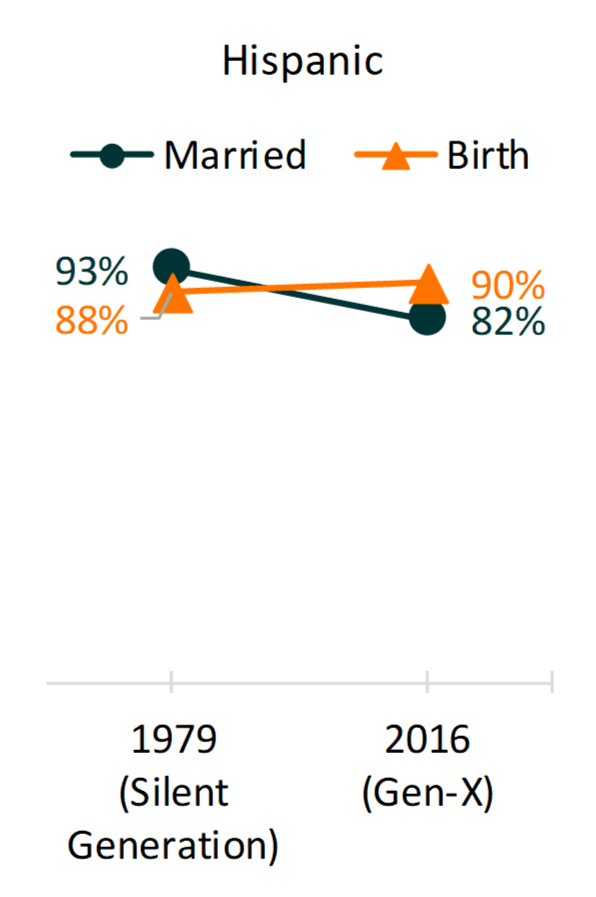
Wide variation in racial/ethnic patterns of family formation are evident in Figure 2.
- Among White women, there were only slight declines in the share of women who married and had a birth between Silent Generation and Gen-Xer women.
- Similar shares of Black women in both generations had a birth, but the share who married declined dramatically. About 89% of Black Silent Generation women had married, while only 65% of Gen-Xers had married by the same age.
- Silent Generation Hispanic women experienced marriage more often than a birth, but Gen-Xers more often had a birth than married.
Figure 2: Shares of Silent Generation and Gen-X Women (40-44) Who Ever Married and Had a Birth in 1979 & 2016, by Race/Ethnicity
Source: NCFMR analyses of 1979 & 2016 CPS Fertility Supplement
Educational Attainment
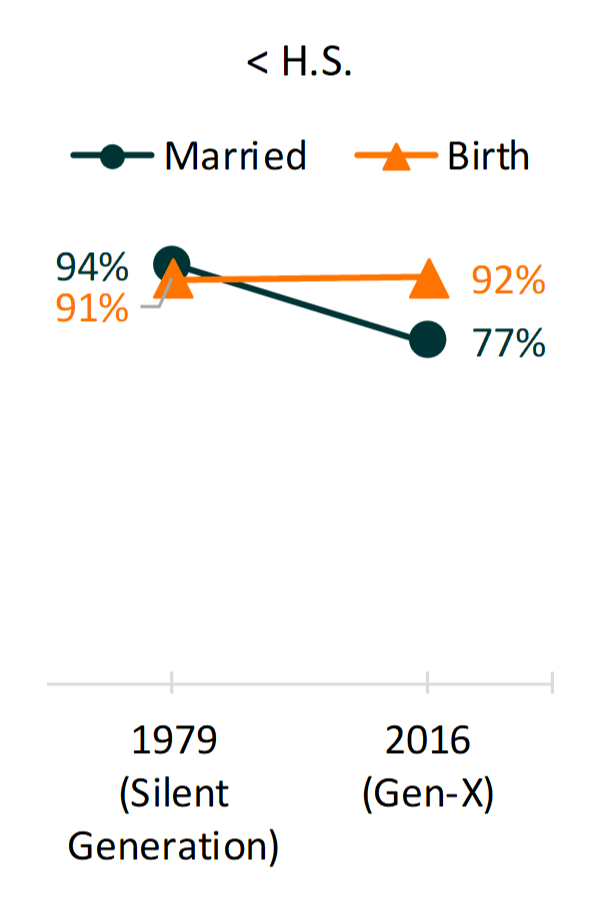
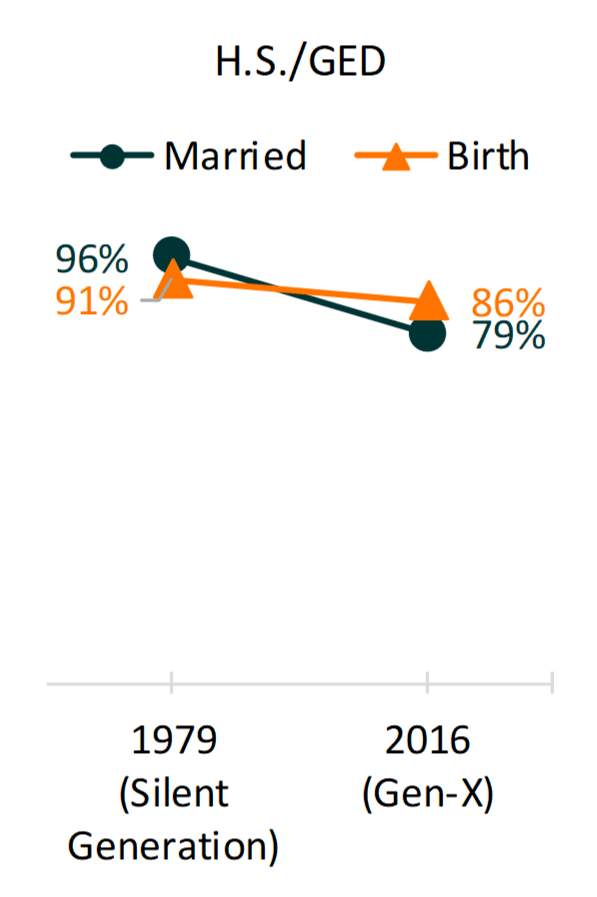
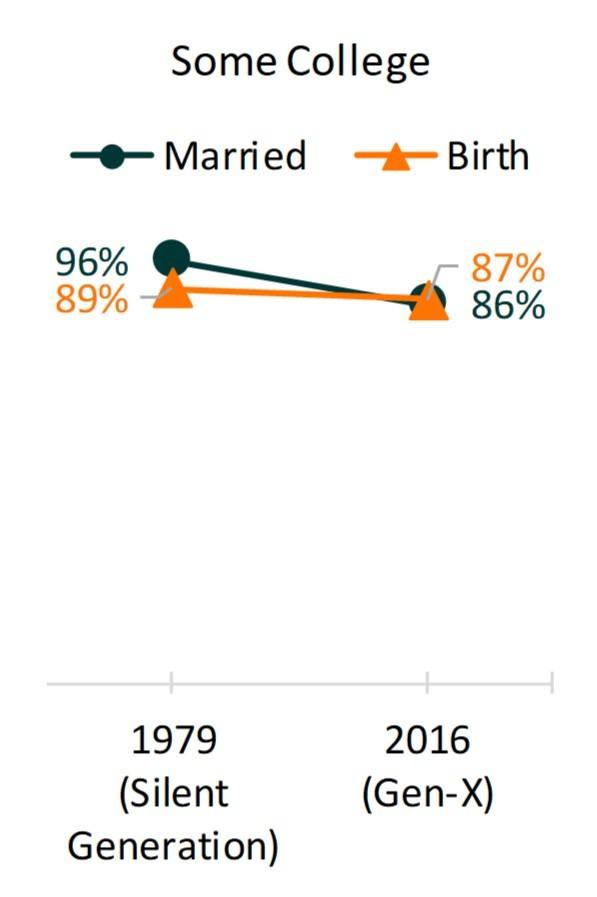
Declines in the share of women who married are greatest for women with modest levels of education (high school or below). For example, 96% of Silent Generation women with a high school degree married whereas only 79% of Gen-Xers with a high school degree did so.
- The gap in the share of women who married and had a birth was greatest for Gen-Xers without a high school degree, as 92% of these women had a child and 77% married.
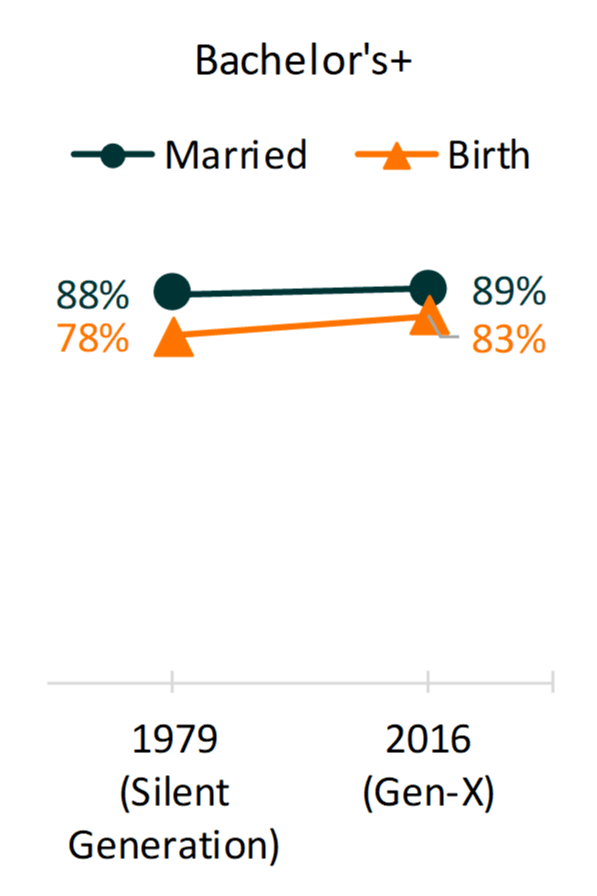
- Among college-educated women, both marriage and childbearing became slightly more common and marriage was more often experienced than a birth.
Figure 3. Shares of Silent Generation and Gen-X Women (40-44) Who Ever Married and Had a Birth in 1979 & 2016, by Educational Attainment
Source: NCFMR analyses of 1979 & 2016 CPS Fertility Supplement
Data Sources
- Minnesota Population Center. Integrated Public Use Microdata Series, International: Version 7.1 [dataset]. Minneapolis, MN: IPUMS, 2018. https://doi.org/10.18128/D020.V7.1
Citations
- Eickmeyer, K. J., Payne, K. K., Brown, S. L., & Manning, W. D. (2017). Crossover in the median ages at first marriage and first birth: Thirty-five years of change. Family Profiles, FP-17-22. Bowling Green, OH: National Center for Family & Marriage Research. https://doi.org/10.25035/ncfmr/fp-17-22.
- Wu, H. (2017). Trends in births to single and cohabiting mothers, 1980-2014. Family Profiles, FP-17-04. Bowling Green, OH: National Center for Family & Marriage Research. https://www.bgsu.edu/ncfmr/resources/data/family-profiles/wu-trends-births-single-cohabiting-mothers-fp-17-04.html
Suggested Citation
- Hemez, P. (2019). Family formation experiences: Shares of women who married and had a birth, 1979 & 2016. Family Profiles, FP-19-15. Bowling Green, OH: National Center for Family & Marriage Research. https://doi.org/10.25035/ncfmr/fp-19-15.
This project is supported with assistance from Bowling Green State University. From 2007 to 2013, support was also provided by the U.S. Department of Health and Human Services, Office of the Assistant Secretary for Planning and Evaluation. The opinions and conclusions expressed herein are solely those of the author(s) and should not be construed as representing the opinions or policy of any agency of the state or federal government.
Updated: 04/06/2021 02:08PM

