Twenty Years of Change in Unintended Births
Family Profile No. 1, 2021
Author: Karen Benjamin Guzzo
Although unintended childbearing has declined in recent years (Finer and Zolna, 2016; Jones and Jerman, 2017), reducing unintended childbearing remains a public health goal in the U.S. due to its links to poorer outcomes for mothers, children, and families (Healthy People 2030). In this profile, we investigate trends in birth intendedness among women 15-44 between 1997 and 2018 using the 2002, 2006-10, 2011-15, and 2015-19 cycles of the National Survey of Family Growth(1). Birth intendedness is based on a series of questions in which women were asked to characterize each birth as on time, mistimed (wanted but occurring earlier than desired), or unwanted (the respondent did not want any births at all or no additional births). When births were reported as mistimed, women were asked how much earlier than desired the birth occurred, and we categorize mistimed births into two groups: slightly mistimed (less than two years earlier than desired) or seriously mistimed (two or more years too early). This profile is an update of FP-17-08 and is the first in a three-part series on unintended fertility in the U.S.
Trends in Birth Intendedness
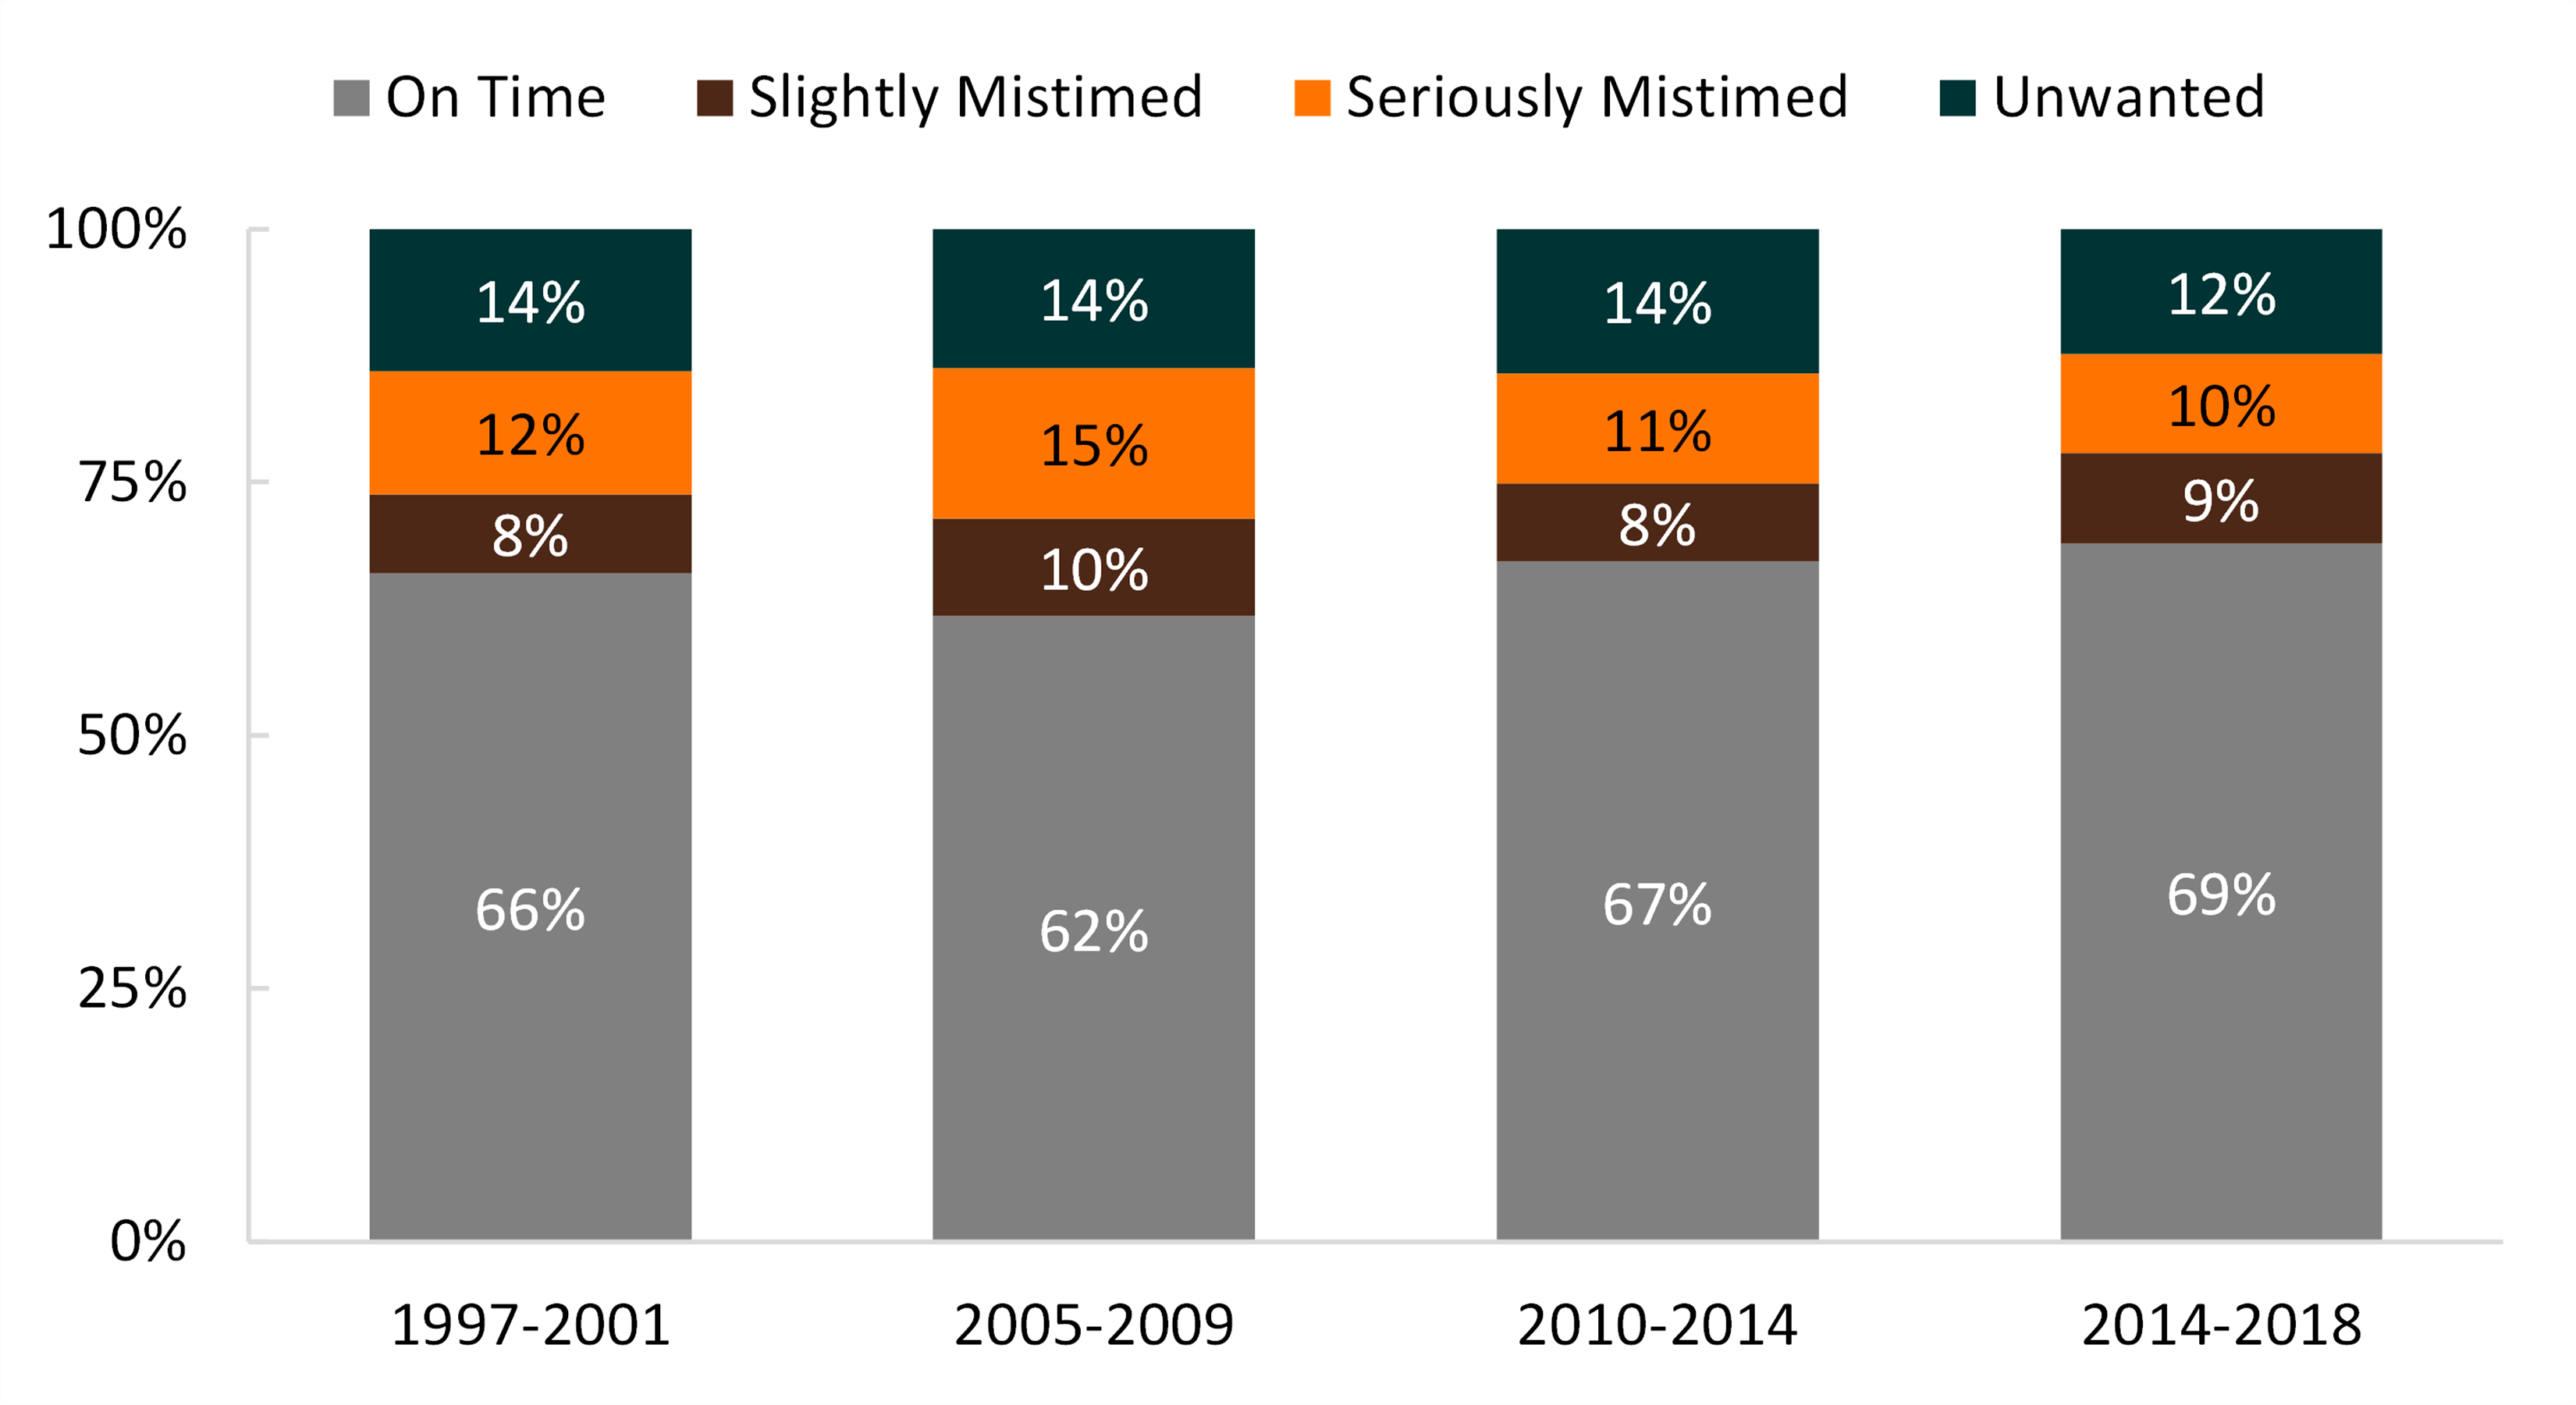
In all time periods, the majority of births were characterized as on time.
- More than two thirds (69%) of births that occurred during 2014-2018 were on time, up from a low of 62% between 2005 and 2009.
- Across the birth cohorts, about two out of ten births were mistimed. The proportion of births that were mistimed (slightly and seriously) peaked in 2005-2009 at 25%.
- Between 1997 and 2014, one in seven (14%) births was unwanted, falling to 12% for the 2014-2018 period.
- Among unintended births (all mistimed and unwanted), about two-fifths were unwanted in 2014-2018.
- Among unintended births (all mistimed and unwanted), about two-fifths were unwanted in 2014-2018.
Figure 1. Trends in Birth Intendedness, 1997-2018

 In all time periods, the majority of births were characterized as on time.
Birth Order and Intendedness
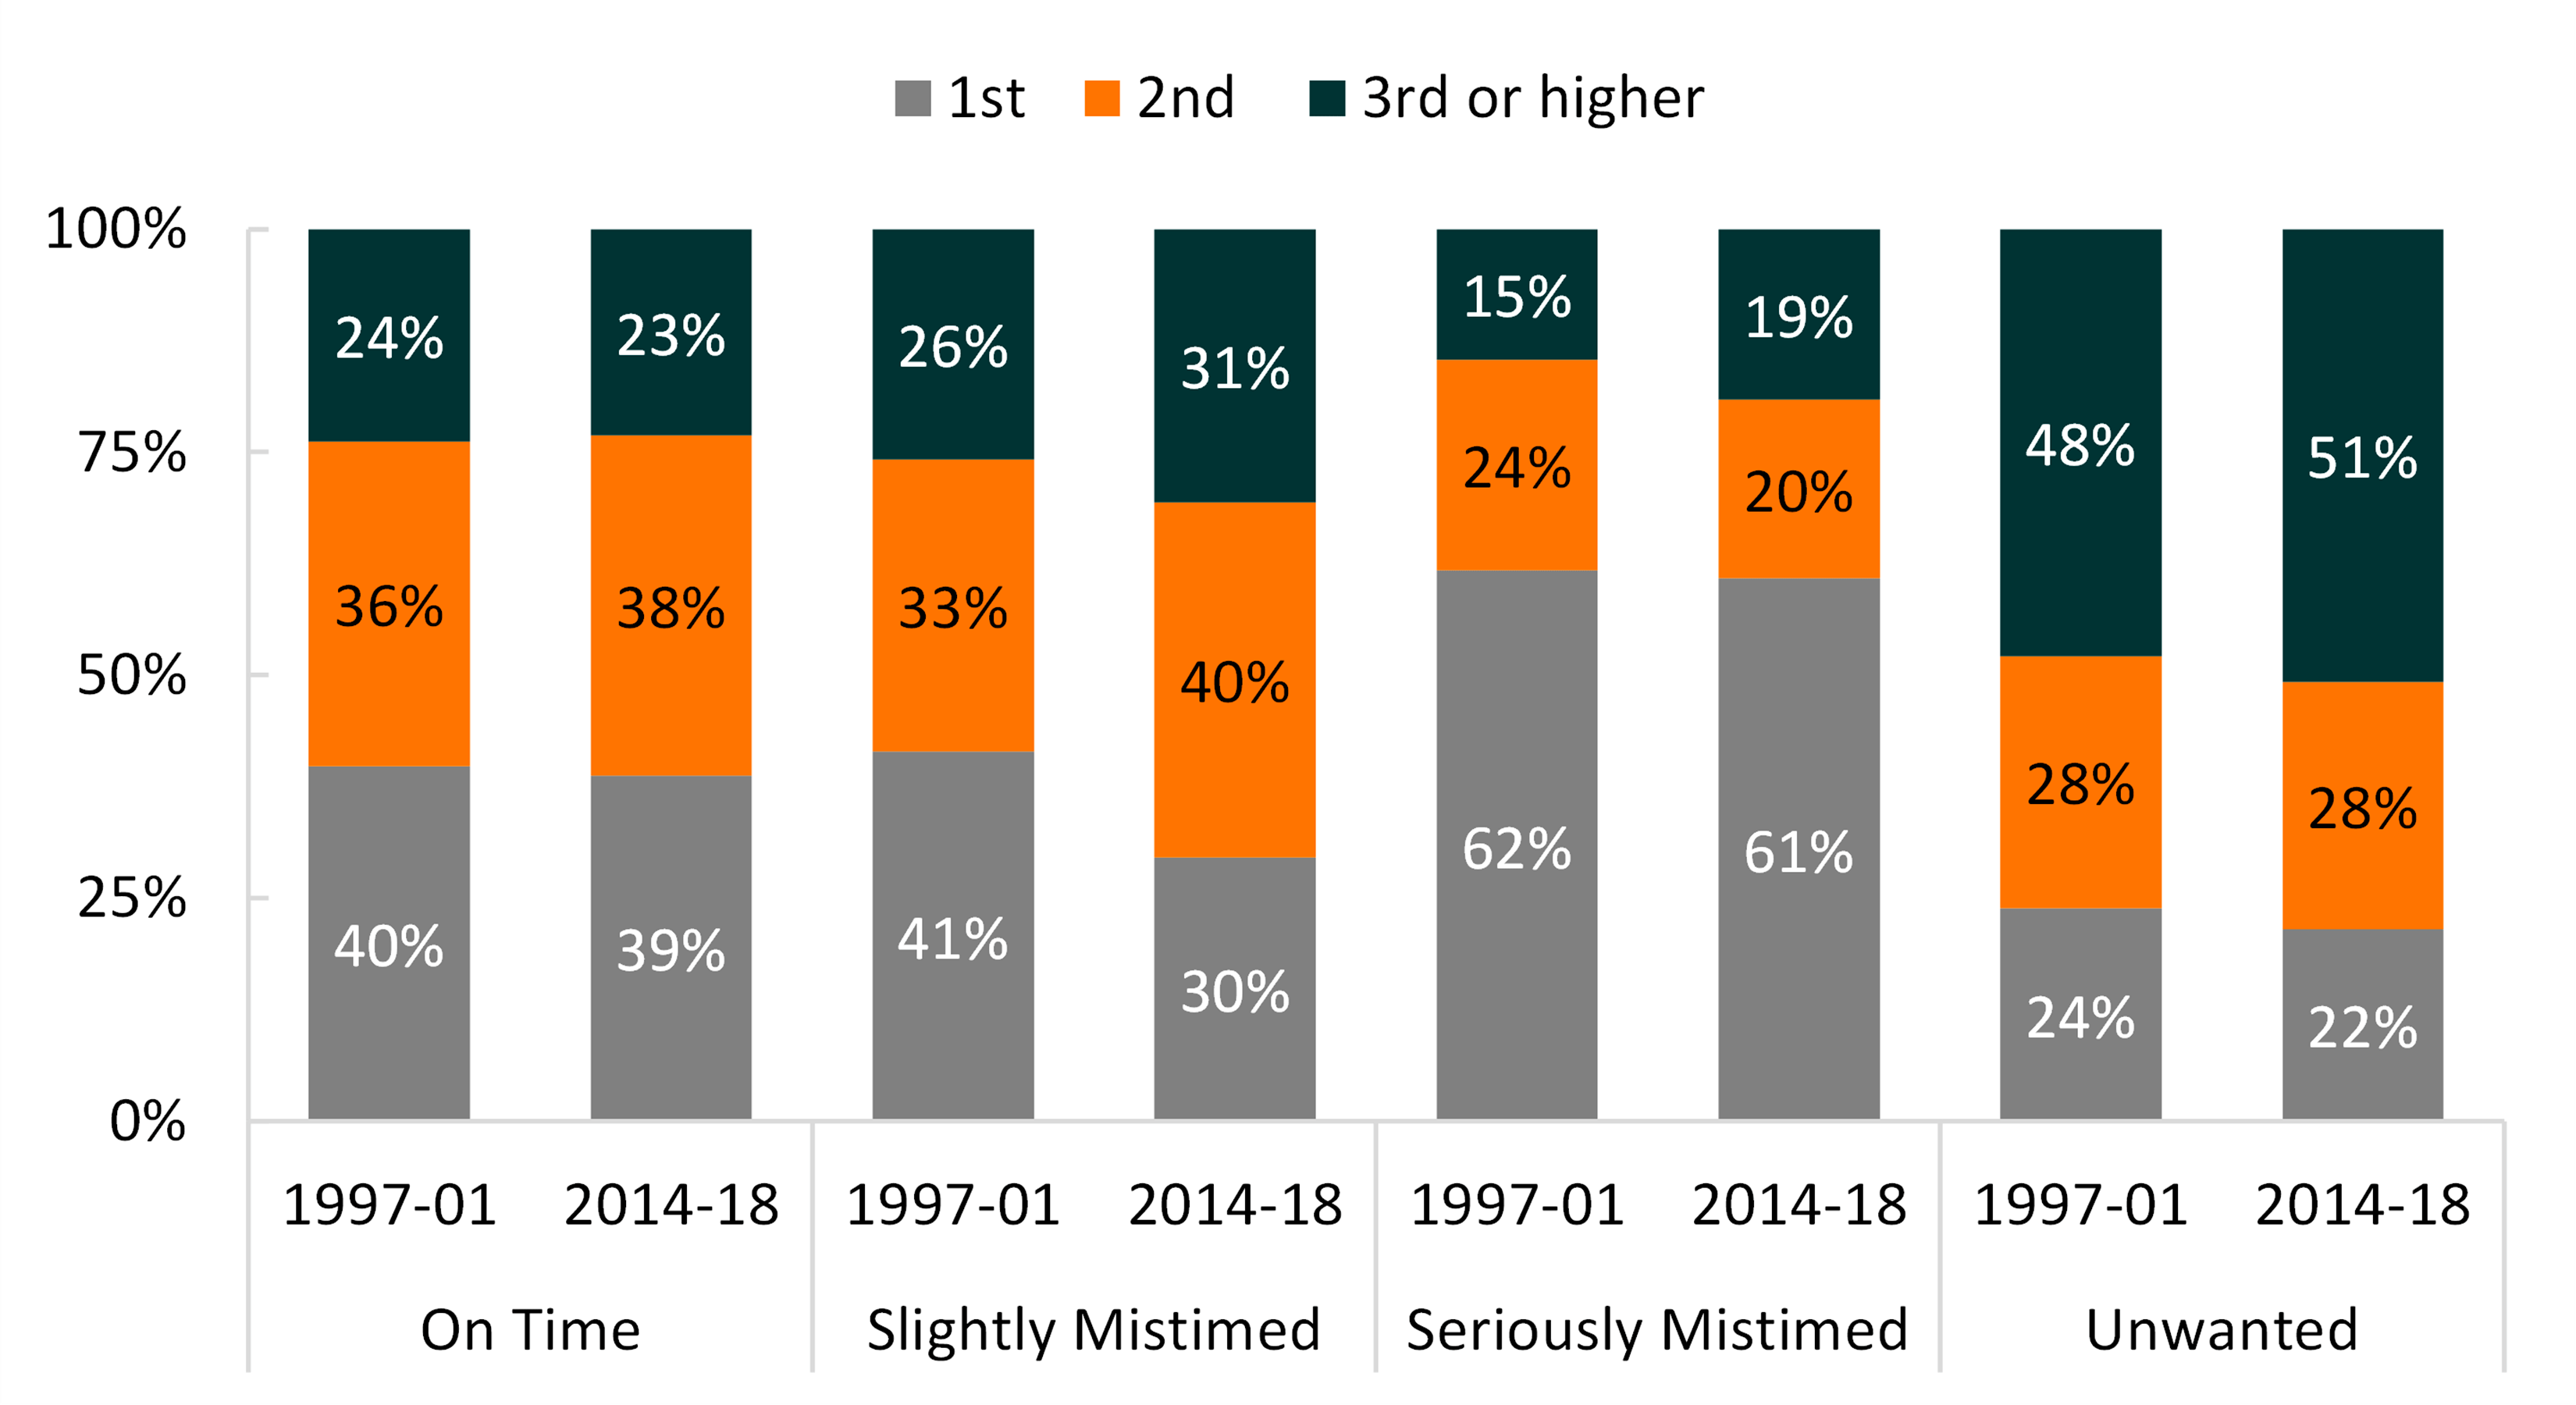
- Most on-time births were 1st or 2nd births, about three-quarters in both time periods.
- The percentage of slightly mistimed births that were 1st births declined from 41% to 30%.
- In 2014-2018, slightly mistimed were most often 2nd births.
- The majority of seriously mistimed births were 1st births (61-62%) in both birth cohorts.
- Just over half (51%) of unwanted births were 3rd births in the most recent period, up slightly from 48% in the late 1990s, accompanied by a small decline in the proportion that were 1st births.
Figure 2: Trends in Birth Order by Birth Intendedness

Union Status and Intendedness
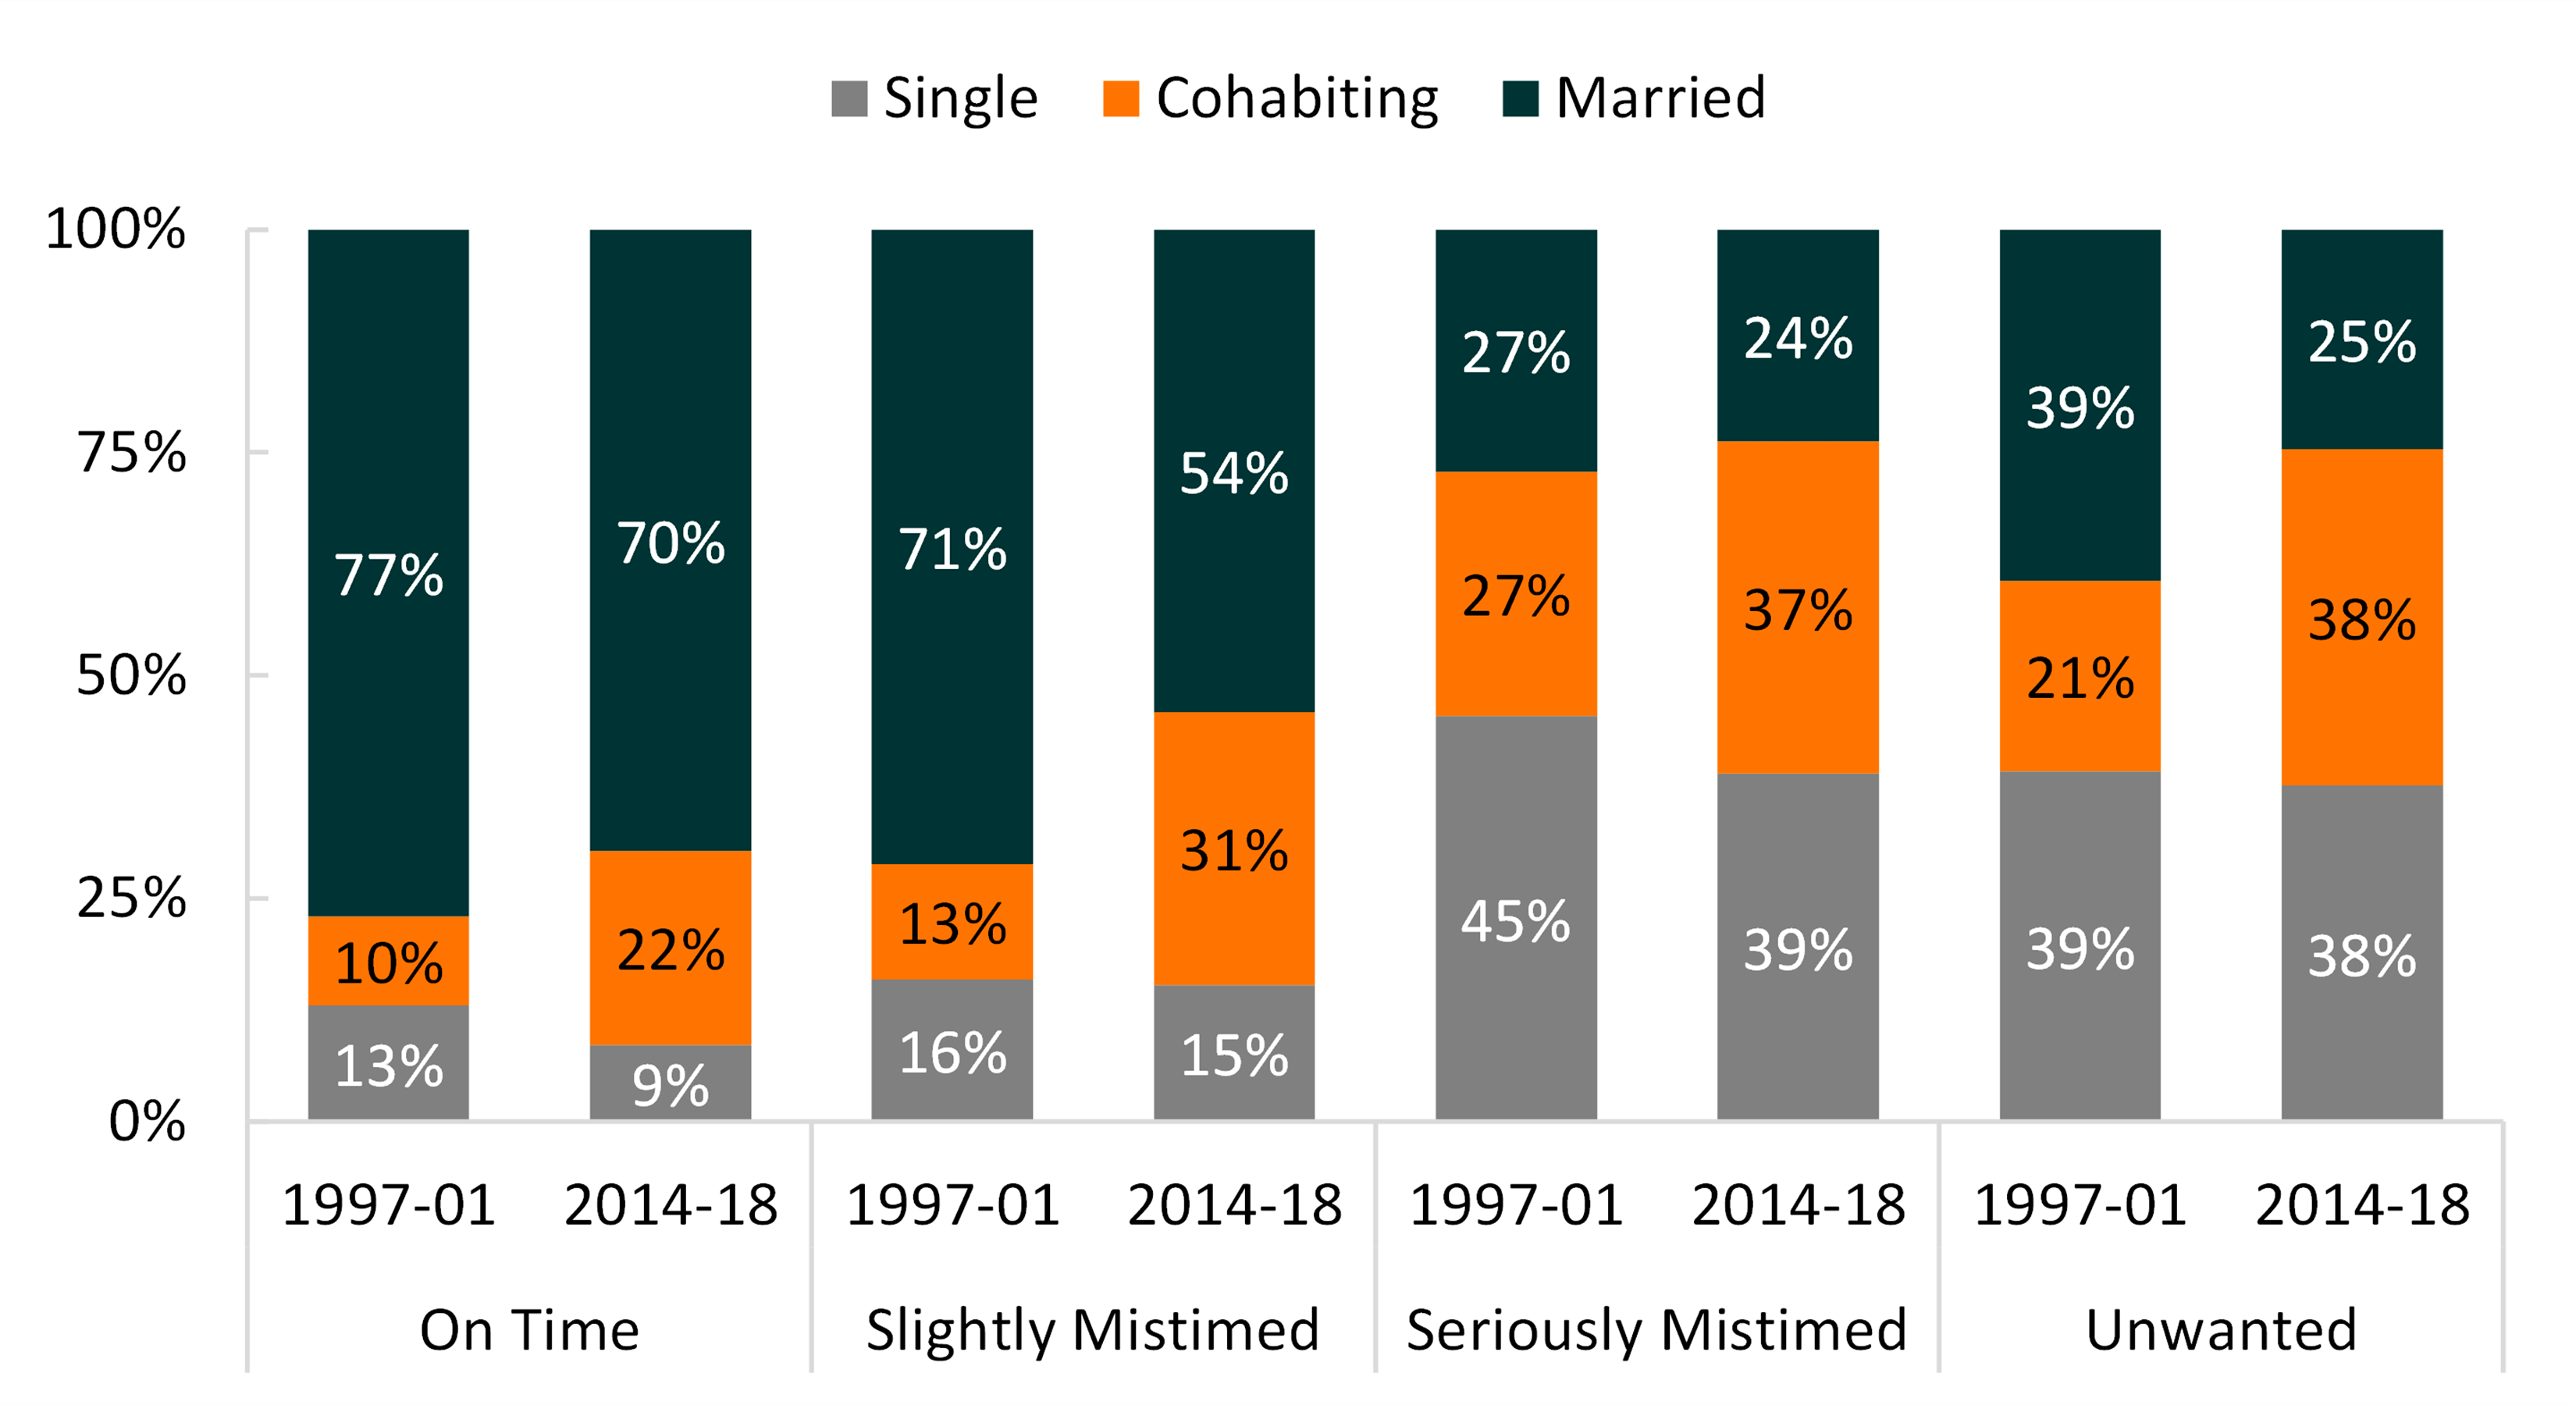
- The overwhelming majority of on-time births in both periods were to married women. Marital on-time births declined from 77% to 70%, whereas cohabiting on-time births doubled from 10% to 22%.
- The majority of slightly mistimed births were also marital births in both periods, but the decline in the proportion of marital births was larger, decreasing from 71% among births in the late 1990s to 54% in the most recent birth cohort.
- The proportion of slightly mistimed births to cohabiting women more than doubled, rising from 13% to 31%.
- Seriously mistimed births occurred most often to single women in both time periods.
- In the late 1990s, unwanted births occurred most often among single or married women, with only one in five occurring to cohabiting women. By 2014-2018, only one in four such births was to a married woman, with the remaining split among cohabiting and single women.
Figure 3: Trends in Union Status by Birth Intendedness

Data Sources
- National Center for Health Statistics (NCHS). 2015-17 and 2017-2019 National Survey of Family Growth Public-Use Data and Documentation. Hyattsville, MD: CDC National Center for Health Statistics. https://www.cdc.gov/nchs/nsfg/index.htm
References
- Healthy People 2030 (2021). Reduce the proportion of unintended pregnancies, FP-01. Washington, DC: U.S. Department of Health and Human Services, Office of Disease Prevention and Health Promotion. Healthy People 2030 | health.gov Accessed 1/7/21.
- Finer, L. B., & Zolna, M. R. (2016). Declines in unintended pregnancy in the United States, 2008–2011. New England Journal of Medicine, 374(9), 843-852.
- Guzzo, K. B. (2017). A quarter century of change in unintended births. Family Profiles, FP-17-08. Bowling Green, OH: National Center for Family & Marriage Research. https://doi.org/10.25035/ncfmr/fp-17-08
- Jones, R. K., & Jerman, J. (2017). Abortion incidence and service availability in the United States, 2014. Perspectives on Sexual and Reproductive Health, 49(1), 17-27.
Suggested Citation
- Guzzo, K. B. (2021). Thirty years of change in unintended births. Family Profiles, FP-21-01. Bowling Green, OH: National Center for Family & Marriage Research. https://doi.org/10.25035/ncfmr/fp-21-01
Footnote
1. Unlike earlier cycles, the 2015-19 NSFG includes respondents up to age 49. For comparability with earlier cycles, the analyses in this profile restricted NSFG to women 45 and younger.


This project is supported with assistance from Bowling Green State University. From 2007 to 2013, support was also provided by the U.S. Department of Health and Human Services, Office of the Assistant Secretary for Planning and Evaluation. The opinions and conclusions expressed herein are solely those of the author(s) and should not be construed as representing the opinions or policy of any agency of the state or federal government.
Updated: 05/17/2021 11:20AM

