Widowhood: Decades of Change, 1940-2018
Family Profile No. 23, 2020
Authors: Lisa Carlson & Valerie Schweizer
Sociodemographic variation is evident not just in marriage and divorce, but also widowhood. Using National Vital Statistics, Decennial Census, and American Community Survey data to cover the years 1940 to 2018, we document trends in the proportions of ever-married men and women who are widowed. Then, focusing on women (who experience higher levels of widowhood than men), we examine variation in widowhood across race/ethnicity, education, and age. The proportion of ever-married adults who are widowed reflects not only change in the widowhood rate, but also the changing propensity for widow(er)s to remarry and exit the widowed state. For more information on changes in marital statuses over time, see our profiles on more than century of change in marriage (FP-20-21) and a more than a century of change in divorce (FP-20-22).
Change in the Share Widowed by Gender, 1940-2018
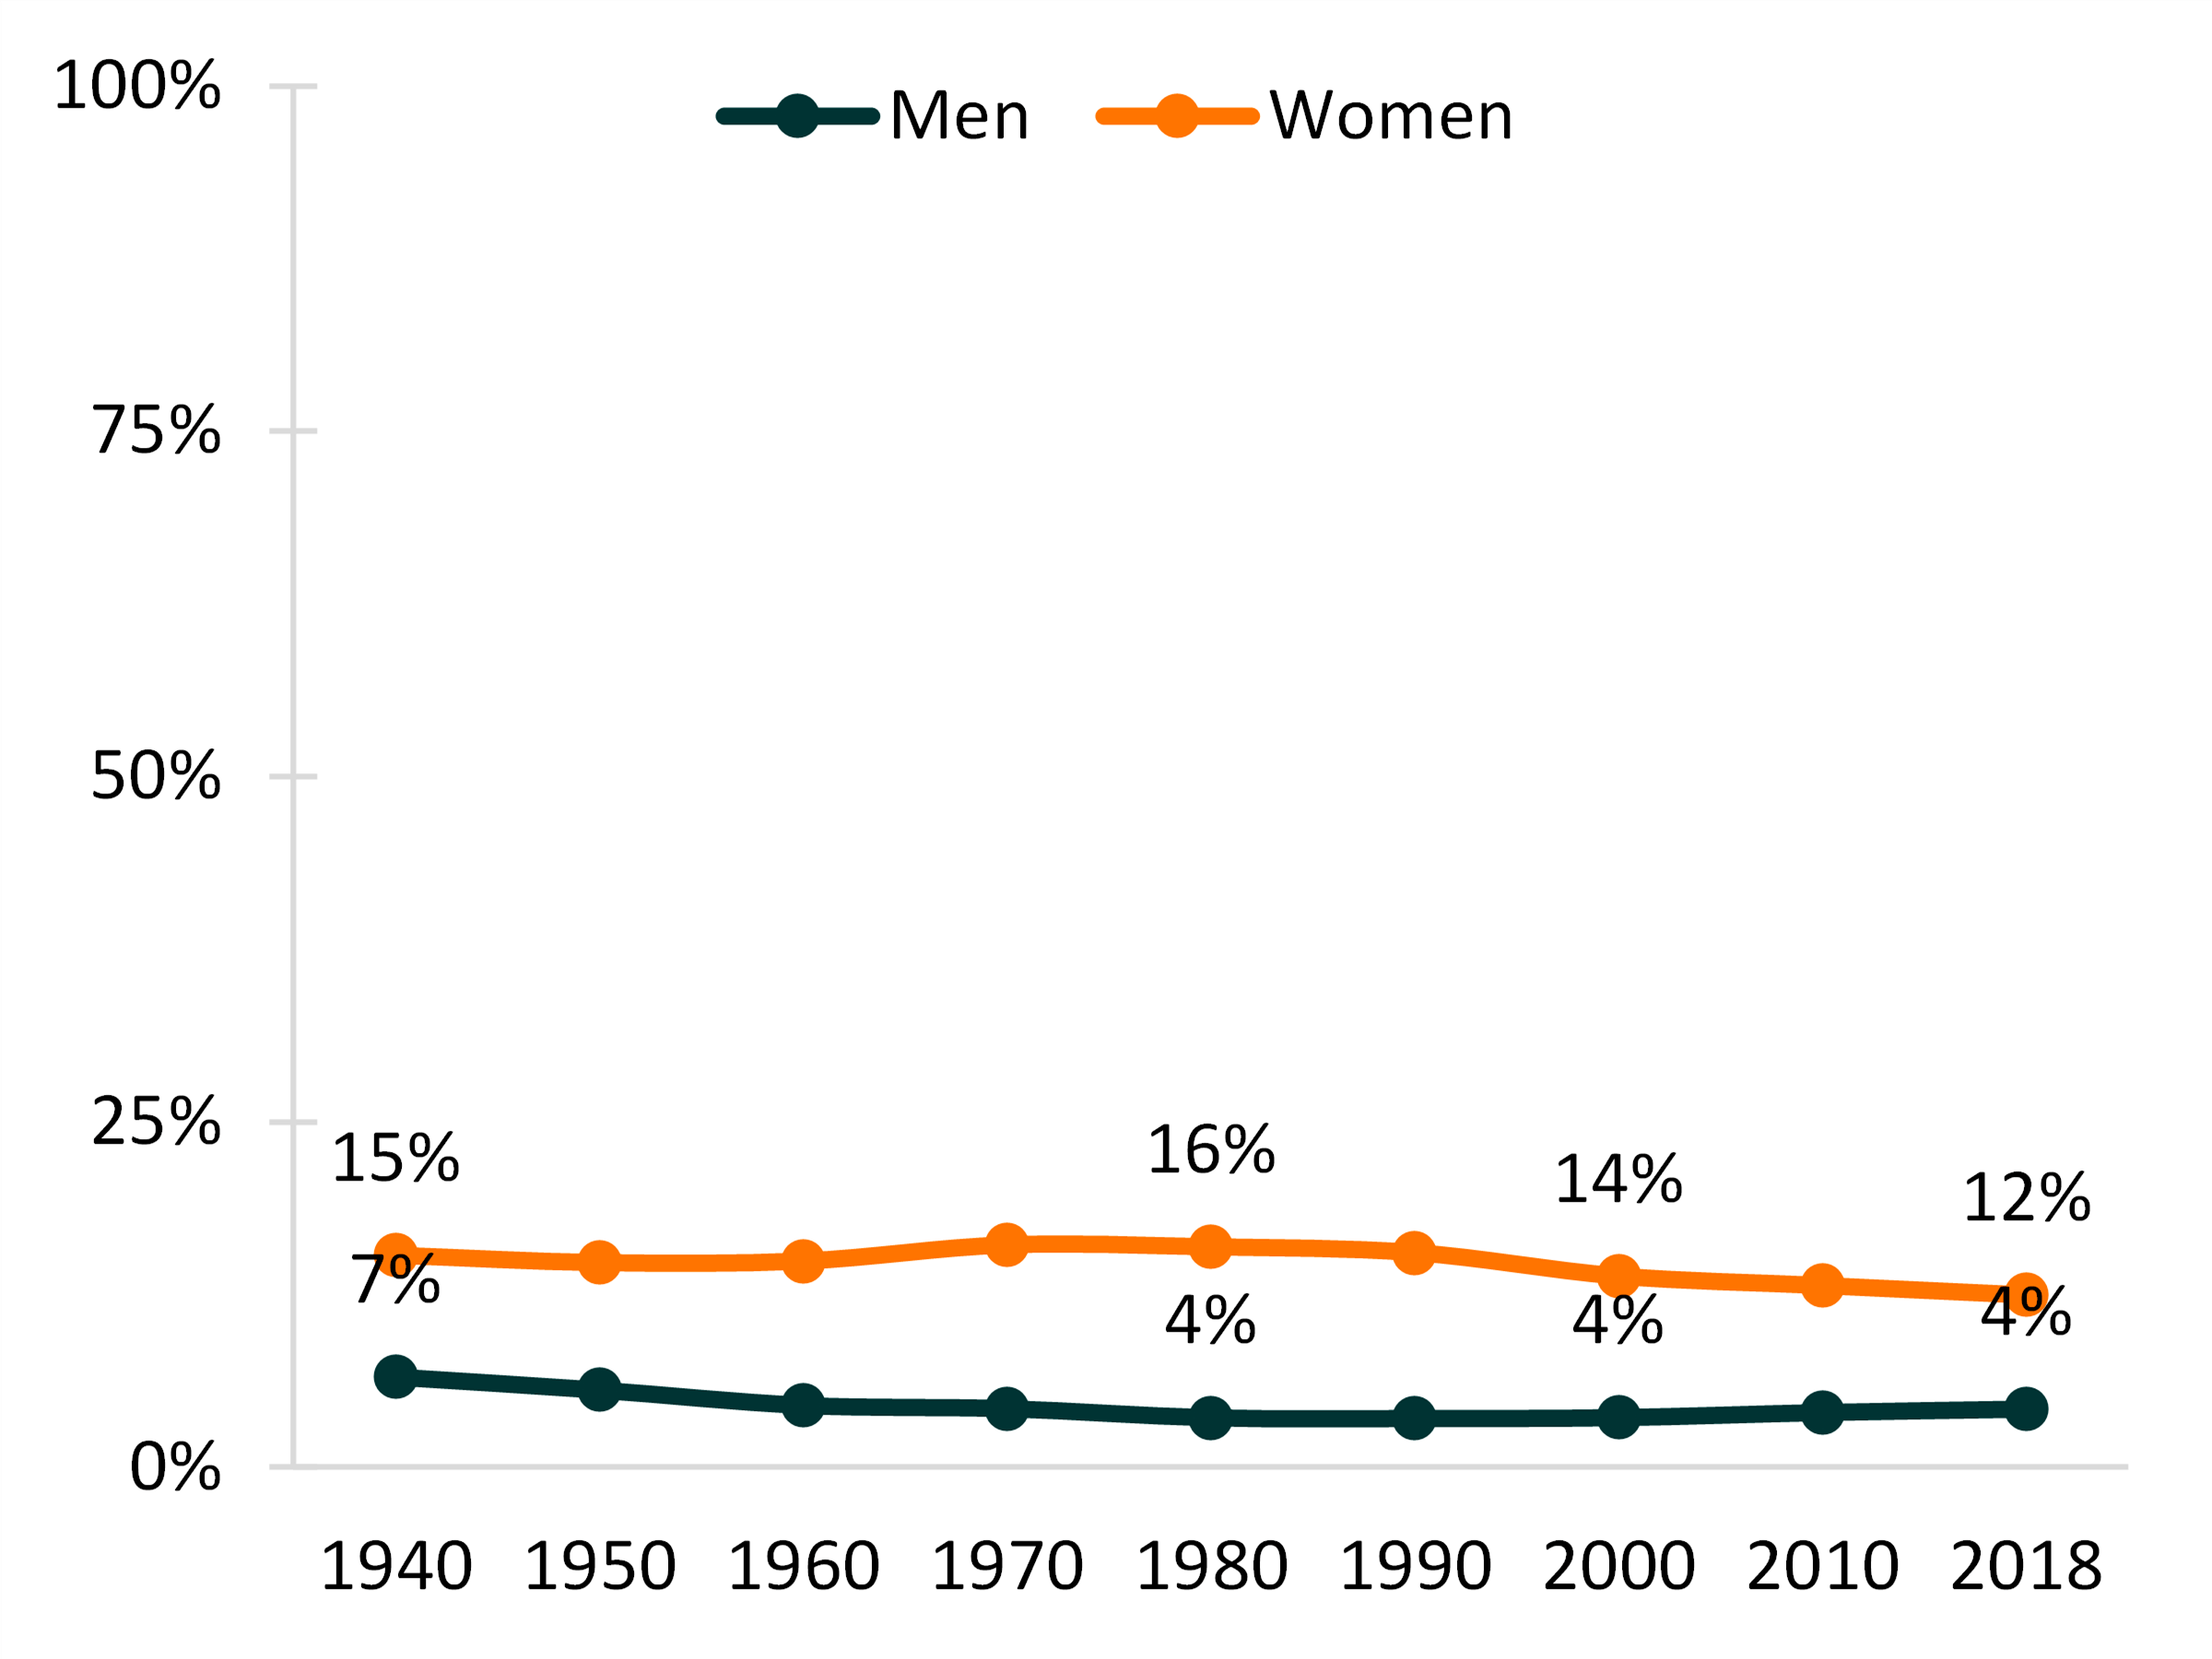
- Since the 1940s, among those ever married, the proportion of women who were currently widowed was consistently higher than the proportion of men who were currently widowed.
- The proportions currently widowed, overall, decreased for both ever-married men and women between 1940 and 2018.
- From the 1980s and on, the proportion of women currently widowed decreased (from 16% to 12%), while the proportion of men currently widowed remained constant (at 4%).
Figure 1. Proportions of Men and Women Currently Widowed Among Those Ever Married, 1940-2018

Change in the Share Widowed by Race/Ethnicity Among Ever-Married Women, 1940-2018
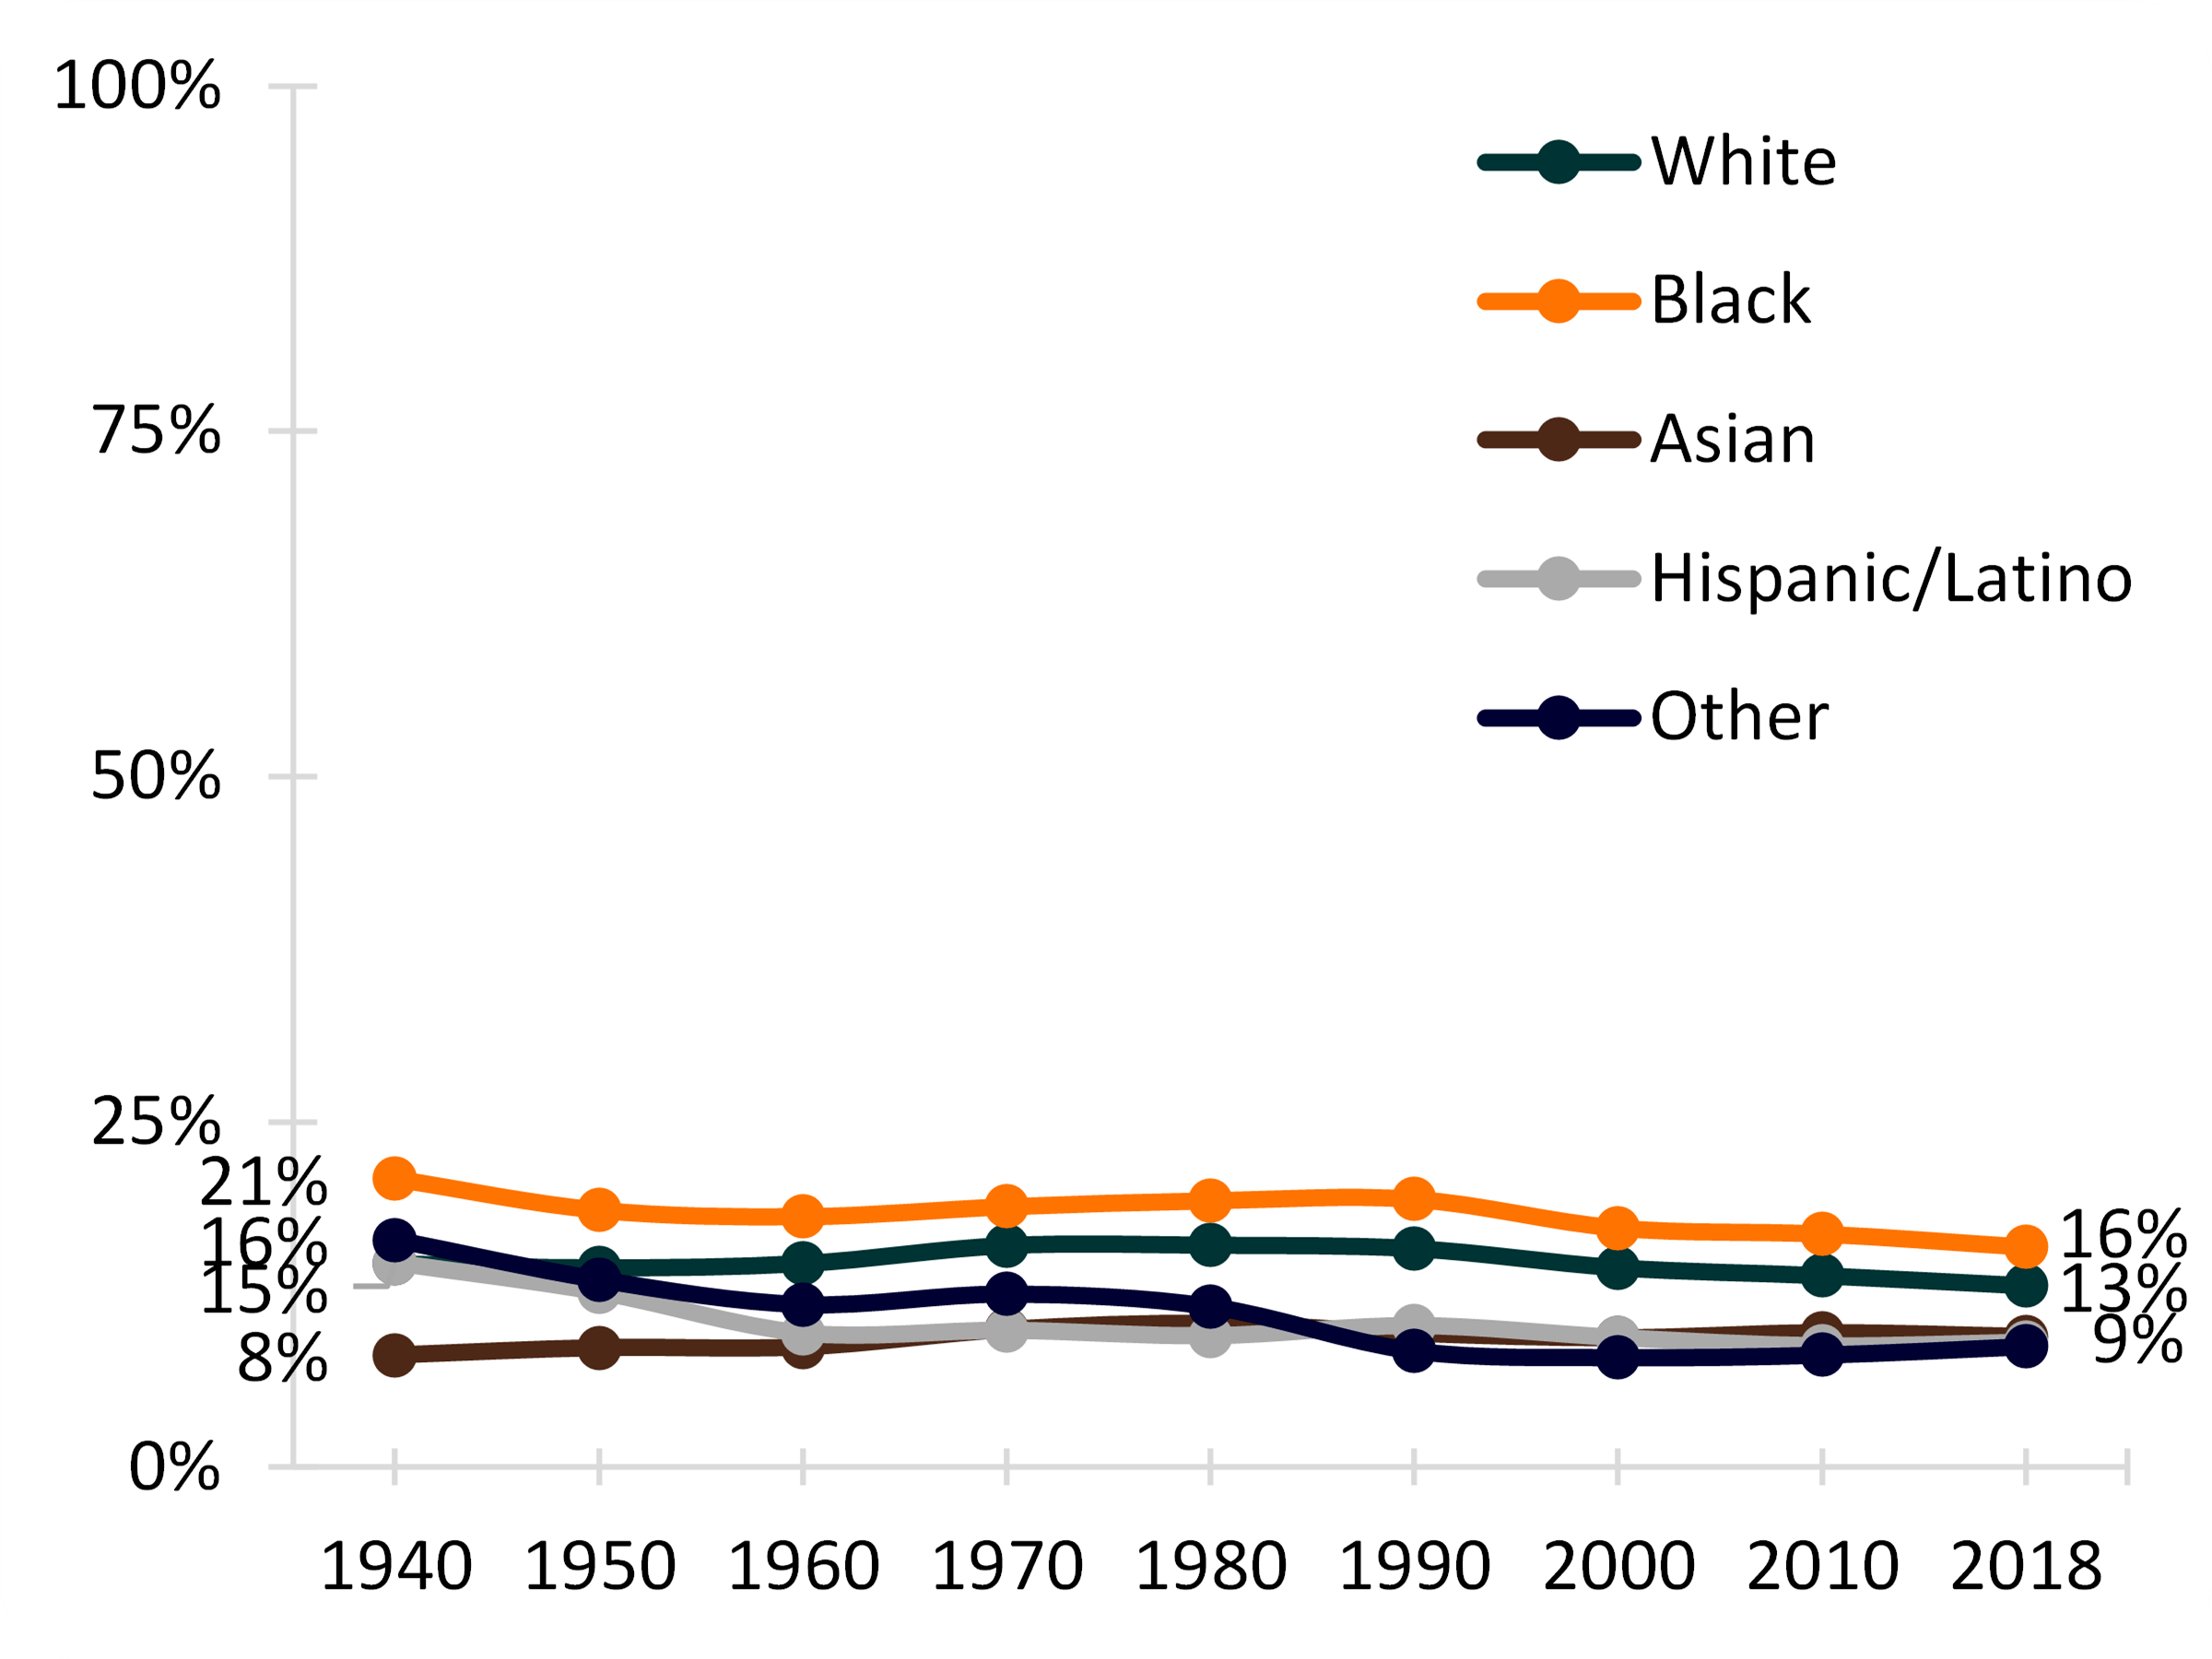
- For most racial/ethnic groups, the percentage of women currently widowed declined between 1940 and 2018.
- For Asian women, the percentage currently widowed increased slightly from 8% in 1940 to 9% in 2018.
- The differences between racial/ethnic groups in the percentage of women currently widowed has narrowed over time.
Figure 2. Percentage of Women Currently Widowed Among Ever-Married Women by Race/Ethnicity, 1940-2018

Change in the Share Widowed by Educational Attainment Among Ever-Married Women, 1940-2018
- There are significant differentials in the remarriage rates for men and women by race/ethnicity.
- In 2018, Asian men had the highest rate of remarriage (49 per 1,000), whereas White men had the lowest (35 per 1,000).
- Among men, the decline since 2008 was greatest for Asians–dropping by 17 percentage points.
- Among men, the decline since 2008 was greatest for Asians–dropping by 17 percentage points.
- Like their male counterparts, Asian women had the highest rate of remarriage (29 per 1,000). However, Black women had the lowest rate of remarriage at 15 per 1,000.
- Since 2008, Hispanic women experienced the greatest absolute decline in remarriage rate (30 versus 18 per 1,000).
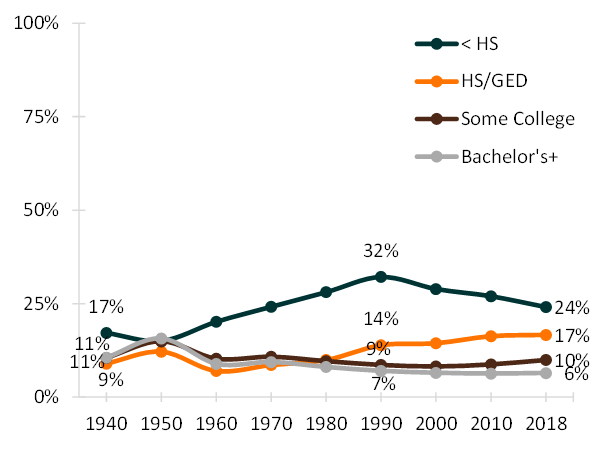
Figure 3. Percentage of Women Currently Widowed Among Ever-Married Women by Educational Attainment, 1940-2018

Change in the Share Widowed by Age Among Ever-Married Women Aged 50+, 1940-2018
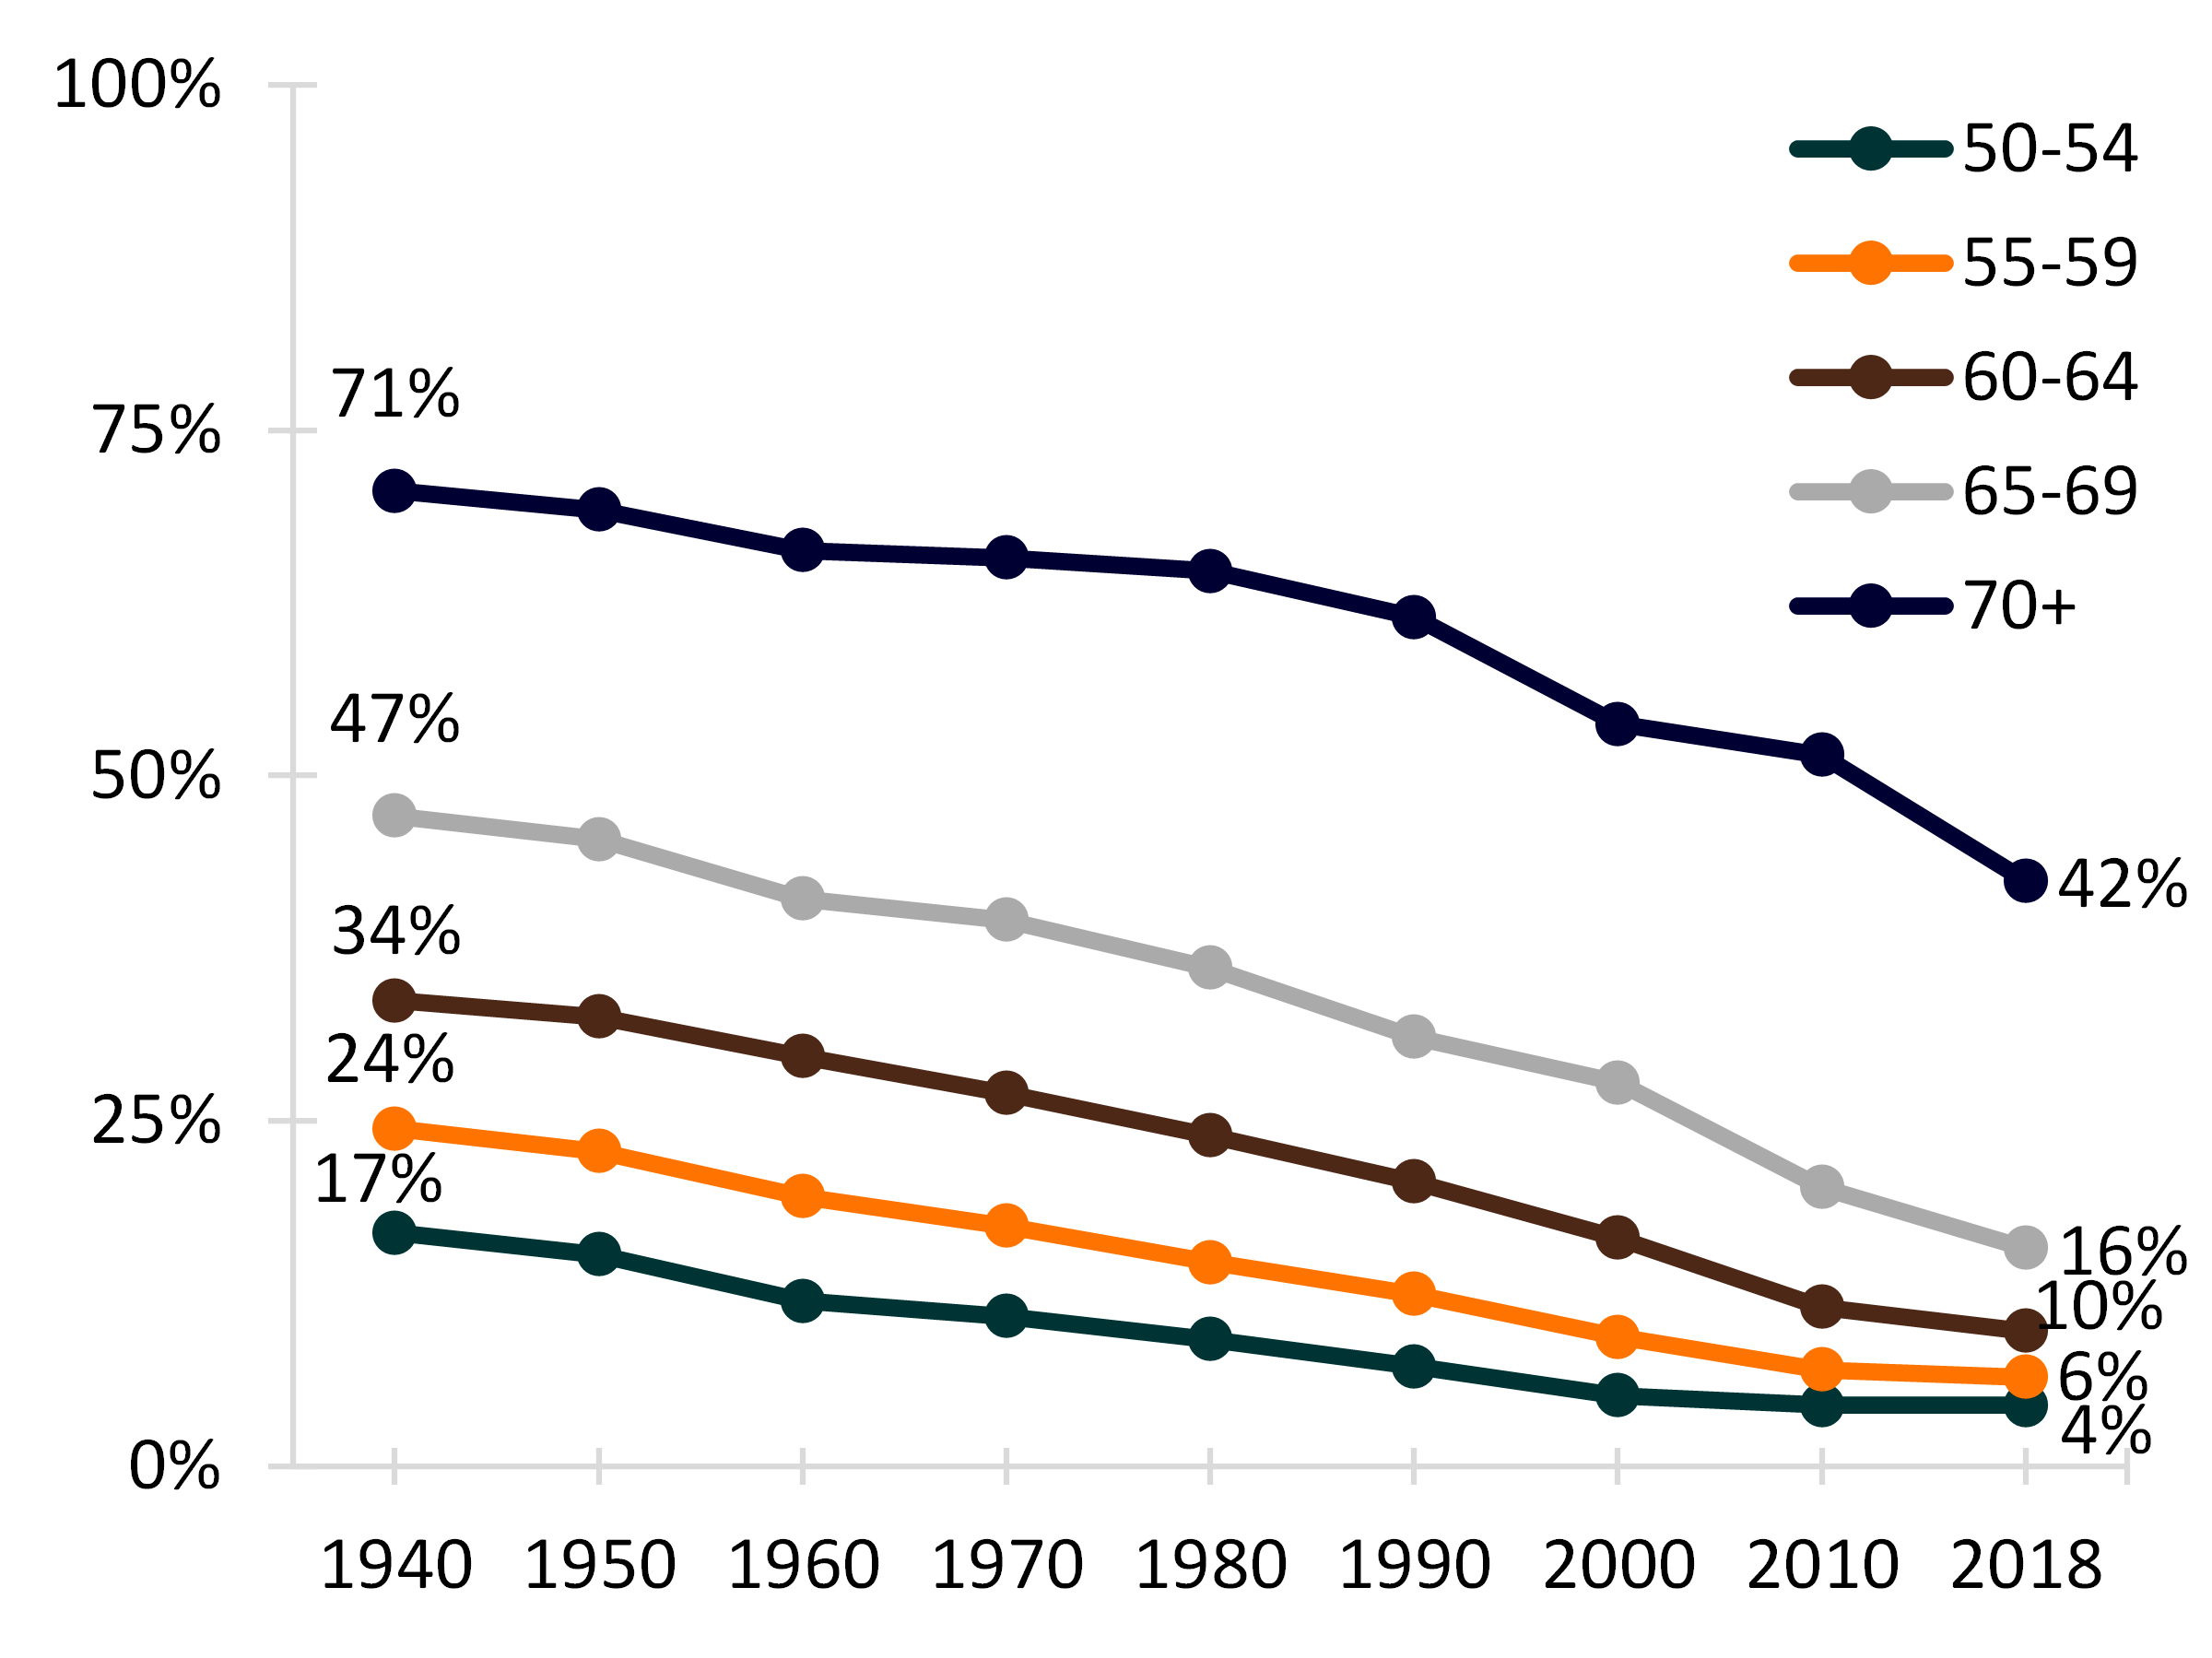
- Since the 1940s, the share of women currently widowed decreased dramatically for those aged 50 and older.1
- The largest percentage declines in the share of women who were currently widowed were among women in the younger age groups.
- Among women aged 50-54, and women 55-59, the shares of currently widowed were around four times as large in 1940 compared with 2018.
- The smallest decline in the share of currently widowed women was among women aged 70 and older--the share currently widowed is about 40% lower in 2018 compared to 1940.
Figure 4. Percentage of Women Currently Widowed Among Ever-Married Women by Age 50+, 1940-2018

1. Among younger women, widowhood has consistently been a rare event; the percentage of ever-married women under age 50 who are currently widowed has consistently been lower than 12% throughout the time period, with the number for women under 40 consistently 5% or lower (figures not shown).
Data Sources
- Ruggles, S., Flood, S., Goeken, R., Grover, J., Meyer, E. Pacas, J., & Sobek, M. (2020). IPUMS USA: Version 10.0 [dataset]. Minneapolis, MN: IPUMS, 2020. https://doi.org/10.18128/D010.V10.0
References
- Brown, S. L., & Lin, I.-F., (2012). The gray divorce revolution: Rising divorce among middle-aged and older adults, 1990–2010. Journals of Gerontology Series B: Psychological Sciences and Social Sciences, 67(6), 731–741, doi:10.1093/geronb/gbs089
- Schweizer, V. J. (2020). Marriage: More than a century of change, 1900-2018. Family Profiles, FP-20-21. Bowling Green, OH: National Center for Family & Marriage Research. https://doi.org/10.25035/ncfmr/fp-20-21
- Schweizer, V. J. (2020). Divorce: More than a century of change, 1900-2018. Family Profiles, FP-20-22. Bowling Green, OH: National Center for Family & Marriage Research. https://doi.org/10.25035/ncfmr/fp-20-22
Suggested Citation
Carlson, L. & Schweizer, V. J. (2020). Widowhood: Decades of change, 1940-2018. Family Profiles, FP-20-23. Bowling Green, OH: National Center for Family & Marriage Research. https://doi.org/10.25035/ncfmr/fp-20-23
This project is supported with assistance from Bowling Green State University. From 2007 to 2013, support was also provided by the U.S. Department of Health and Human Services, Office of the Assistant Secretary for Planning and Evaluation. The opinions and conclusions expressed herein are solely those of the author(s) and should not be construed as representing the opinions or policy of any agency of the state or federal government.
Updated: 04/06/2021 01:31PM


