
The Timing of First Marriage: Age Trends and Characteristics
Family Profile No. 13, 2026
Author: Krista K. Westrick-Payne
Americans are entering first marriage at older ages than in the past. This Family Profile examines the timing of first marriage using multiple measures. Historical trends in the median age at first marriage are drawn from the U.S. Census Bureau, whereas trends in refined first marriage rates and the demographic characteristics of adults who entered a first marriage in the past year are based on 2008-2024 American Community Survey (ACS) 1-years estimates from IPUMS USA. Learn the latest Fast Facts on American Marriages by clicking here. The NCFMR also has many other Family Profiles on marriage. You can check them all out here.
The Median Age at First Marriage
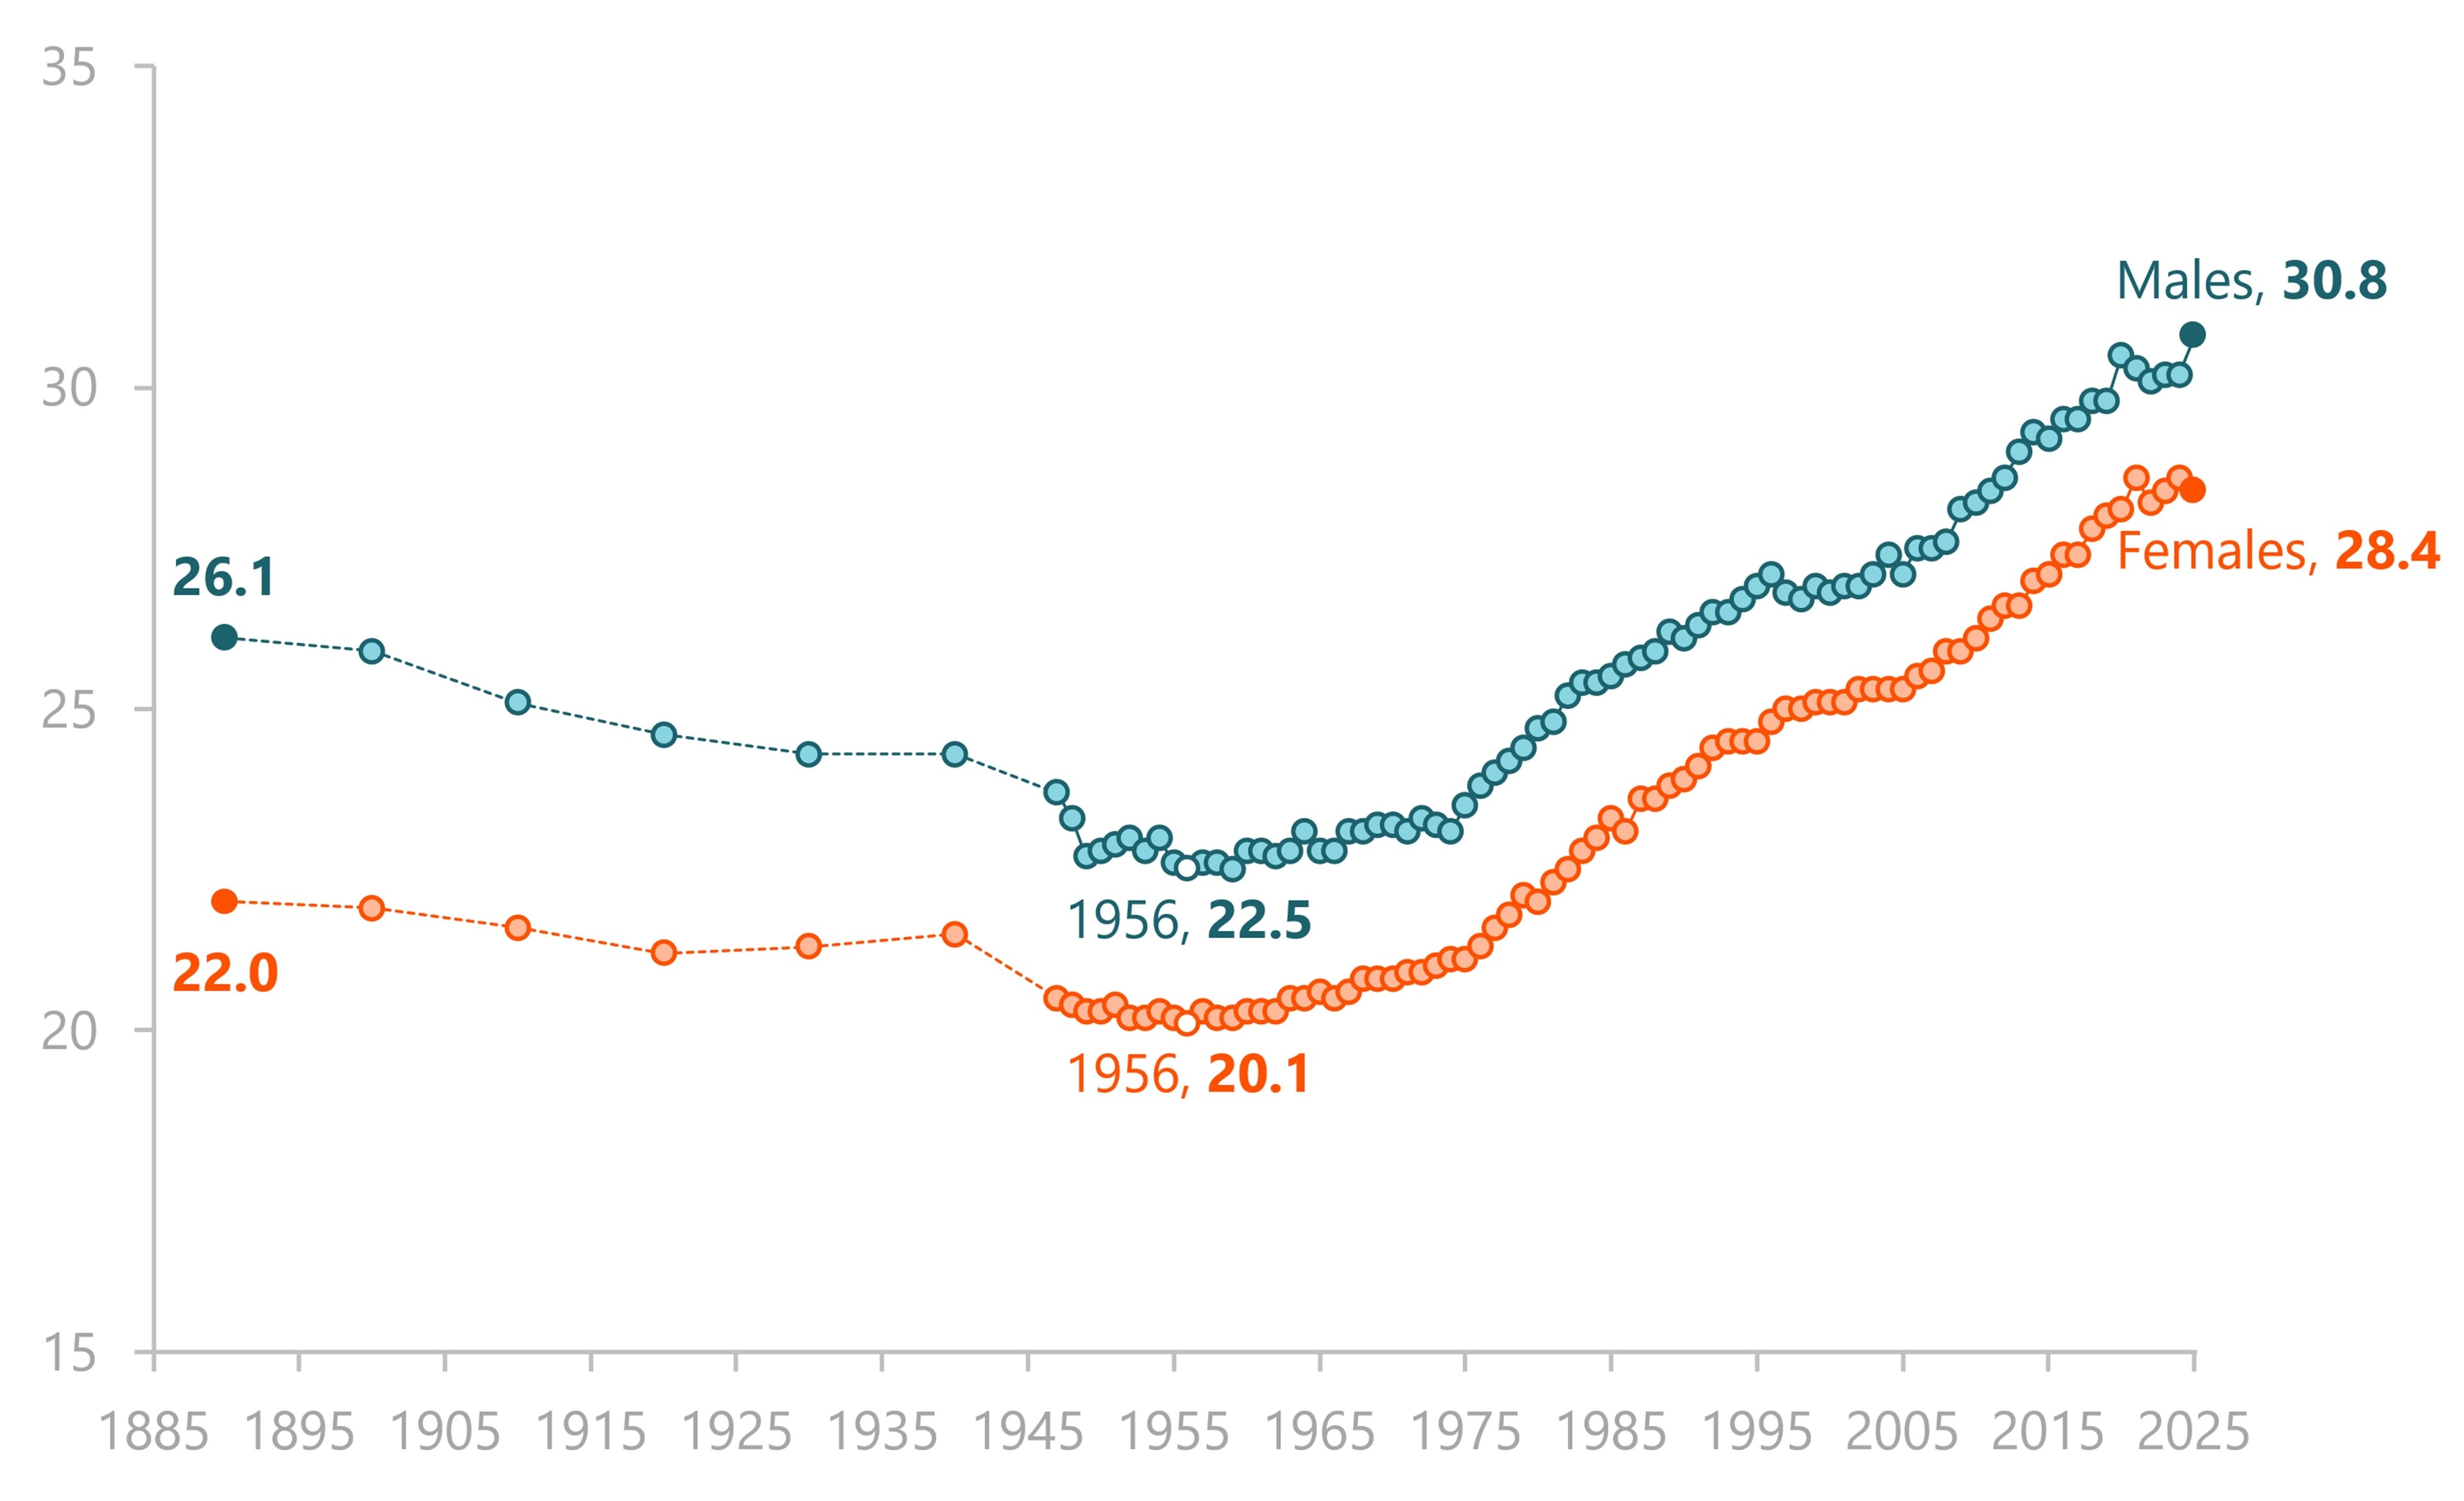
The median age at first marriage has increased steadily since the mid-1950s and remains near its historic high for both males and females.
- In 2025, the median age at first marriage reached 30.8 years among males and 28.4 among females.
- The youngest median ages at first marriage occurred in 1956 at 22.5 years among males and 20.1 among females.
Figure 1. Median Age at First Marriage by Sex, 1890-2025
Source: U.S. Census Bureau, Decennial Censuses, 1890 to 1940; Current Population Survey, March and Annual Social and Economic Supplements, 1947 to 2025.
The Refined First Marriage Rate by Age Group
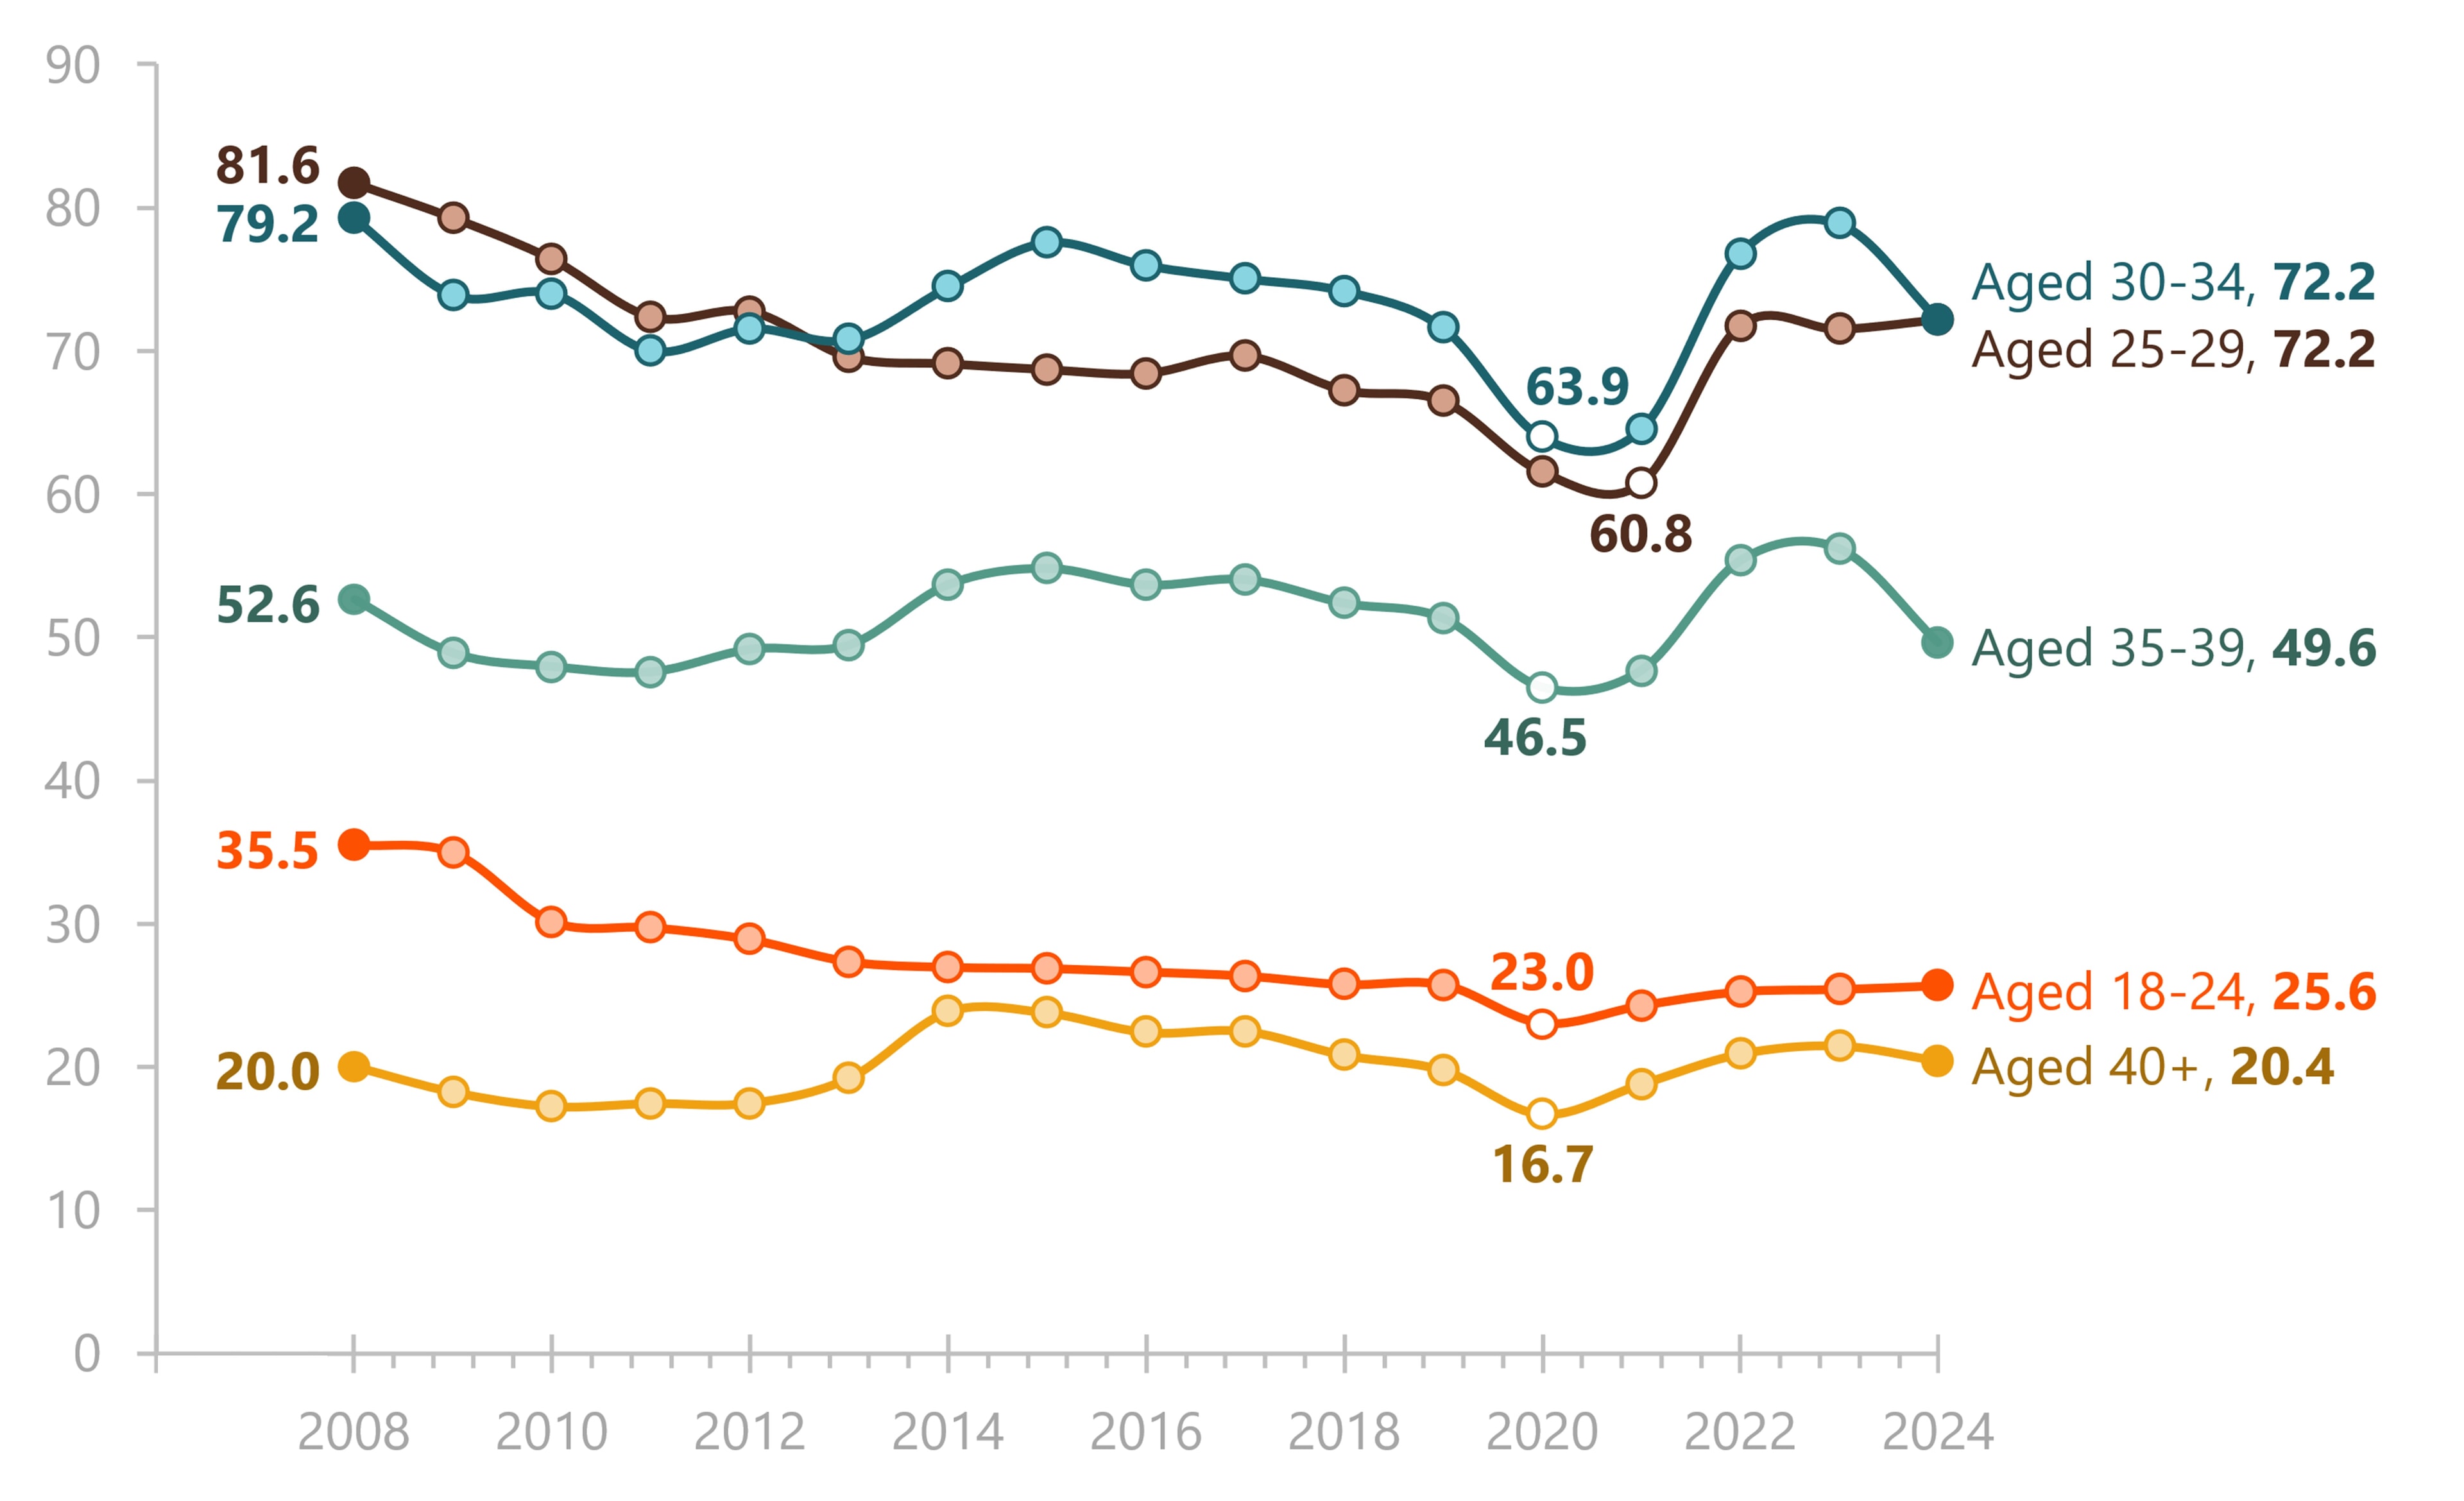
Figure 2. Refined First Marriage Rate by Age Group, 2008-2024
Source: NCFMR analysis of American Community Survey, 1-Year Estimates, 2008-2024 (IPUMS USA)
Note. The refined first marriage rate is the number of adults entering a first marriage per 1,000 never-married adults.
Refined first marriage rates declined over time for most age groups. Throughout the period, the highest rates were among adults aged 25-34, whereas the lowest rates were among adults aged 40 and older.
- Refined first marriage rates were lower in 2024 than in 2008 for adults aged 18-39. Rates among adults aged 40 and older were similar in 2008 (20.0) and 2024 (20.4).
- In 2024, refined first marriage rates were highest among adults aged 25-29 and 30-34 (72.2 per 1,000 never married adults) and lowest among those aged 40 and older (20.4).
- Refined first marriage rates reached their lowest point in 2020 among adults aged 18-24, 20-24, 35-39, and 40 and older. Among adults aged 25-29, the lowest rate occurred in 2021.
Age Distribution of First Marriages
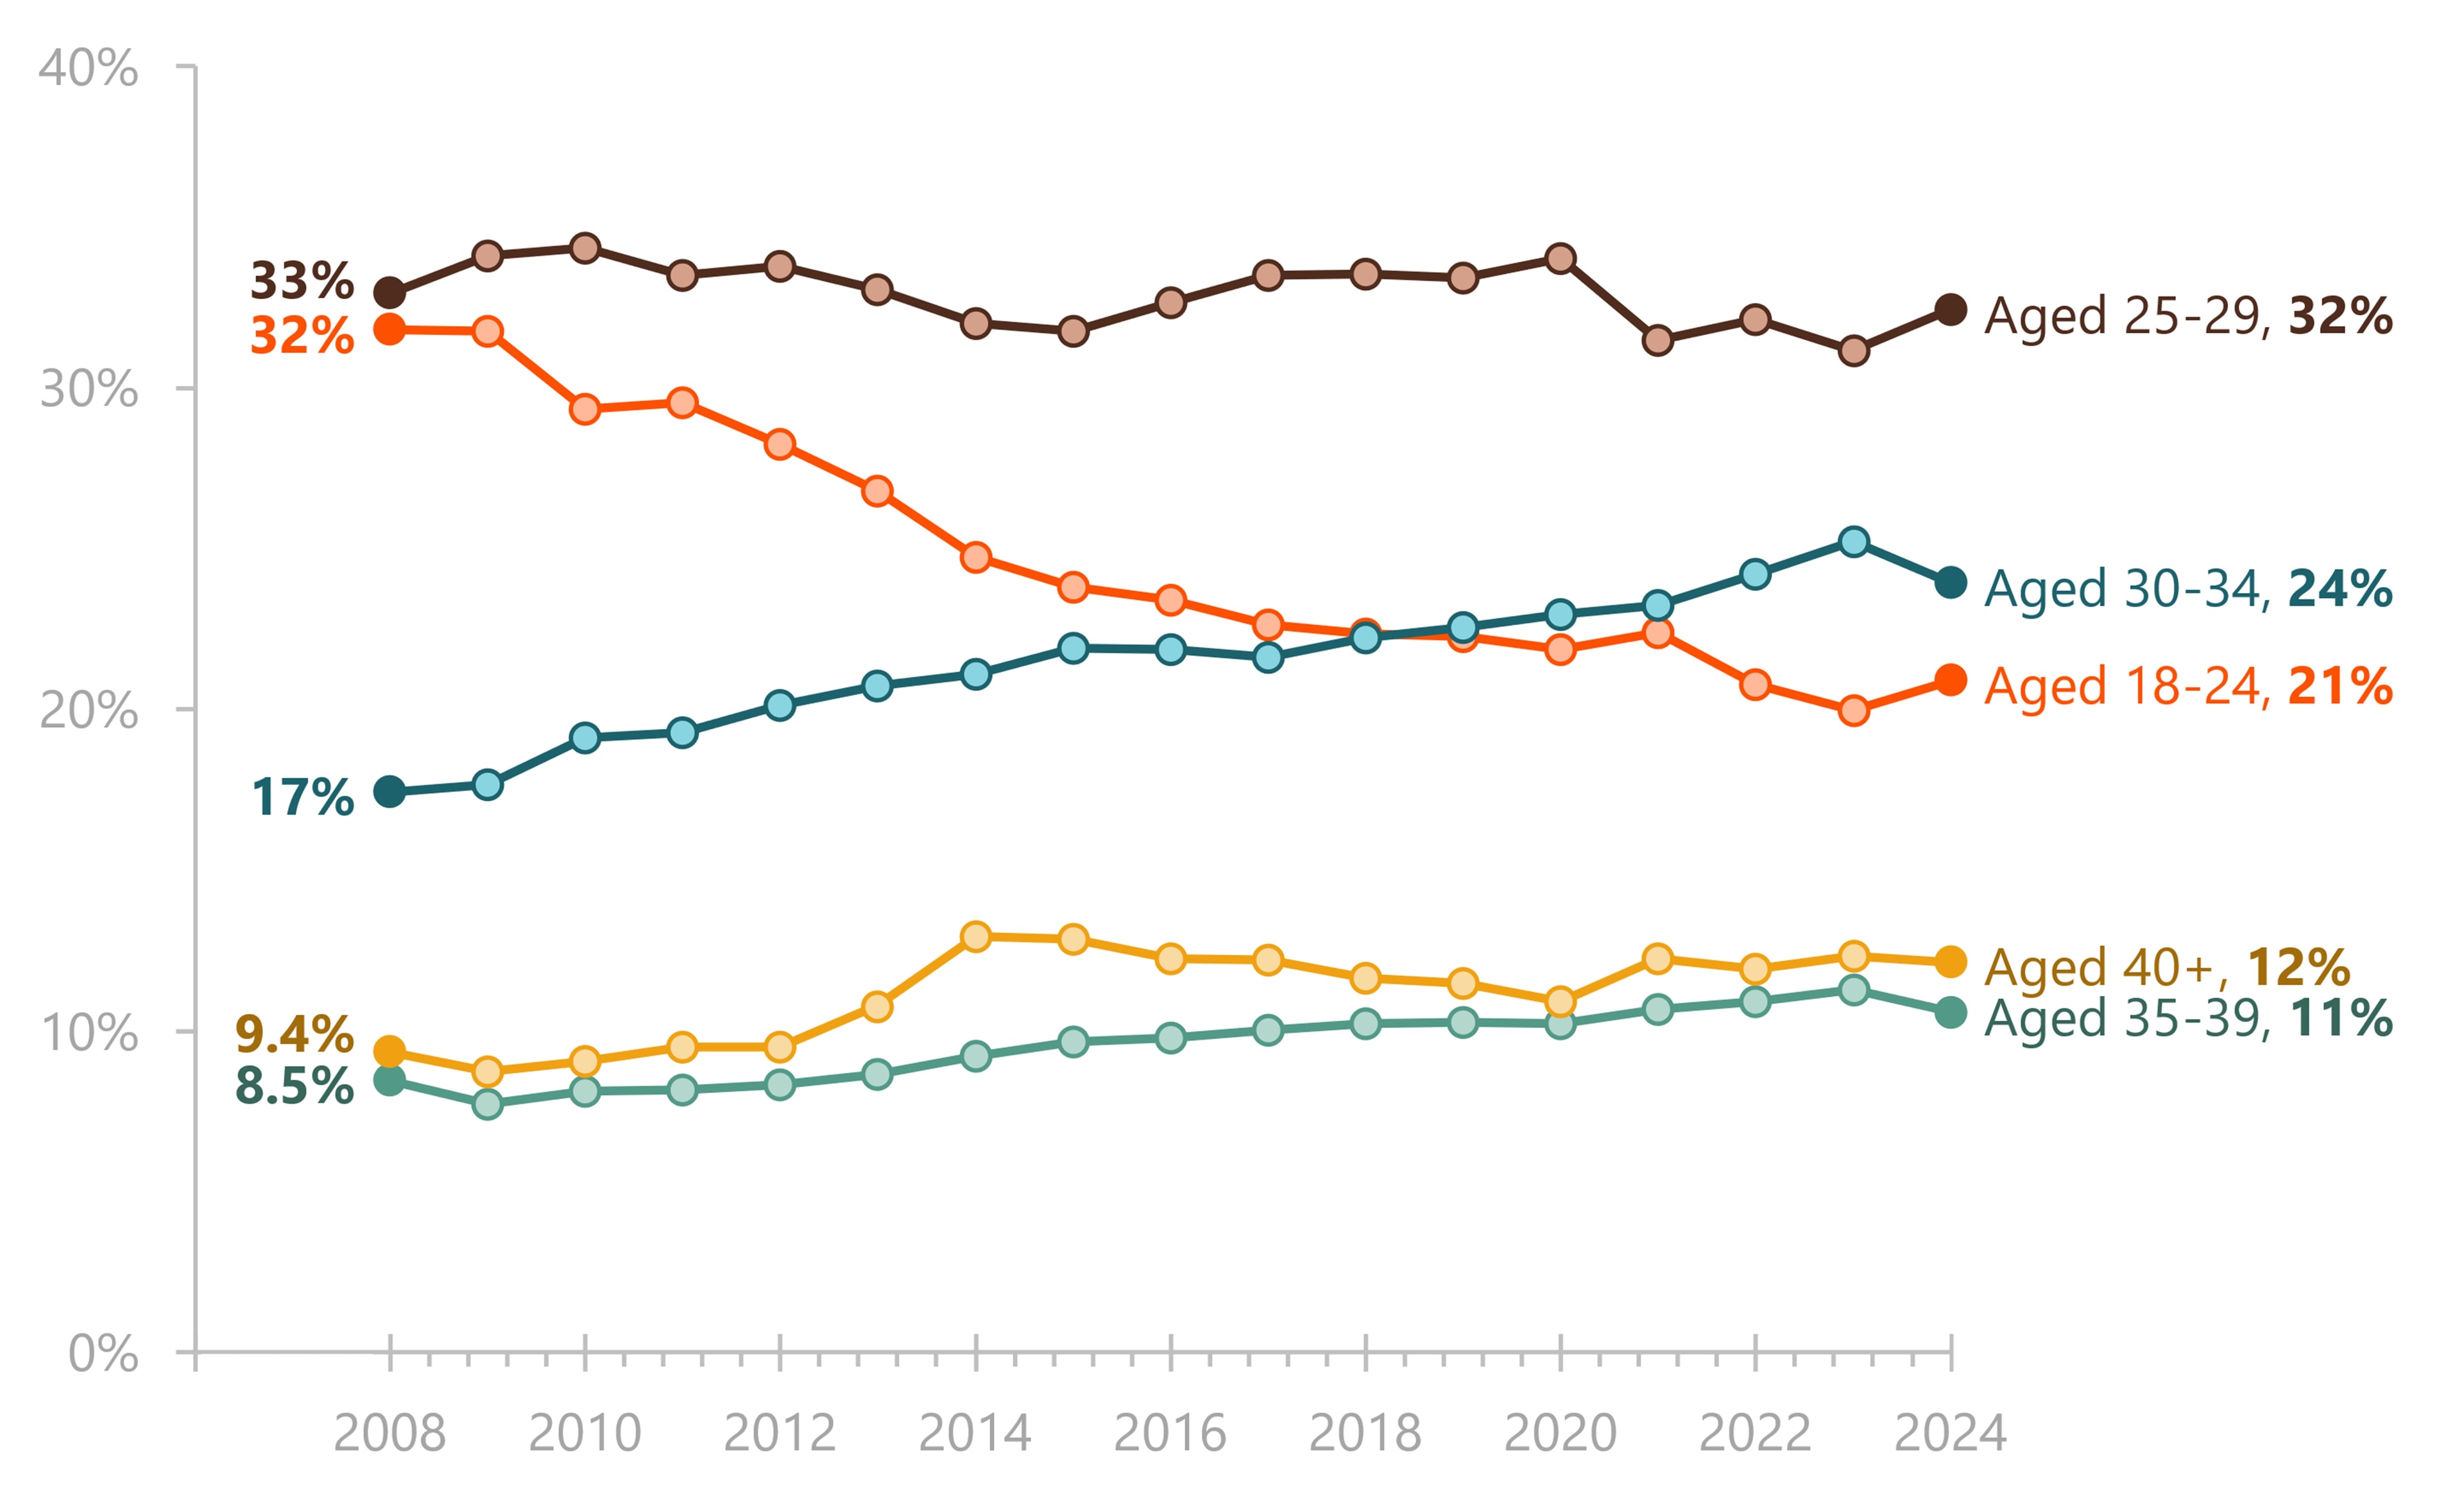
The age distribution of adults who entered a first marriage in the last year shifted over time. Since 2008, the share aged 18-24 declined, whereas the shares aged 30 and older increased.
- About one-third of adults who entered a first marriage in the last year were aged 25-29 throughout most of the period.
- The share aged 18-24 declined from 32% in 2008 to 21% in 2024.
- The share aged 30-34 increased from 17% in 2008 to 24% in 2024. Smaller increases also occurred among adults aged 35-39 (8.5% to 11%) and aged 40 and older (9.4% to 12%).
Figure 3. Share of First Marriages in the Last Year to Adults by Age Group, 2008-2024
Source: American Community Survey, 1-Year Estimates, 2008-2024 (IPUMS USA)
Note. Within each year, percentages represent the share of all first marriages occurring to adults in each age group. Categories may not sum to 100% due to rounding.
Race and Ethnic Distribution of First Marriages, 2024
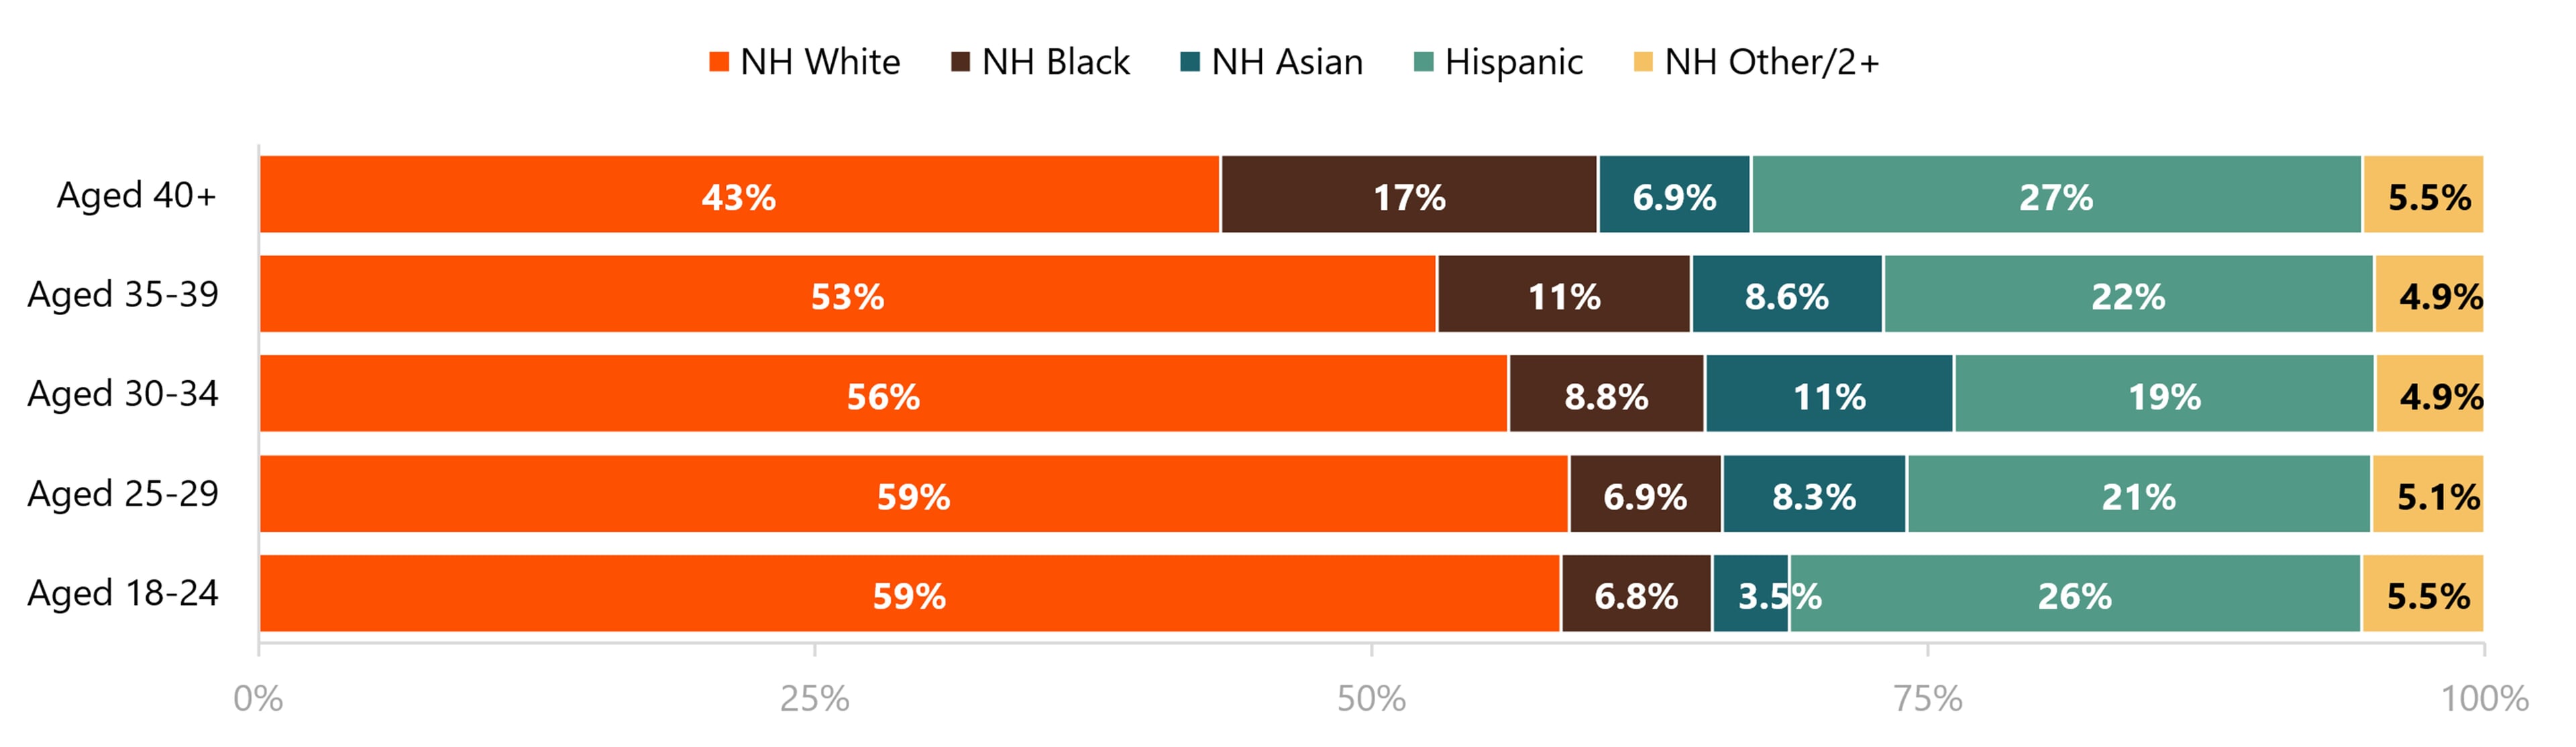
The racial and ethnic distribution of adults who entered a first marriage in the last year varied by age. The share who were non-Hispanic White declined with age, whereas the share who were non-Hispanic Black increased.
- The share who were non-Hispanic White was largest among adults aged 18-24 and 25-29 at 59% and smallest among those aged 40 and older at 43%.
- The share who were non-Hispanic Black was just 6.8% among adults aged 18-24 versus 17% among adults aged 40 and older.
- Adults aged 30-34 had the largest share who were non-Hispanic Asian (11%).
The share who were Hispanic comprised between one-fifth and one-quarter of adults marrying in the past year. The largest shares were among those aged 18 to 24 (26%) and those aged 40 and older (27%).
Figure 4. First Marriages in the Last Year Among Adults by Age Group and Race & Ethnicity
Source: American Community Survey, 1-Year Estimates, 2024 (IPUMS USA)
Note. Categories may not sum to 100% due to rounding. NH = Non-Hispanic. “NH Asian” includes non-Hispanic individuals identifying as Asian or Native Hawaiian and Other Pacific Islander. “Other/2+ Races” includes non-Hispanic individuals identifying as American Indian or Alaska Native alone, some other race alone, or two or more races.
Educational Attainment Distribution of First Marriages, 2024
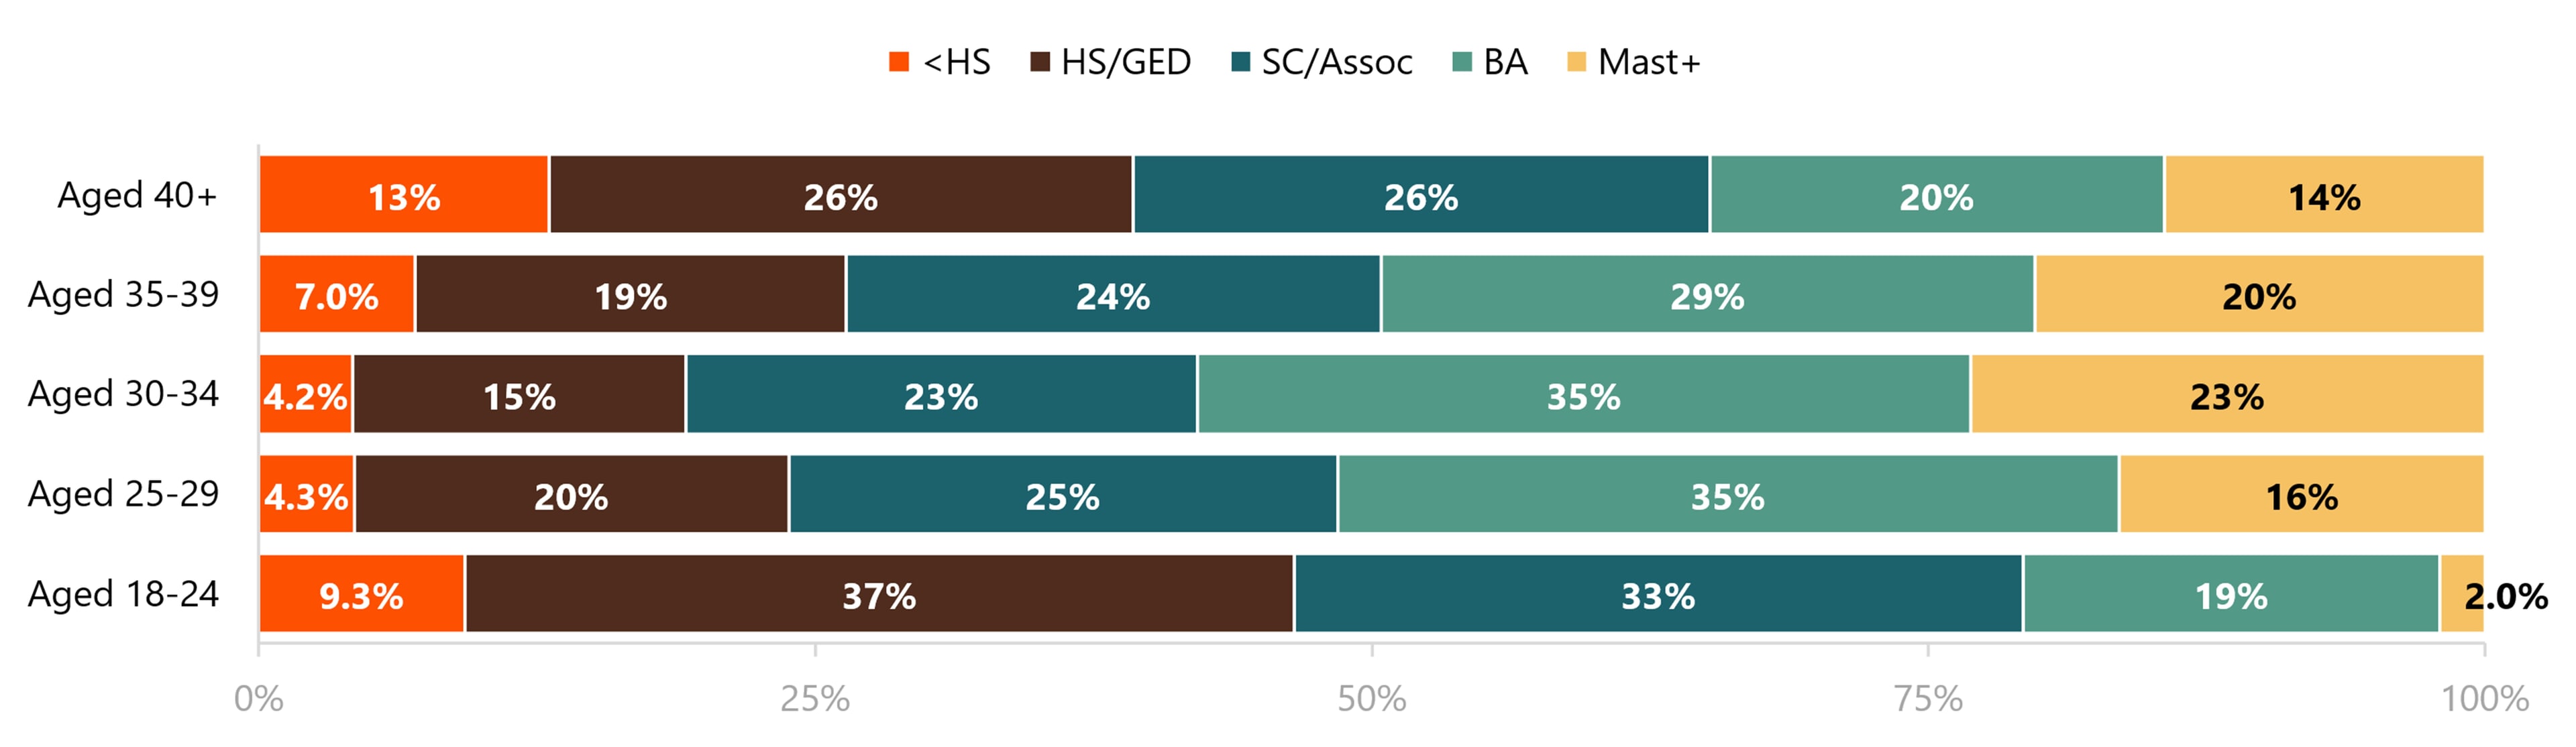
Educational attainment differed across age groups among adults who entered a first marriage in the last year. Those in their late twenties and thirties most often held bachelor’s degrees, whereas younger and older adult newlyweds had larger shares with lower levels of educational attainment (many 18-24 year olds may not have completed their educations yet).
- Among adults aged 25-29 and 30-34 who entered a first marriage in the last year, 35% had earned a bachelor’s degree. Adults aged 30-34 also had the largest share with a master’s degree or higher (23%).
- Among adults aged 18-24, 37% had completed high school or earned a GED. Adults aged 40 and older had the largest share with less than a high school education (13%).
Figure 5. First Marriages in the Last Year Among Adults by Age Group and Educational Attainment
Source: American Community Survey, 1-Year Estimates, 2024 (IPUMS USA)
Note. Categories may not sum to 100% due to rounding. HS = high school; GED = general education diploma; SC = some college; Assoc = associate degree; Bach = bachelor’s degree; Mast+ = master’s or professional degree or higher.

Data Source:
Ruggles, S., Flood, S., Sobek, M., Backman, D., Cooper, G., Rivera Drew, J. A., Richards, S., Rodgers, R., Schroeder, J., & Williams, K. C. W. (2025). IPUMS USA: Version 16.0 [Dataset]. Minneapolis, MN: IPUMS. https://doi.org/10.18128/D010.V16.0
References:
U.S. Census Bureau. (2025). Table MS-2. Estimated median age at first marriage, by sex: 1890 to present [Data table]. https://www.census.gov/data/tables/time-series/demo/families/marital.html
Suggested Citation:
Westrick-Payne, K. K. (2026). The timing of first marriage: Age trends and characteristics. Family Profiles, FP-26-13. Bowling Green, OH: National Center for Family & Marriage Research. https://doi.org/10.25035/ncfmr/fp-26-13
Updated: 09/08/2026 02:44PM