Marriage-to-Divorce Ratio in the U.S.: Geographic Variation, 2019
Family Profile No. 26, 2020
Author: Leslie Reynolds

This family profile updates previous profiles on the marriage-to-divorce ratio (FP-19-24; FP-19-03; FP-17-01; FP-15-19) and examines state variation in the ratio of marriages to divorces. Using recent American Community Survey (ACS) data, we calculate national and state level marriage-to-divorce ratios by dividing the number of women’s marriages by the number of women’s divorces for a given population in a given year.
The Marriage-to-Divorce Ratio, 2019
- In 2019, there were approximately two marriages per every one divorce in the United States (ratio = 2.14). Specifically, there were 2,231,263 marriages and 1,042,174 divorces.
- The ratio has remained stable since 2014 when it was also approximately two marriages for every one divorce (FP-15-19).
Figure 1. Women’s Marriage-to-Divorce Ratios, 1970 to 2019

Five Highest and Lowest Marriage-to-Divorce Ratios, 2019
- All states had a greater number of marriages than divorces. The District of Columbia (4.5), Maine (4.20), and South Dakota (2.87) were the top three states in the marriage-to-divorce ratio in 2019. There were at least 2.8 marriages per every one divorce in these states.
- The states with the lowest marriage-to-divorce ratios were Delaware (1.24), New Mexico (1.40), and Arkansas (1.53).
Figure 2. Women's Highest and Lowest Marriage-to-Divorce Ratios, 2019

State Rankings
- Approximately 36% of states experienced an increase in the marriage to divorce ratio from 2018 to 2019. Maine had the largest increase from 1.6 in 2018 (FP-19-24) to 4.2 in 2019. The number of marriages in Maine practically doubled (6,765 in 2018 to 11,795 in 2019), while there were almost half as many divorces in 2019 (2,806) as 2018 (4,818). South Dakota also had a notable increase from 1.5 to 2.9.
- Almost half of the states (48%) saw a decrease in their marriage-to-divorce ratio. North Dakota experienced the largest decrease, dropping from 4.6 in 2018 (FP-19-24) to 2.3 in 2019. While the number of marriages in North Dakota remained relatively stable from 2018 to 2019 (6,397 and 5,862), the number of divorces nearly doubled from 1,407 to 2,599.
- Almost one-fifth (16%) of states had almost the same marriage to divorce ratio in 2019 as they did in 2018. These states were Illinois, Iowa, California, Virginia, Louisiana, Oklahoma, Texas, and Georgia.
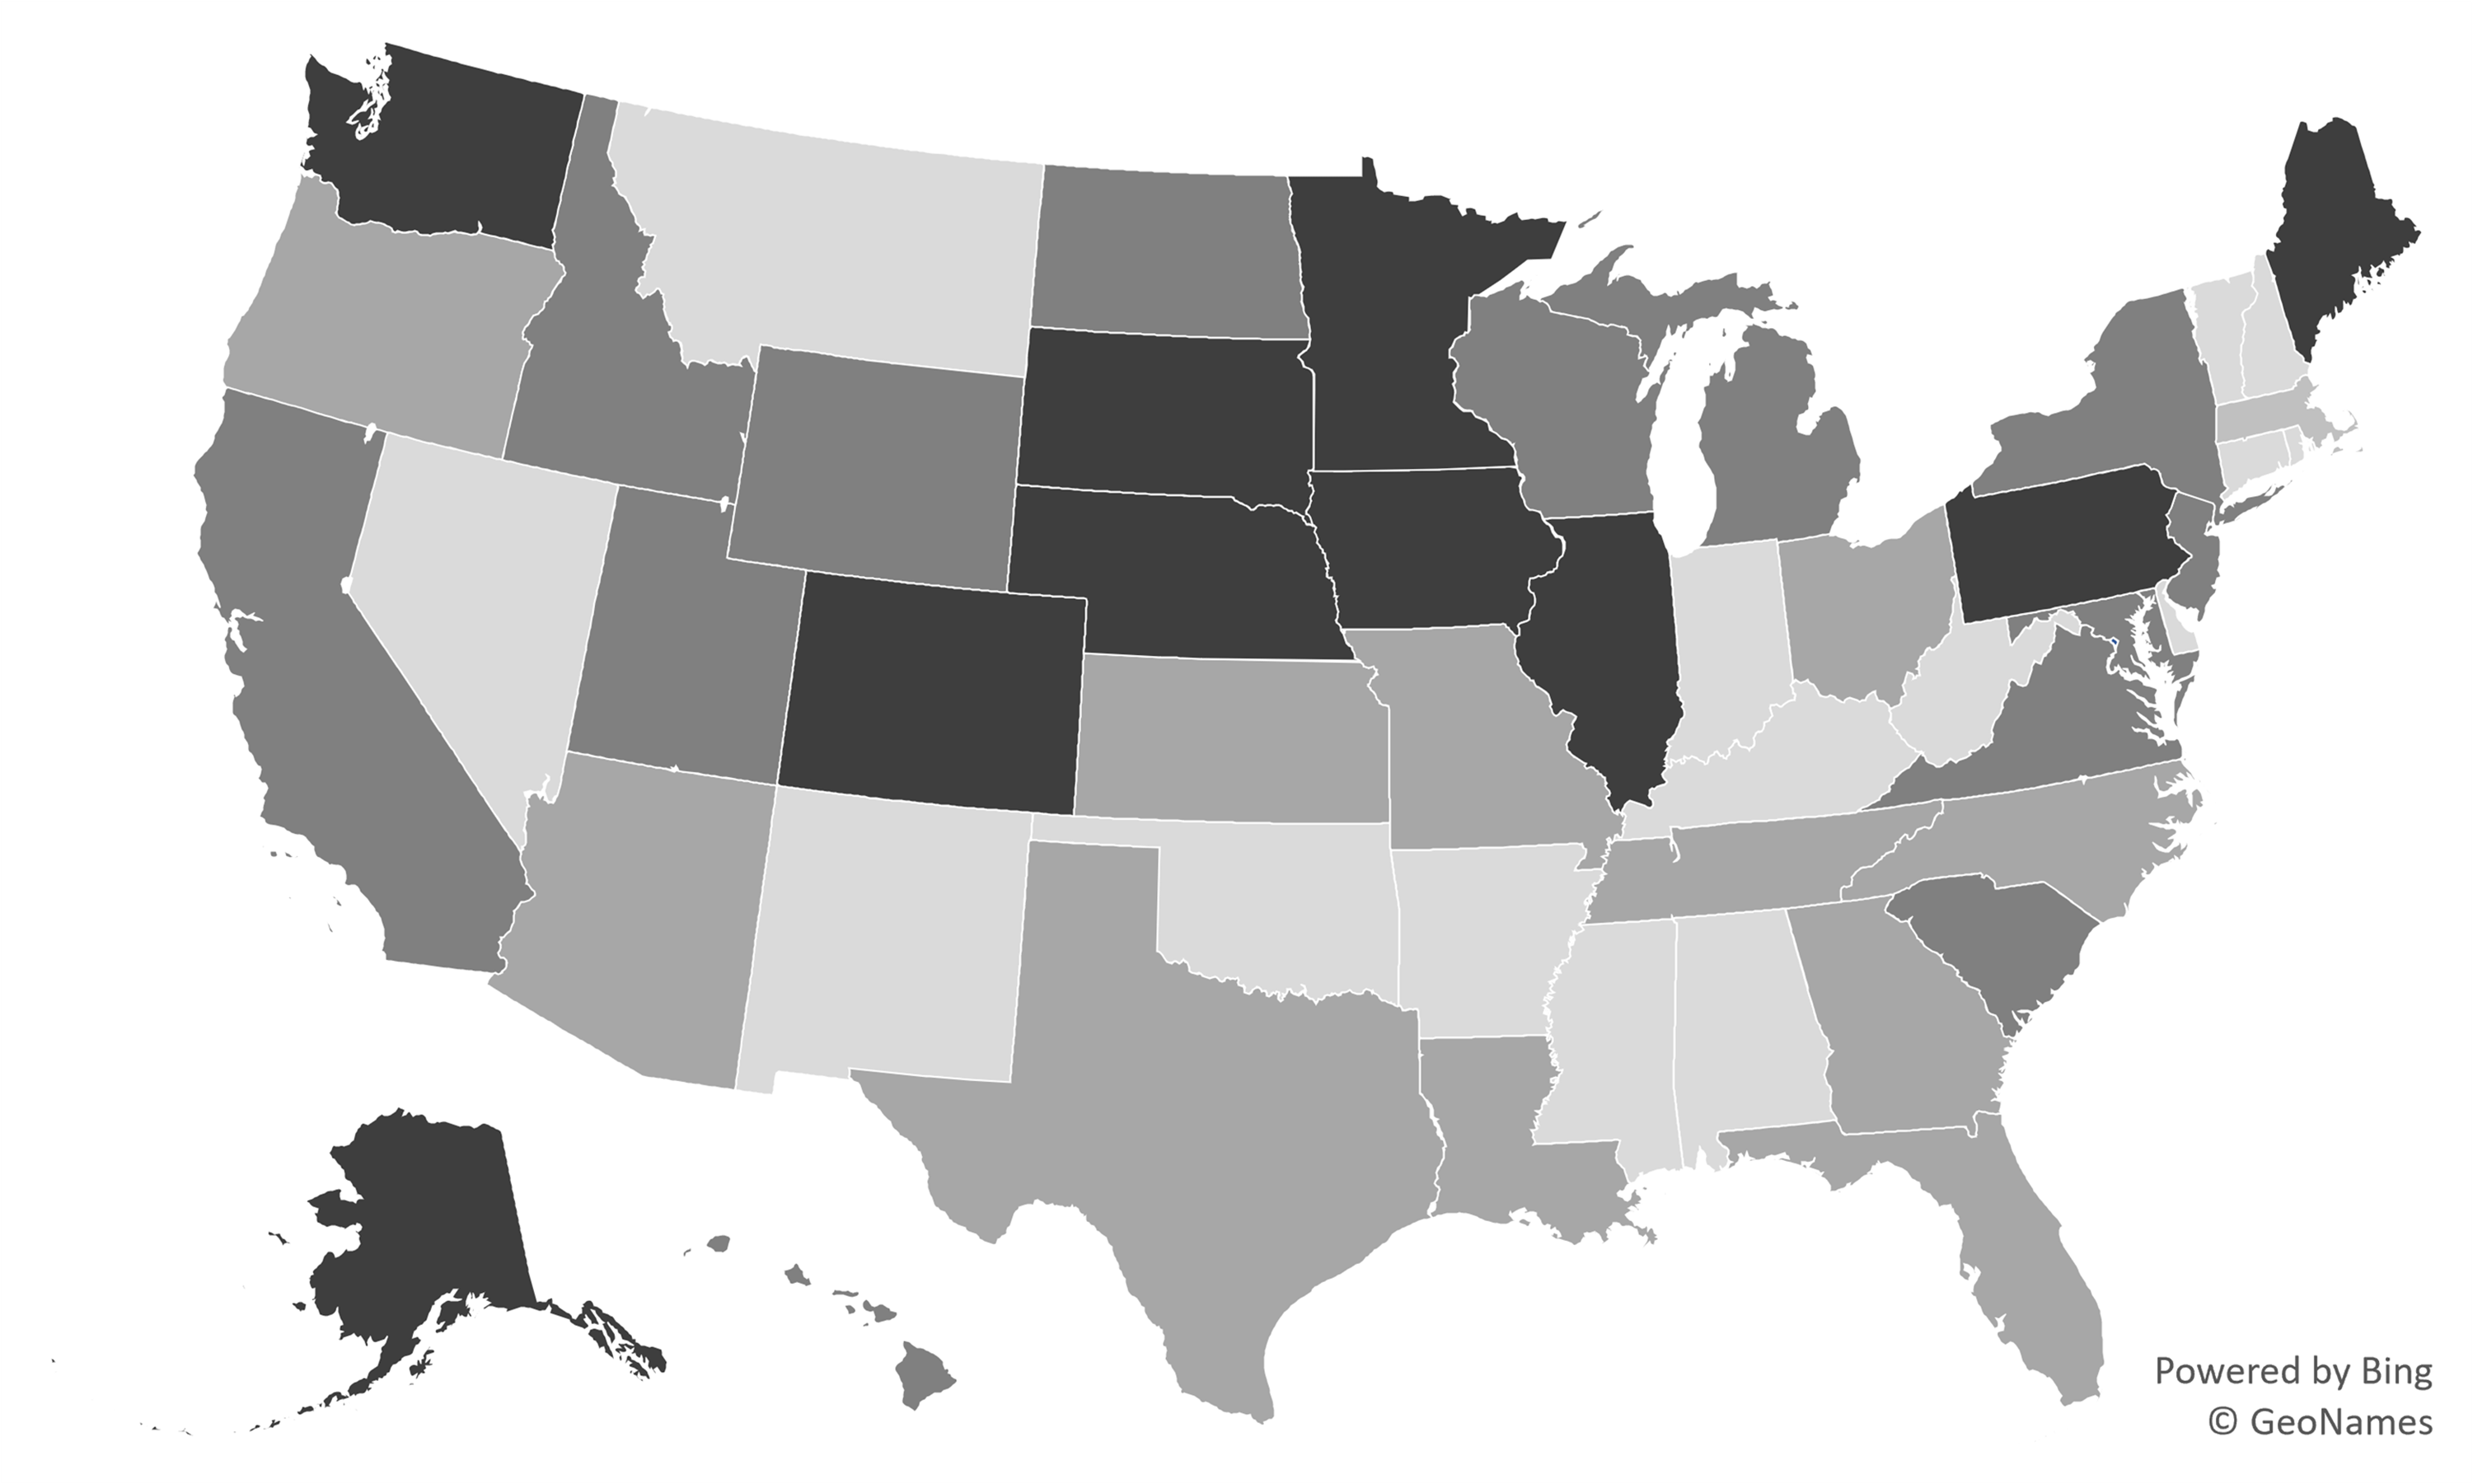
Figure 3. State Variation in Women’s Marriage-to-Divorce Ratios by Quartile, 2019

Figure 4. Geographic Variation in Marriage-to-Divorce Ratios Among Women Aged 15+, 2019
 Source: NCFMR analyses of U.S. Census Bureau, American Community Survey, 2019 1-yr est. References:
References
- Clarke, S. C. (1995). Advance Report of Final Marriage Statistics, 1989 and 1990. Monthly Vital Statistics Report, (43)12. National Center for Health Statistics. http://www.cdc.gov/nchs/data/mvsr/supp/mv43_12s.pdf
- National Center for Health Statistics (1974). Summary Report Final Marriage Statistics, 1970. Monthly Vital Statistics Report, (23)2. Supp. 1. U.S. Department of Health, Education, and Welfare. http://www.cdc.gov/nchs/data/mvsr/supp/mv23_02s1acc.pdf
- National Center for Health Statistics (1983). Advance Report of Final Marriage Statistics, 1980. Monthly Vital Statistics Report, (32)5, Supp. U.S. Department of Health and Human Services. http://www.cdc.gov/nchs/data/mvsr/supp/mv32_05s.pdf
- National Center for Health Statistics (2001). Births, Marriages, Divorces, and Deaths: Provisional Data for January-December, 2000. National Vital Statistics Reports, (49)6. Associated Table 3. Department of Health and Human Services, Centers for Disease Control and Prevention. http://www.cdc.gov/nchs/data/nsvr/nsvr49/49_06_12_03.pd
- Schweizer, V. (2019). Marriage to Divorce Ratio in the U.S.: Geographic Variation, 2018. Family Profile, (FP-19-24). National Center for Family & Marriage Research. https://doi.org/10.25035/ncfmr/fp-18-24
Suggested Citation
- Reynolds, L. (2020). Marriage-to-divorce ratio in the U.S.: Geographic variation, 2019. Family Profile, (FP-20-26). National Center for Family & Marriage Research. https://doi.org/10.25035/ncfmr/fp-20-26

Updated: 07/08/2026 07:44PM