
Married Same-Sex and Different-Sex Couples: A Demographic Portrait, 2024
Family Profile No. 10, 2026
Authors: Krista K. Westrick-Payne & Wendy D. Manning
The first state in the U.S. to legalize same-sex marriage was Massachusetts on May 17th, 2004, predating the federal ruling by eleven years. Marking 22 years since the landmark Massachusetts decision we present a demographic portrait of marriages to same-sex and different-sex couples with 2024 data from the American Community Survey 1-year PUMS files. We begin with an overview of married couples followed by comparisons of individuals in same-sex married couples to those in different-sex married couples based on their marital history, age, education, race, ethnicity and nativity. This is an update to a prior profile FP-24-06 (Westrick-Payne & Manning, 2024).
Married Couples
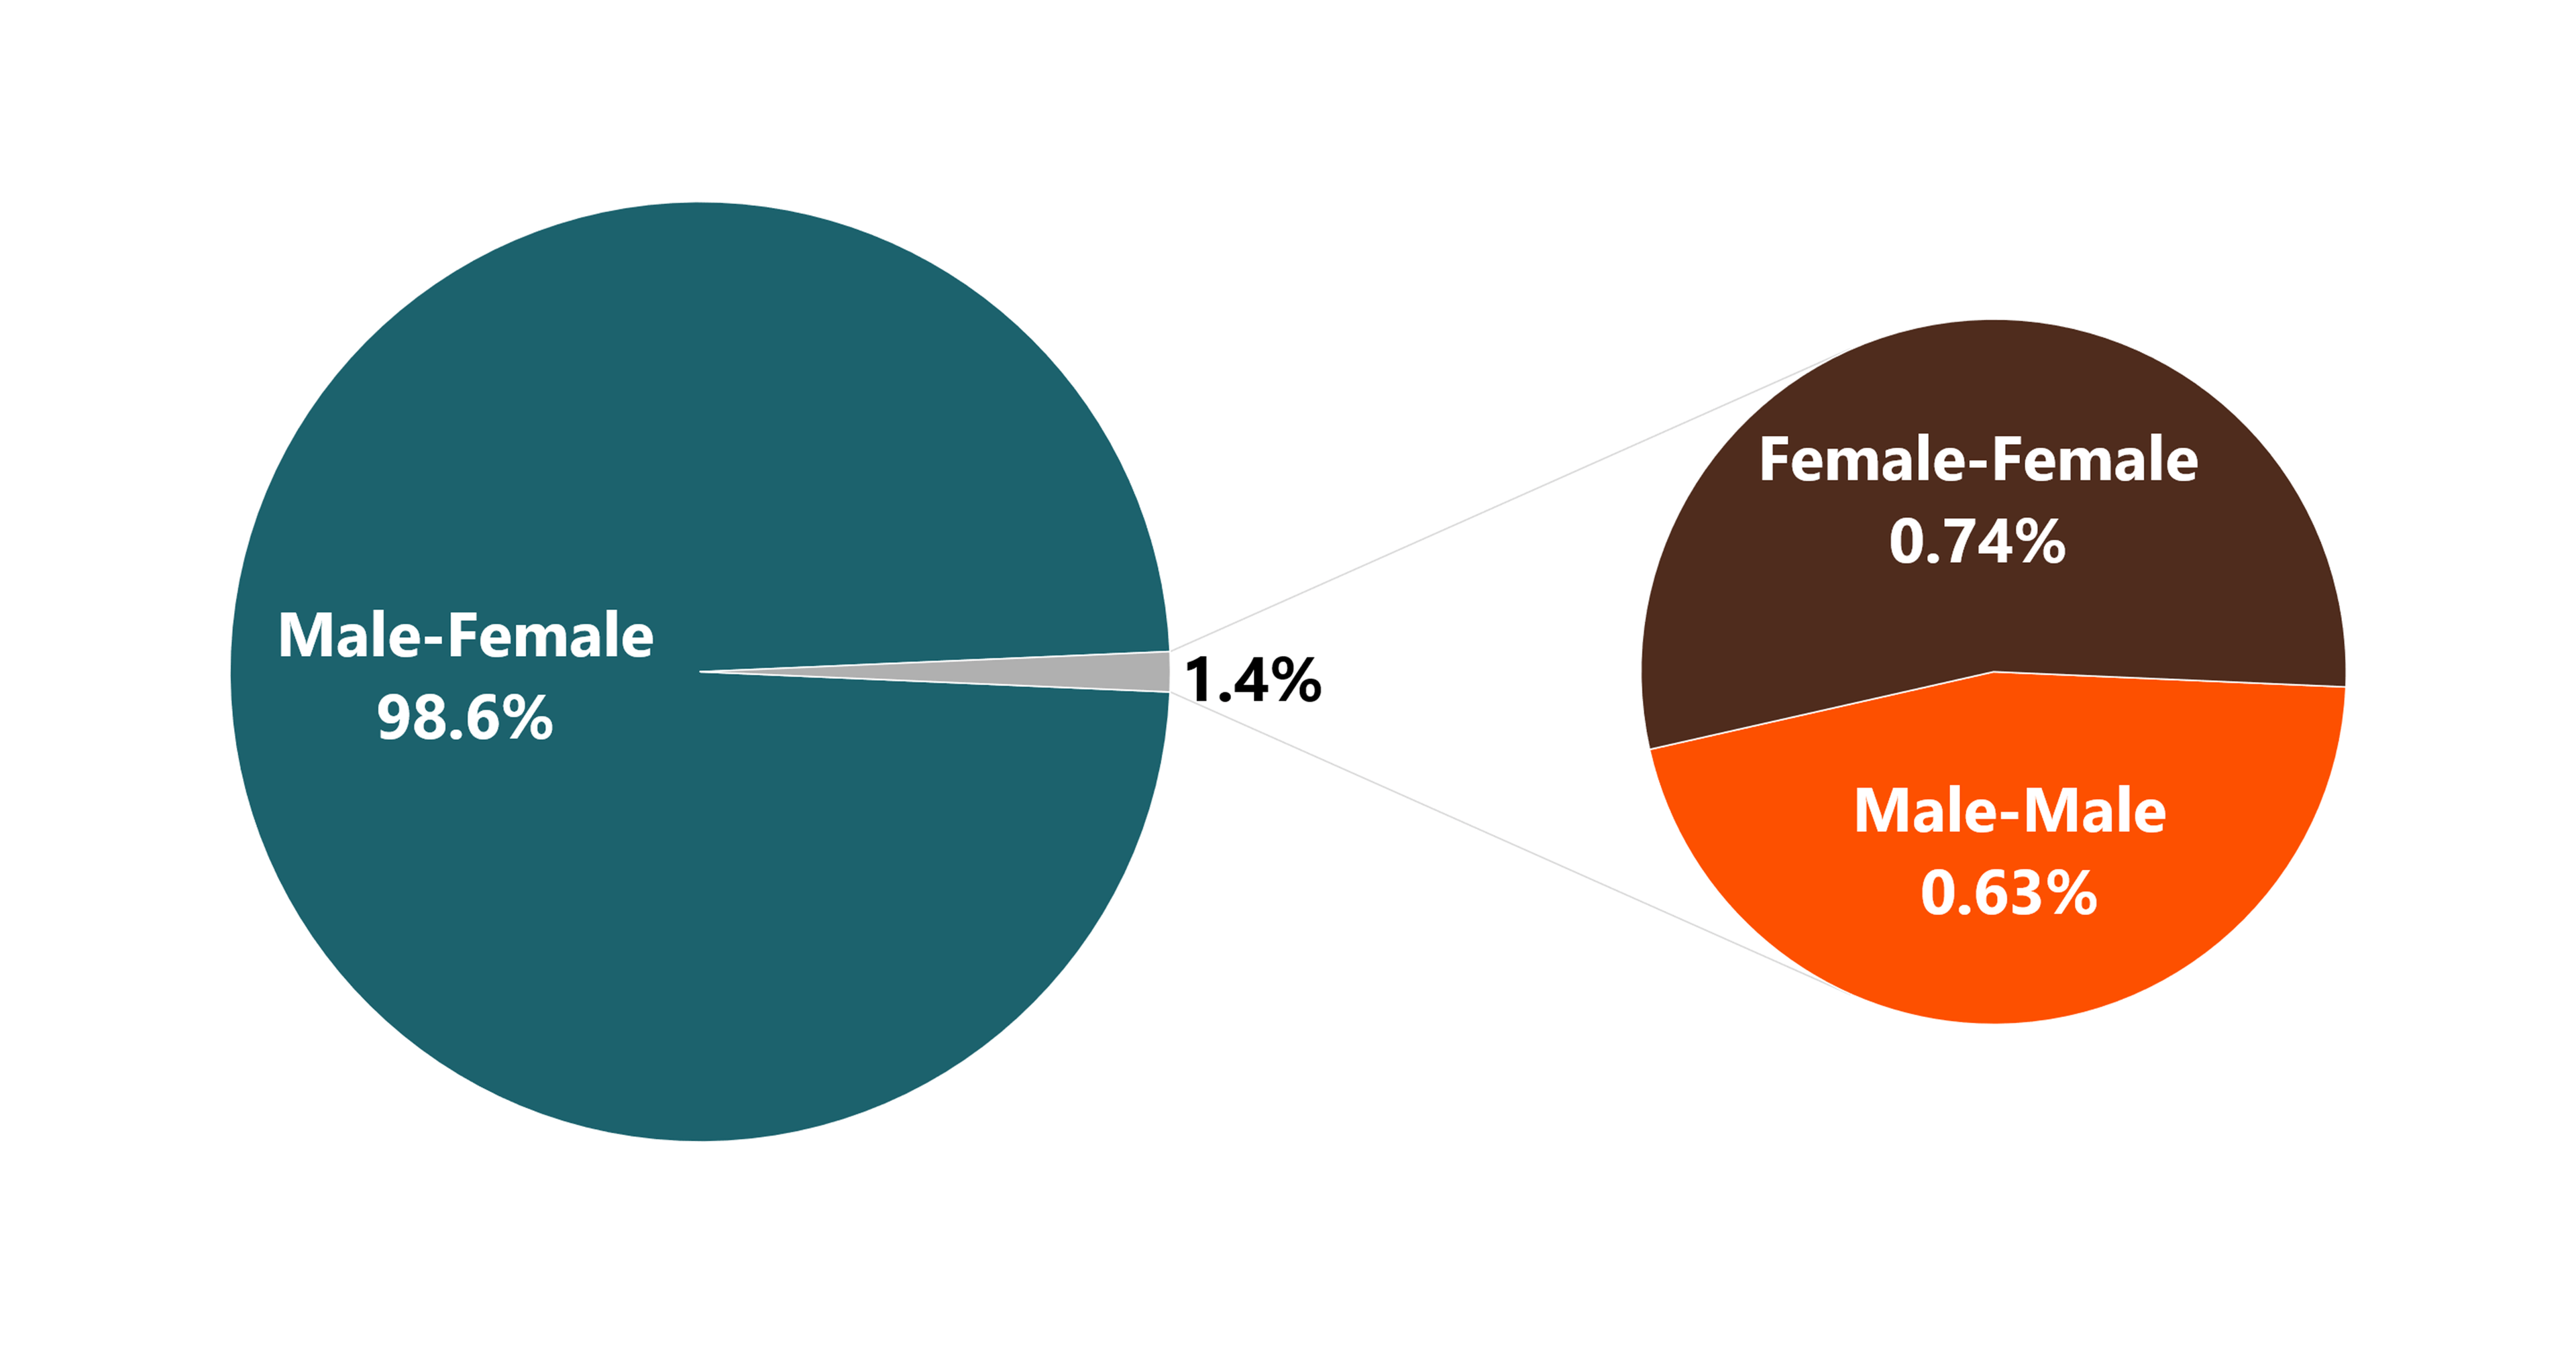
- As of 2024 there were slightly more than 61 million different-sex married couples in the United States compared to slightly more than 60 million in 2022 for a percentage increase of 1.5%. In 2024, this represented 98.6% of all married couples.
- There were nearly 850,000 same-sex married couples in 2024, a more than 14% increase since 2022. In 2024, 1.4% of all married couples were of the same-sex. Among married same-sex couples 46% were marriages among male couples and 54% were among female couples.
- On average, currently married couples of different sexes have been married longer with a median duration of 18 years. Married couples of the same sex have a median duration of 5 years.
Figure 1. Sex Composition of Currently Married Couples, 2024
Source: NCFMR analyses U.S. Census Bureau, American Community Survey, Public Use Microdata Sample (PUMS), 1-year est., 2024
Note. Categories may not sum to 100% due to rounding.
Married Individuals
Number of Times Married
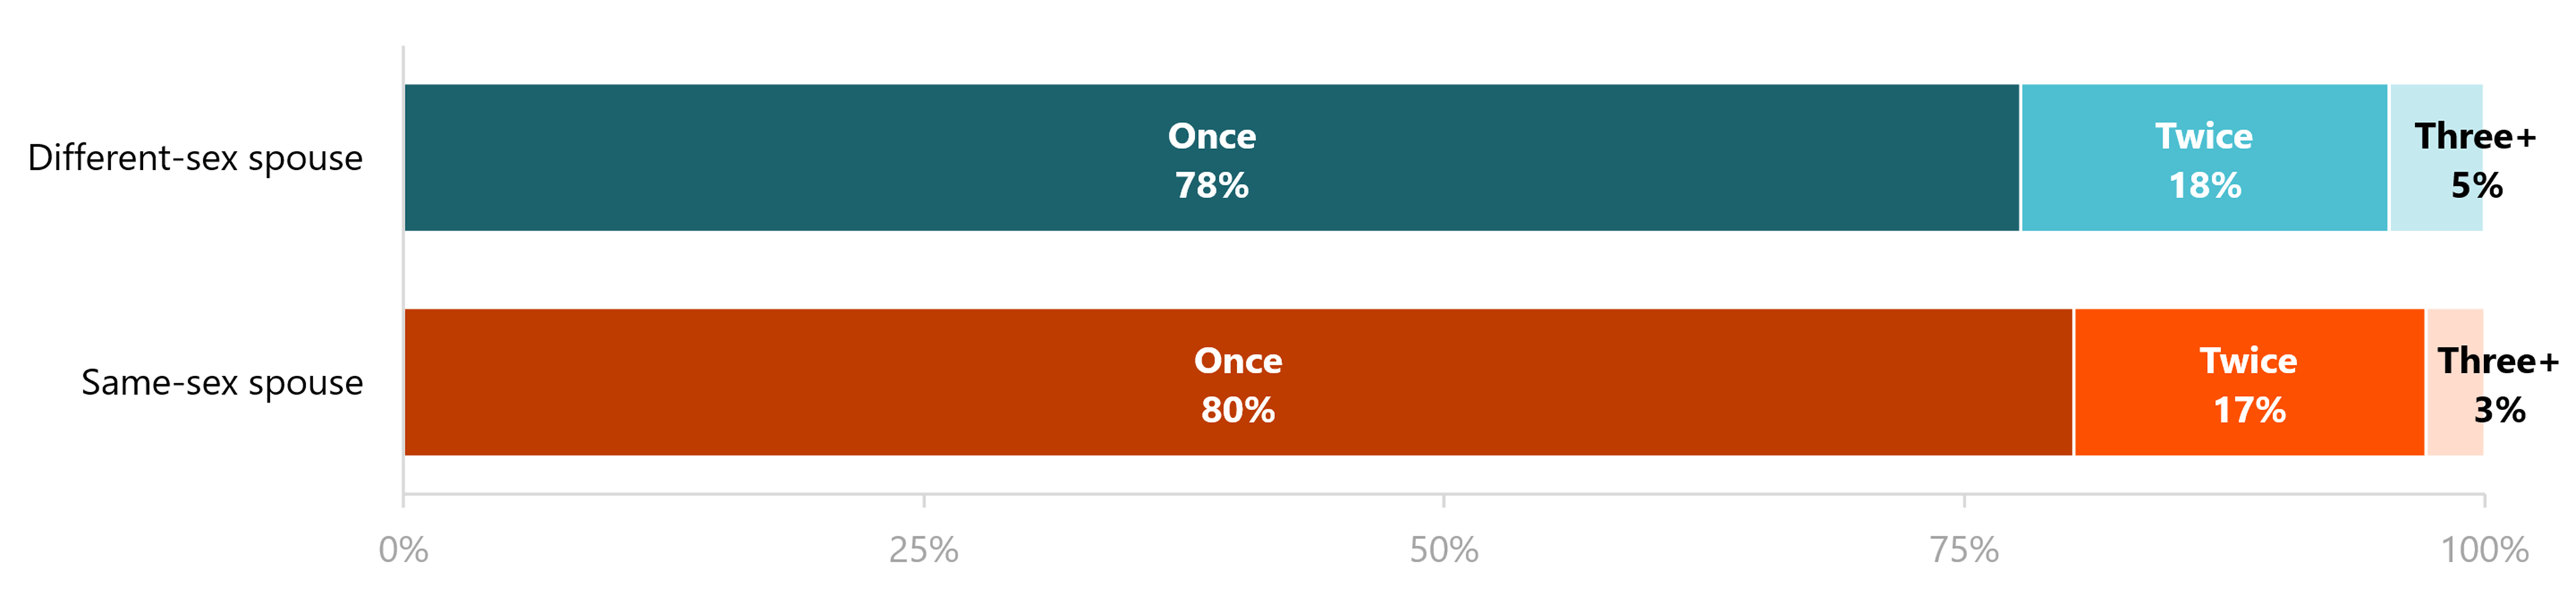
- Most currently married individuals had only been married one time. The share among those with a spouse of the same sex was slightly larger at 80% than among those with a spouse of a different sex at 78%.
Figure 2. Number of Times Married by Couple Type, 2024
Source: NCFMR analyses U.S. Census Bureau, American Community Survey, PUMS, 1-year est., 2024
Note. Categories may not sum to 100% due to rounding.
Age
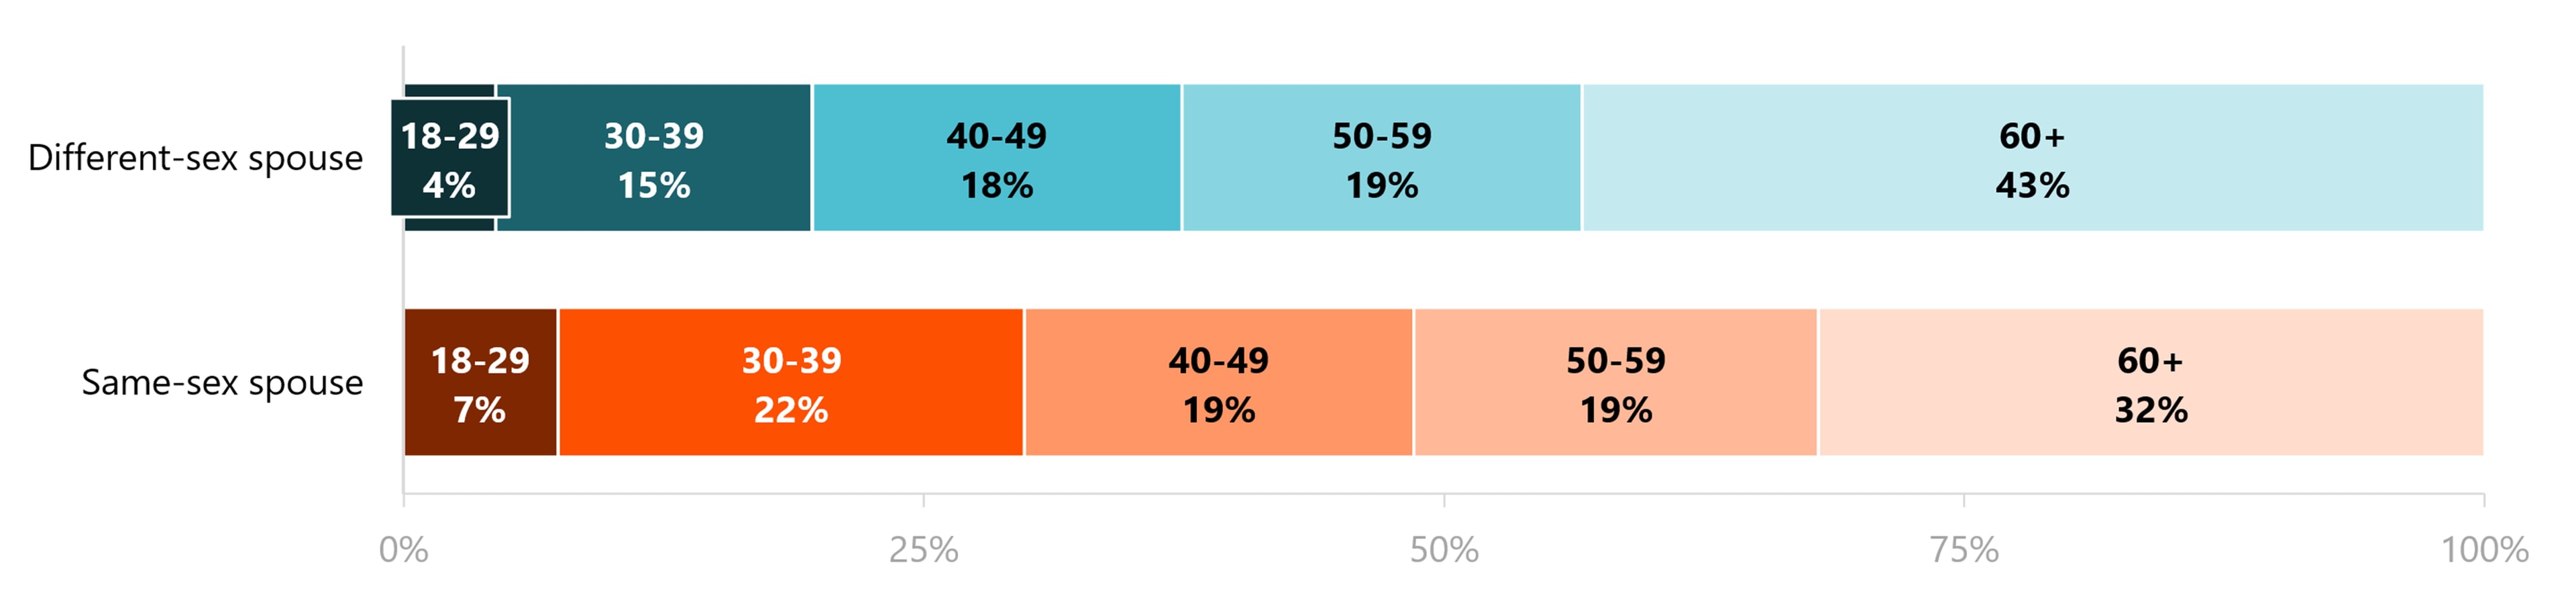
- Individuals married to a same-sex spouse were younger on average than those married to a different-sex spouse.
- A larger share of individuals married to a same-sex spouse were in their thirties compared to those married to a different-sex spouse (22% compared to 15%).
- Over two-fifths (43%) of individuals married to a different-sex spouse were over age 60 in contrast to nearly one-third (32%) of those married to a same-sex spouse.
Figure 3. Age Distribution by Couple Type, 2024
Source: NCFMR analyses U.S. Census Bureau, American Community Survey, PUMS, 1-year est., 2024
Note. Categories may not sum to 100% due to rounding.
Educational Attainment
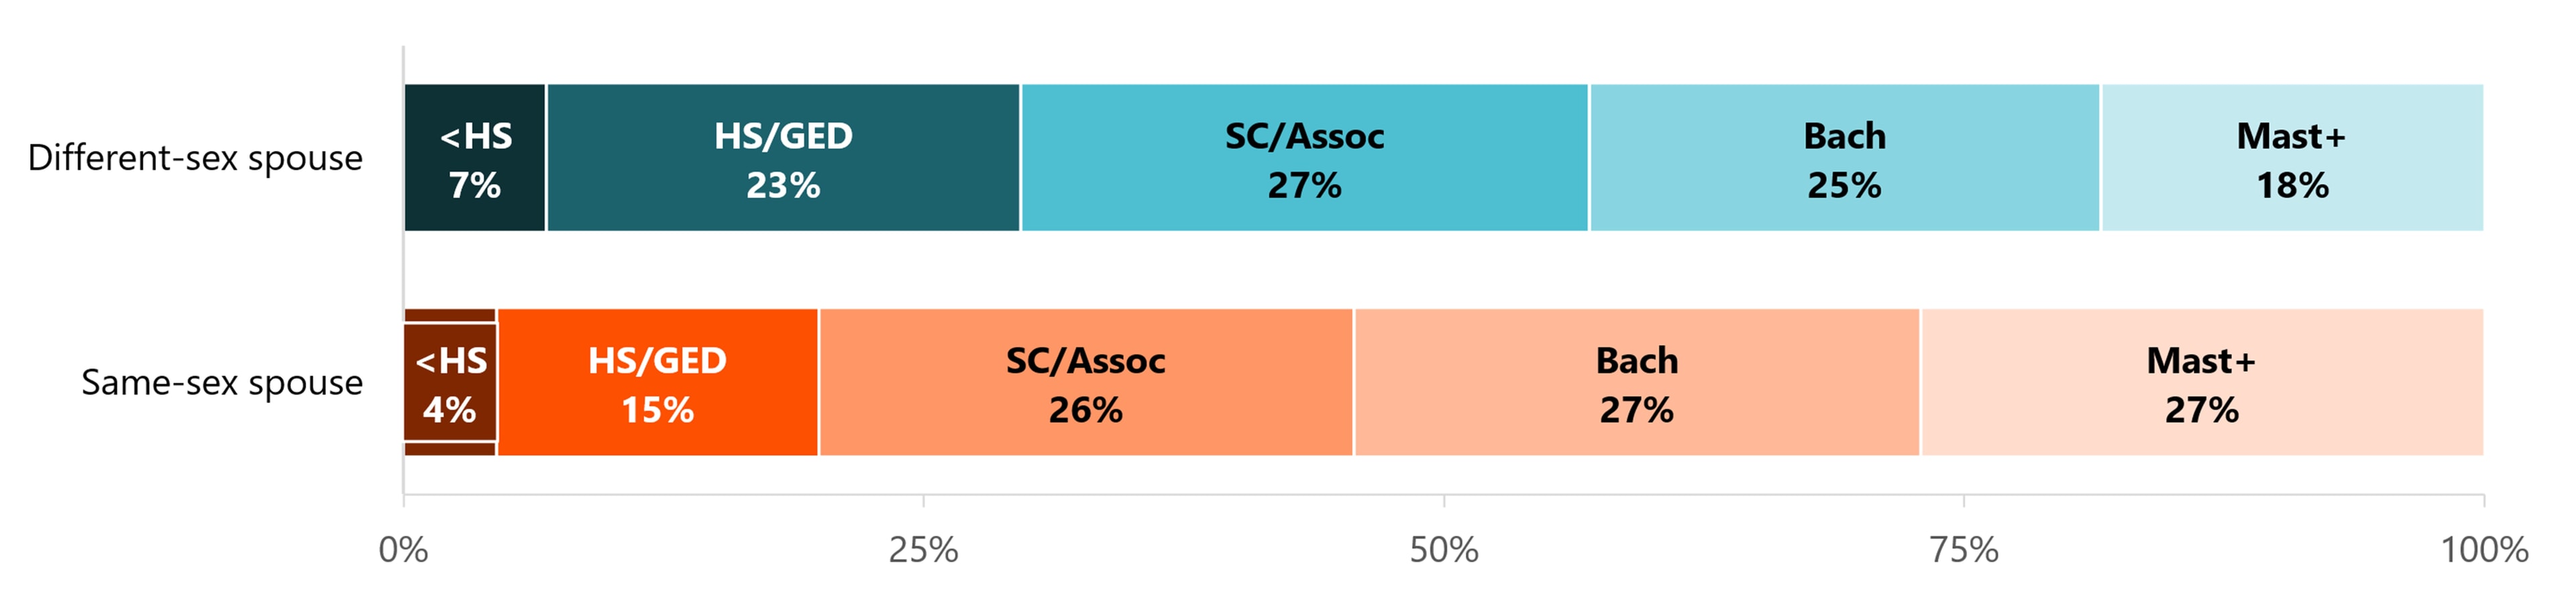
- Individuals married to same-sex spouses had higher levels of educational attainment than their counterparts married to different-sex spouses.
- The greatest educational difference existed among those with a high school level of education and those with at least a master’s degree. More than one-quarter (27%) of individuals with a same-sex spouse had at least a master’s degree compared to 18% of those married to a different-sex spouse.
Figure 4. Educational Attainment by Couple Type, 2024
Source: NCFMR analyses U.S. Census Bureau, American Community Survey, PUMS, 1-year est., 2024
Note. HS = high school; GED = general education diploma; SC = some college; Assoc = associate degree; Bach = bachelor’s degree; Mast+ = master’s degree or higher. Categories may not sum to 100% due to rounding.
Race, Hispanic Origin, and Nativity
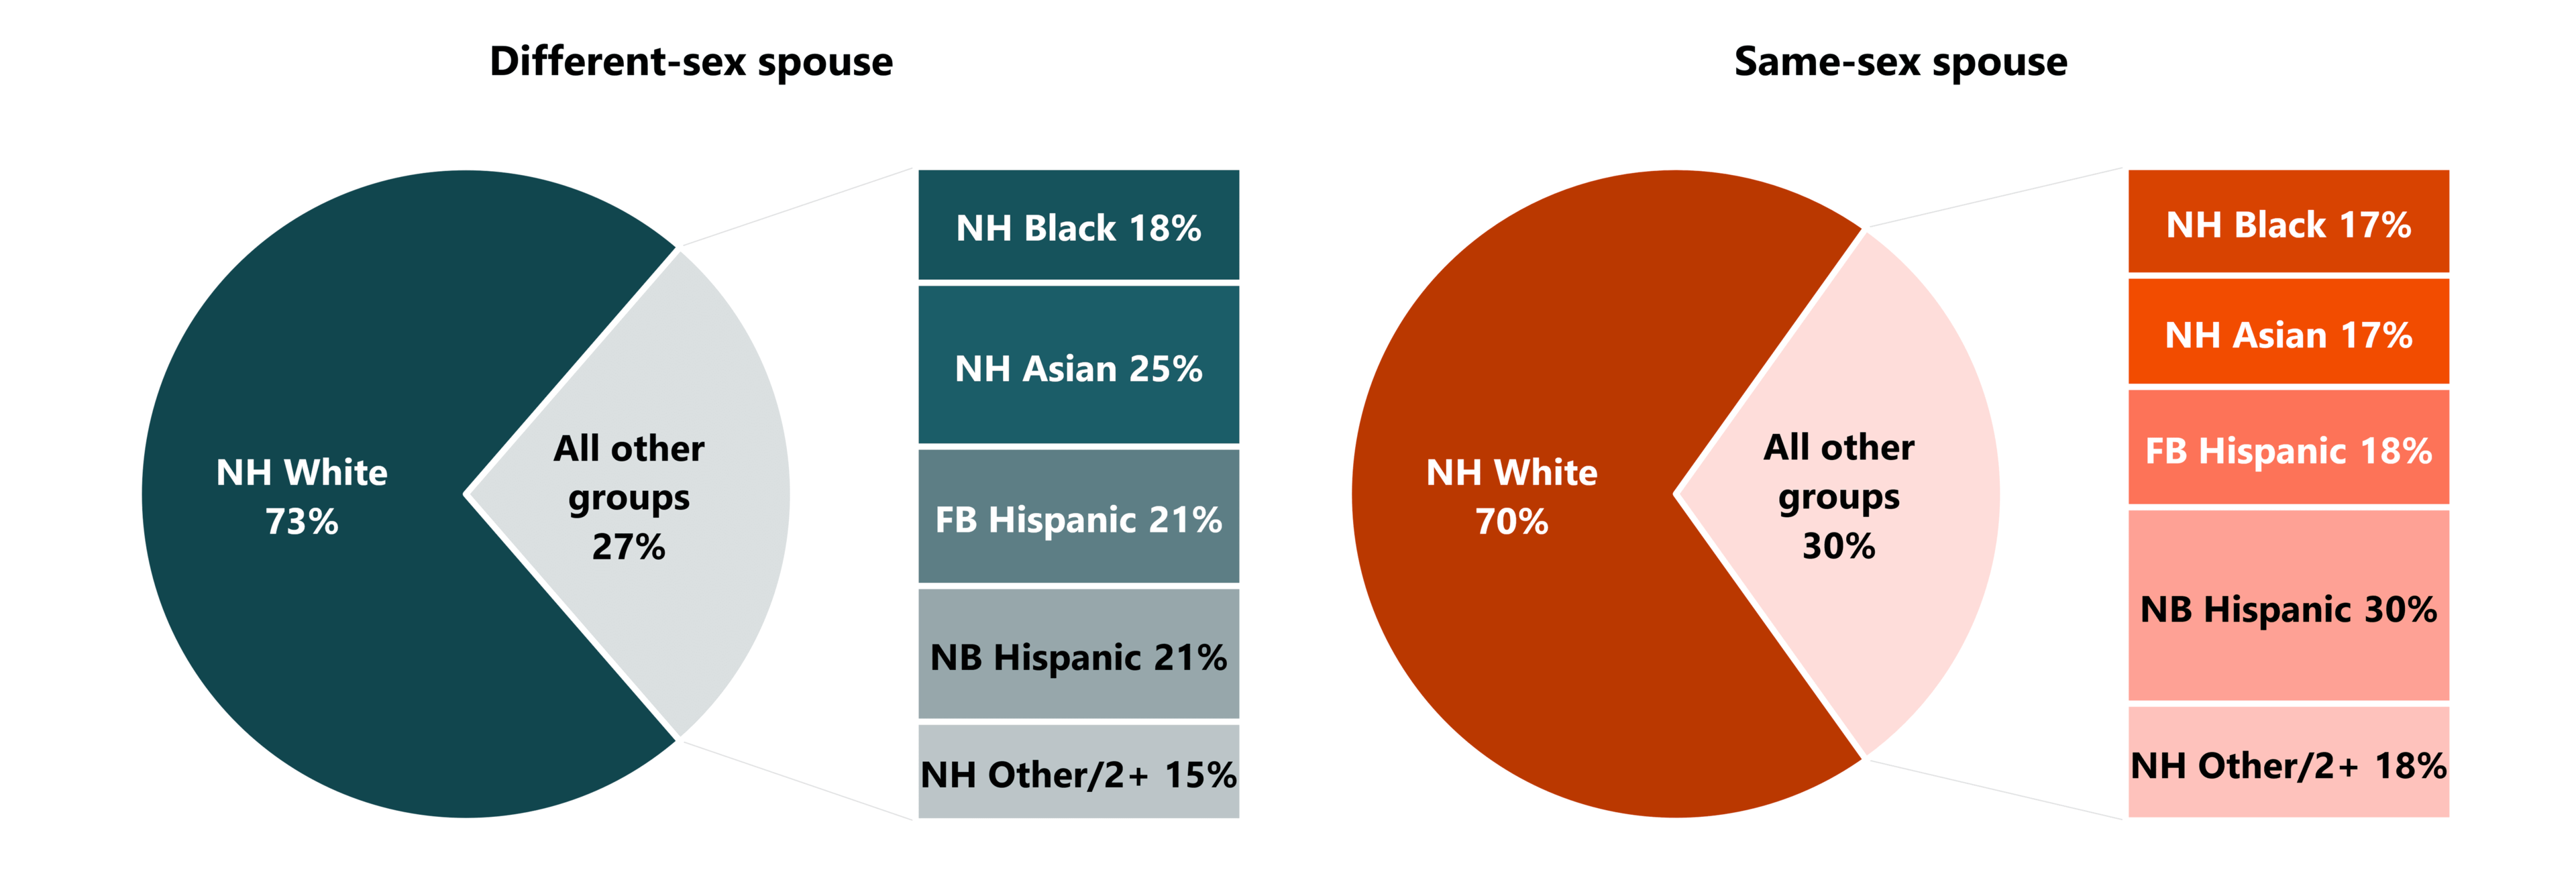
- The share of individuals married to a different-sex spouse and non-Hispanic White was slightly larger than the share of individuals married to a same-sex spouse, 73% compared to 70%.
- Similar shares of individuals married to different-sex and same-sex spouses were non-Hispanic Black (18% vs. 17%).
- Greater shares of individuals married to a different-sex spouse were non-Hispanic Asian (25% vs. 17%) or foreign-born Hispanic (21% vs. 18%) than those married to a same-sex spouse.
- A larger share of individuals married to same-sex spouses were native-born Hispanic (30% versus 21%) or non-Hispanic Other/2+ races (18% vs. 15%) than those married to different-sex spouses.
Figure 5. Race, Hispanic Origin, and Nativity by Couple Type, 2024
Source: NCFMR analyses U.S. Census Bureau, American Community Survey, PUMS, 1-year est., 2024
Note. NH = Non-Hispanic. FB = Foreign-born. NB = Native-born. “NH Asian” includes non-Hispanic individuals identifying as Asian or Native Hawaiian and Other Pacific Islander. “Other/2+ Races” includes non-Hispanic individuals identifying as American Indian or Alaska Native alone, some other race alone, or two or more races. Categories may not sum to 100% due to rounding.
This Family Profile is an update of: FP-24-06

Data Source:
United States Census Bureau, American Community Survey, Public Use Microdata Sample, 1-year estimates, 2024
References:
Westrick-Payne, K. K., & Manning W. D. (2024). Married same-sex and different sex couples: A demographic portrait, 2022. Family Profiles, FP-24-06. Bowling Green, OH: National Center for Family & Marriage Research. https://doi.org/10.25035/ncfmr/fp-24-06
Suggested Citation:
Westrick-Payne, K. K., & Manning W. D. (2026). Married same-sex and different sex couples: A demographic portrait, 2024. Family Profiles, FP-26-10. Bowling Green, OH: National Center for Family & Marriage Research. https://doi.org/10.25035/ncfmr/fp-26-10.html
Updated: 07/08/2026 08:19PM