
Grandparents’ Characteristics by Age Group, 2025
Family Profile No. 21, 2026
Author: Krista K. Westrick-Payne
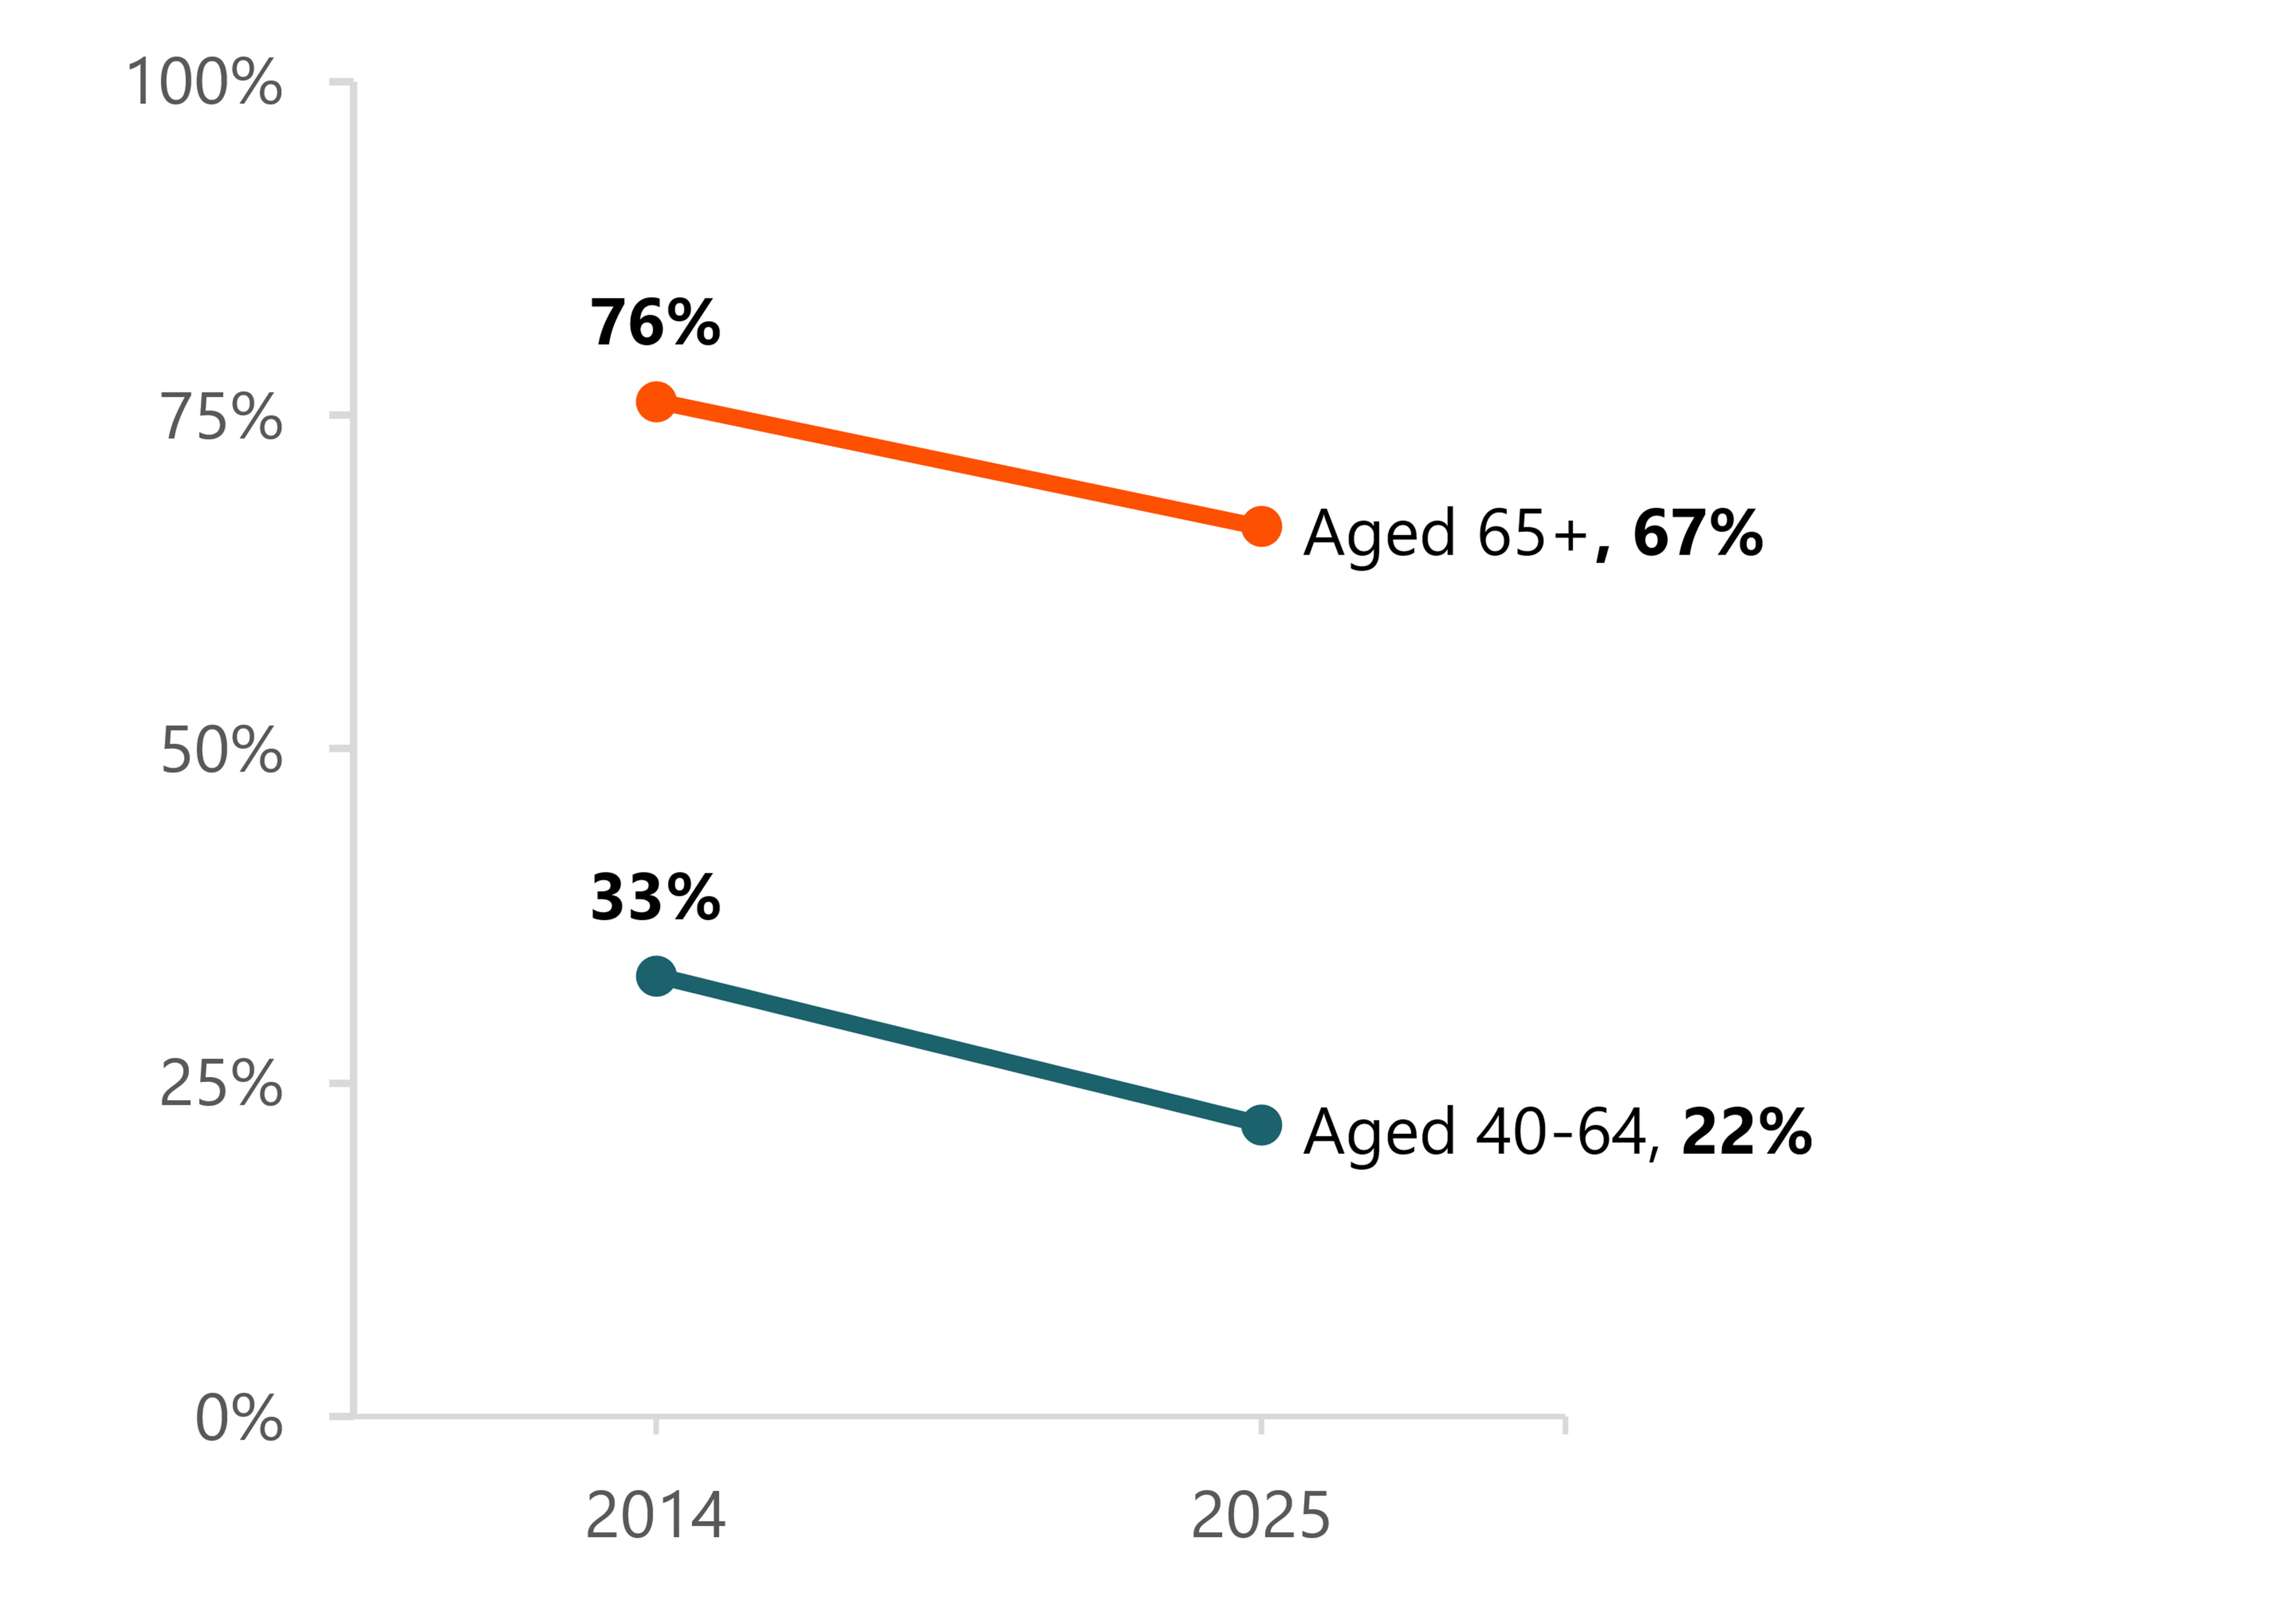
In 2025 39% of adults over age 40 were grandparents and the average age of grandparents in the U.S. was 69 years, up from 68 years in 2022 (Westrick-Payne, 2024). Grandparenthood is more common among older adults (aged 65 and older) than those in midlife (aged 40-64). In 2025, the percentage of older adults who were grandparents (67%) was 3 times as high as the percentage among those in midlife (22%). Data from the 2025 panel of the Survey of Income and Program Participation (SIPP) are used to update FP-18-04 (Wu, 2018), FP-23-02 (Westrick-Payne, 2023), and FP-24-20 (Westrick-Payne, 2024) by comparing midlife and older grandparents across demographic characteristics in 2025. The SIPP is a nationally representative household-based survey that directly asks respondents whether they are a grandparent, making it one of the few national surveys that identify nonresident grandparents.
Prevalence of Grandparenthood by Age Group
- About one-fifth (22%) of midlife adults (aged 40-64) were grandparents, representing nearly 22.5 million adults. This was lower than in 2014, when one-third (33%) of midlife adults were grandparents.
- Over two-thirds (67%) of older adults (aged 65+) were grandparents. This figure represents 41.1 million adults. This share was also lower than in 2014, when 3-in-4 (76%) were grandparents.
- Among grandparents in 2025 about one-third (35%) were in midlife (ages 40-64) and two-thirds (65%) were age 65 or older (not shown).
Figure 1. Grandparenthood by Age Group, 2014 & 2025
Source: NCFMR analyses of U.S. Census Bureau, Survey of Income and Program Participation, 2014 & 2025
Race/Ethnicity of Grandparents by Age Group
- Four-in-ten (40%) midlife grandparents and more than one-quarter (28%) of older grandparents were members of a racial/ethnic minority group.
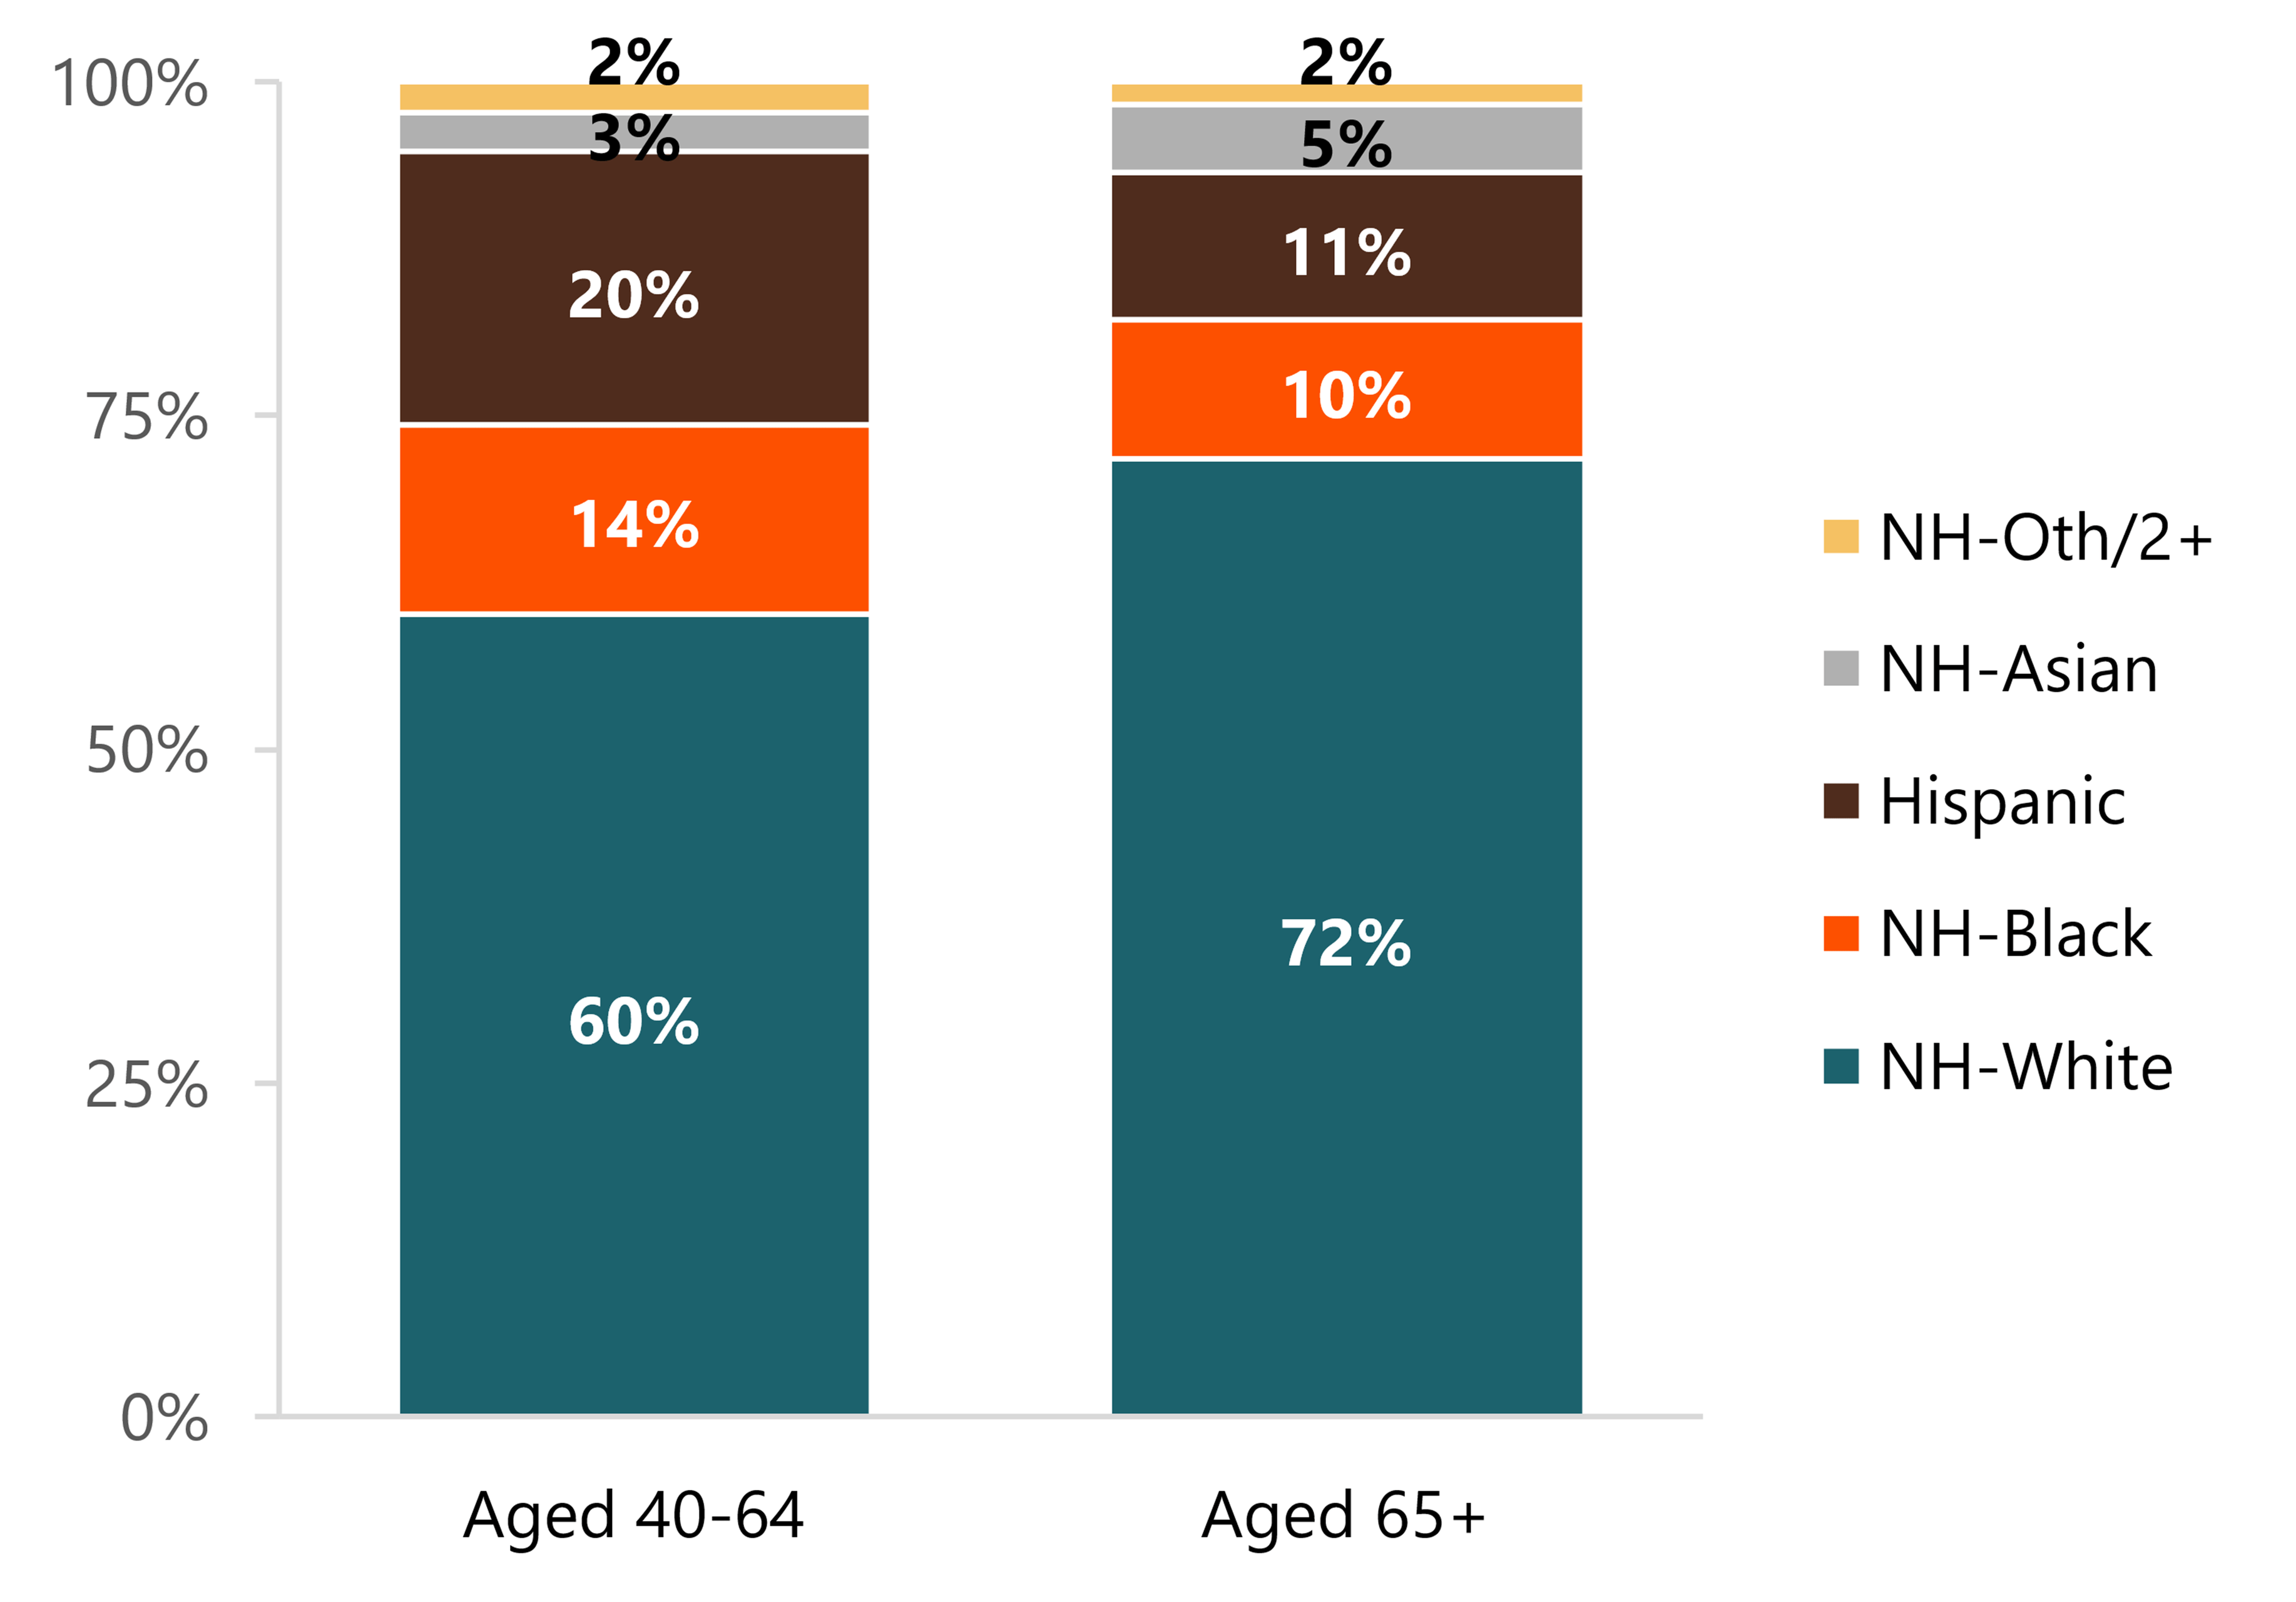
- One-fifth (20%) of midlife grandparents were Hispanic and 14% were non-Hispanic Black. Only 3% of midlife grandparents were non-Hispanic Asian and 2% were non-Hispanic Other/2+ Races.
- One-in-ten (10%) older grandparents were non-Hispanic Black, and a near equal share were Hispanic (11%). A small share was non-Hispanic Asian (5%) or non-Hispanic Other/2+ Races (2%).
- Non-Hispanic Whites composed a higher proportion of older grandparents than midlife grandparents (72% and 60%, respectively).
Figure 2. Race/Ethnicity of Grandparents by Age Group, 2025
Source: NCFMR analyses of U.S. Census Bureau, Survey of Income and Program Participation, 2014 & 2025
Note. NH = non-Hispanic. Other/2+ Races includes non-Hispanic individuals identifying as American Indian or Alaska Native alone, Native Hawaiian or Other Pacific Islander alone, or two or more races. Categories may not sum to 100% due to rounding.
Educational Attainment of Grandparents by Age Group
- Educational attainment differences between midlife and older grandparents were modest.
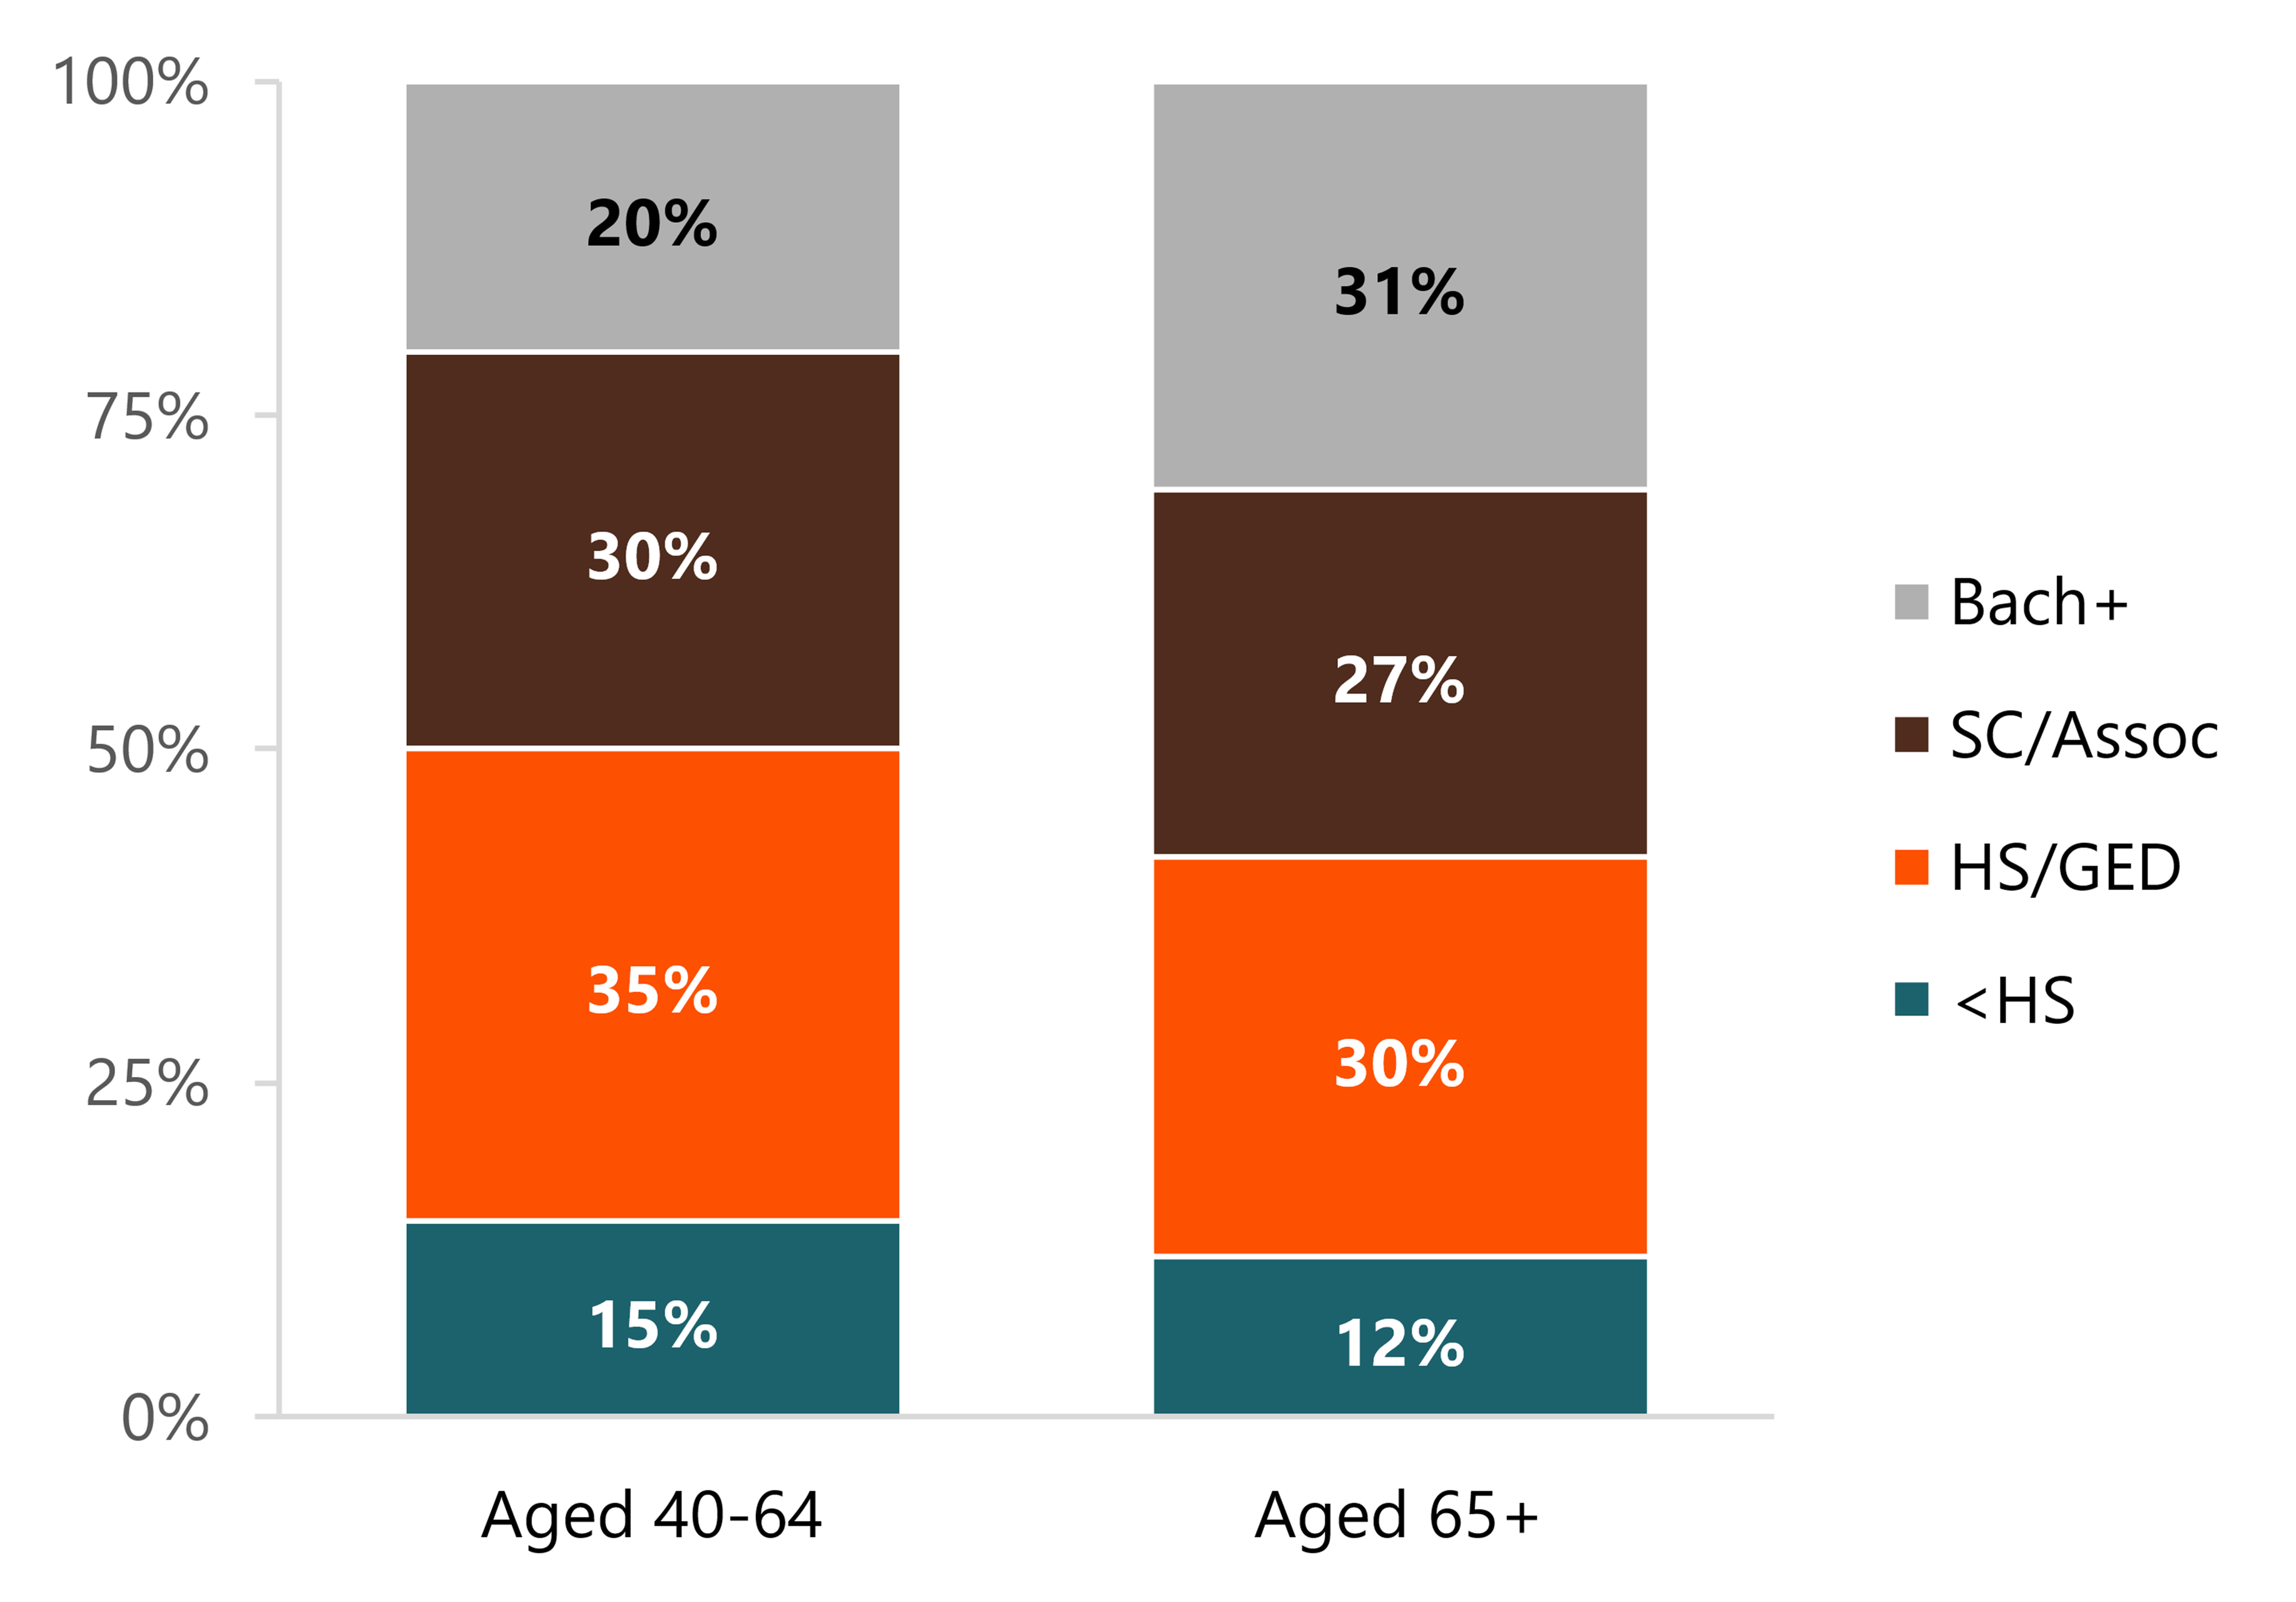
- Two-in-ten (20%) midlife grandparents had at least a bachelor’s degree compared to about three-in-ten (31%) older grandparents.
- Similar shares of midlife and older grandparents had some college or an associate degree: 30% among midlife grandparents and 27% among older grandparents.
- Slightly more than one-third (35%) of midlife grandparents had a high school diploma or GED compared to slightly less than one-third (30%) of older grandparents.
- Similar shares of midlife grandparents and older grandparents had less than a high school education (15% and 12%, respectively).
Figure 3. Educational Attainment of Grandparents by Age Group, 2025
Source: NCFMR analyses of U.S. Census Bureau, Survey of Income and Program Participation, 2014 & 2025
Note. HS = high school; SC = some college; Assoc = associate degree; Bach+ = bachelor’s degree or higher. Categories may not sum to 100% due to rounding.
Relationship Status of Grandparents by Age Group
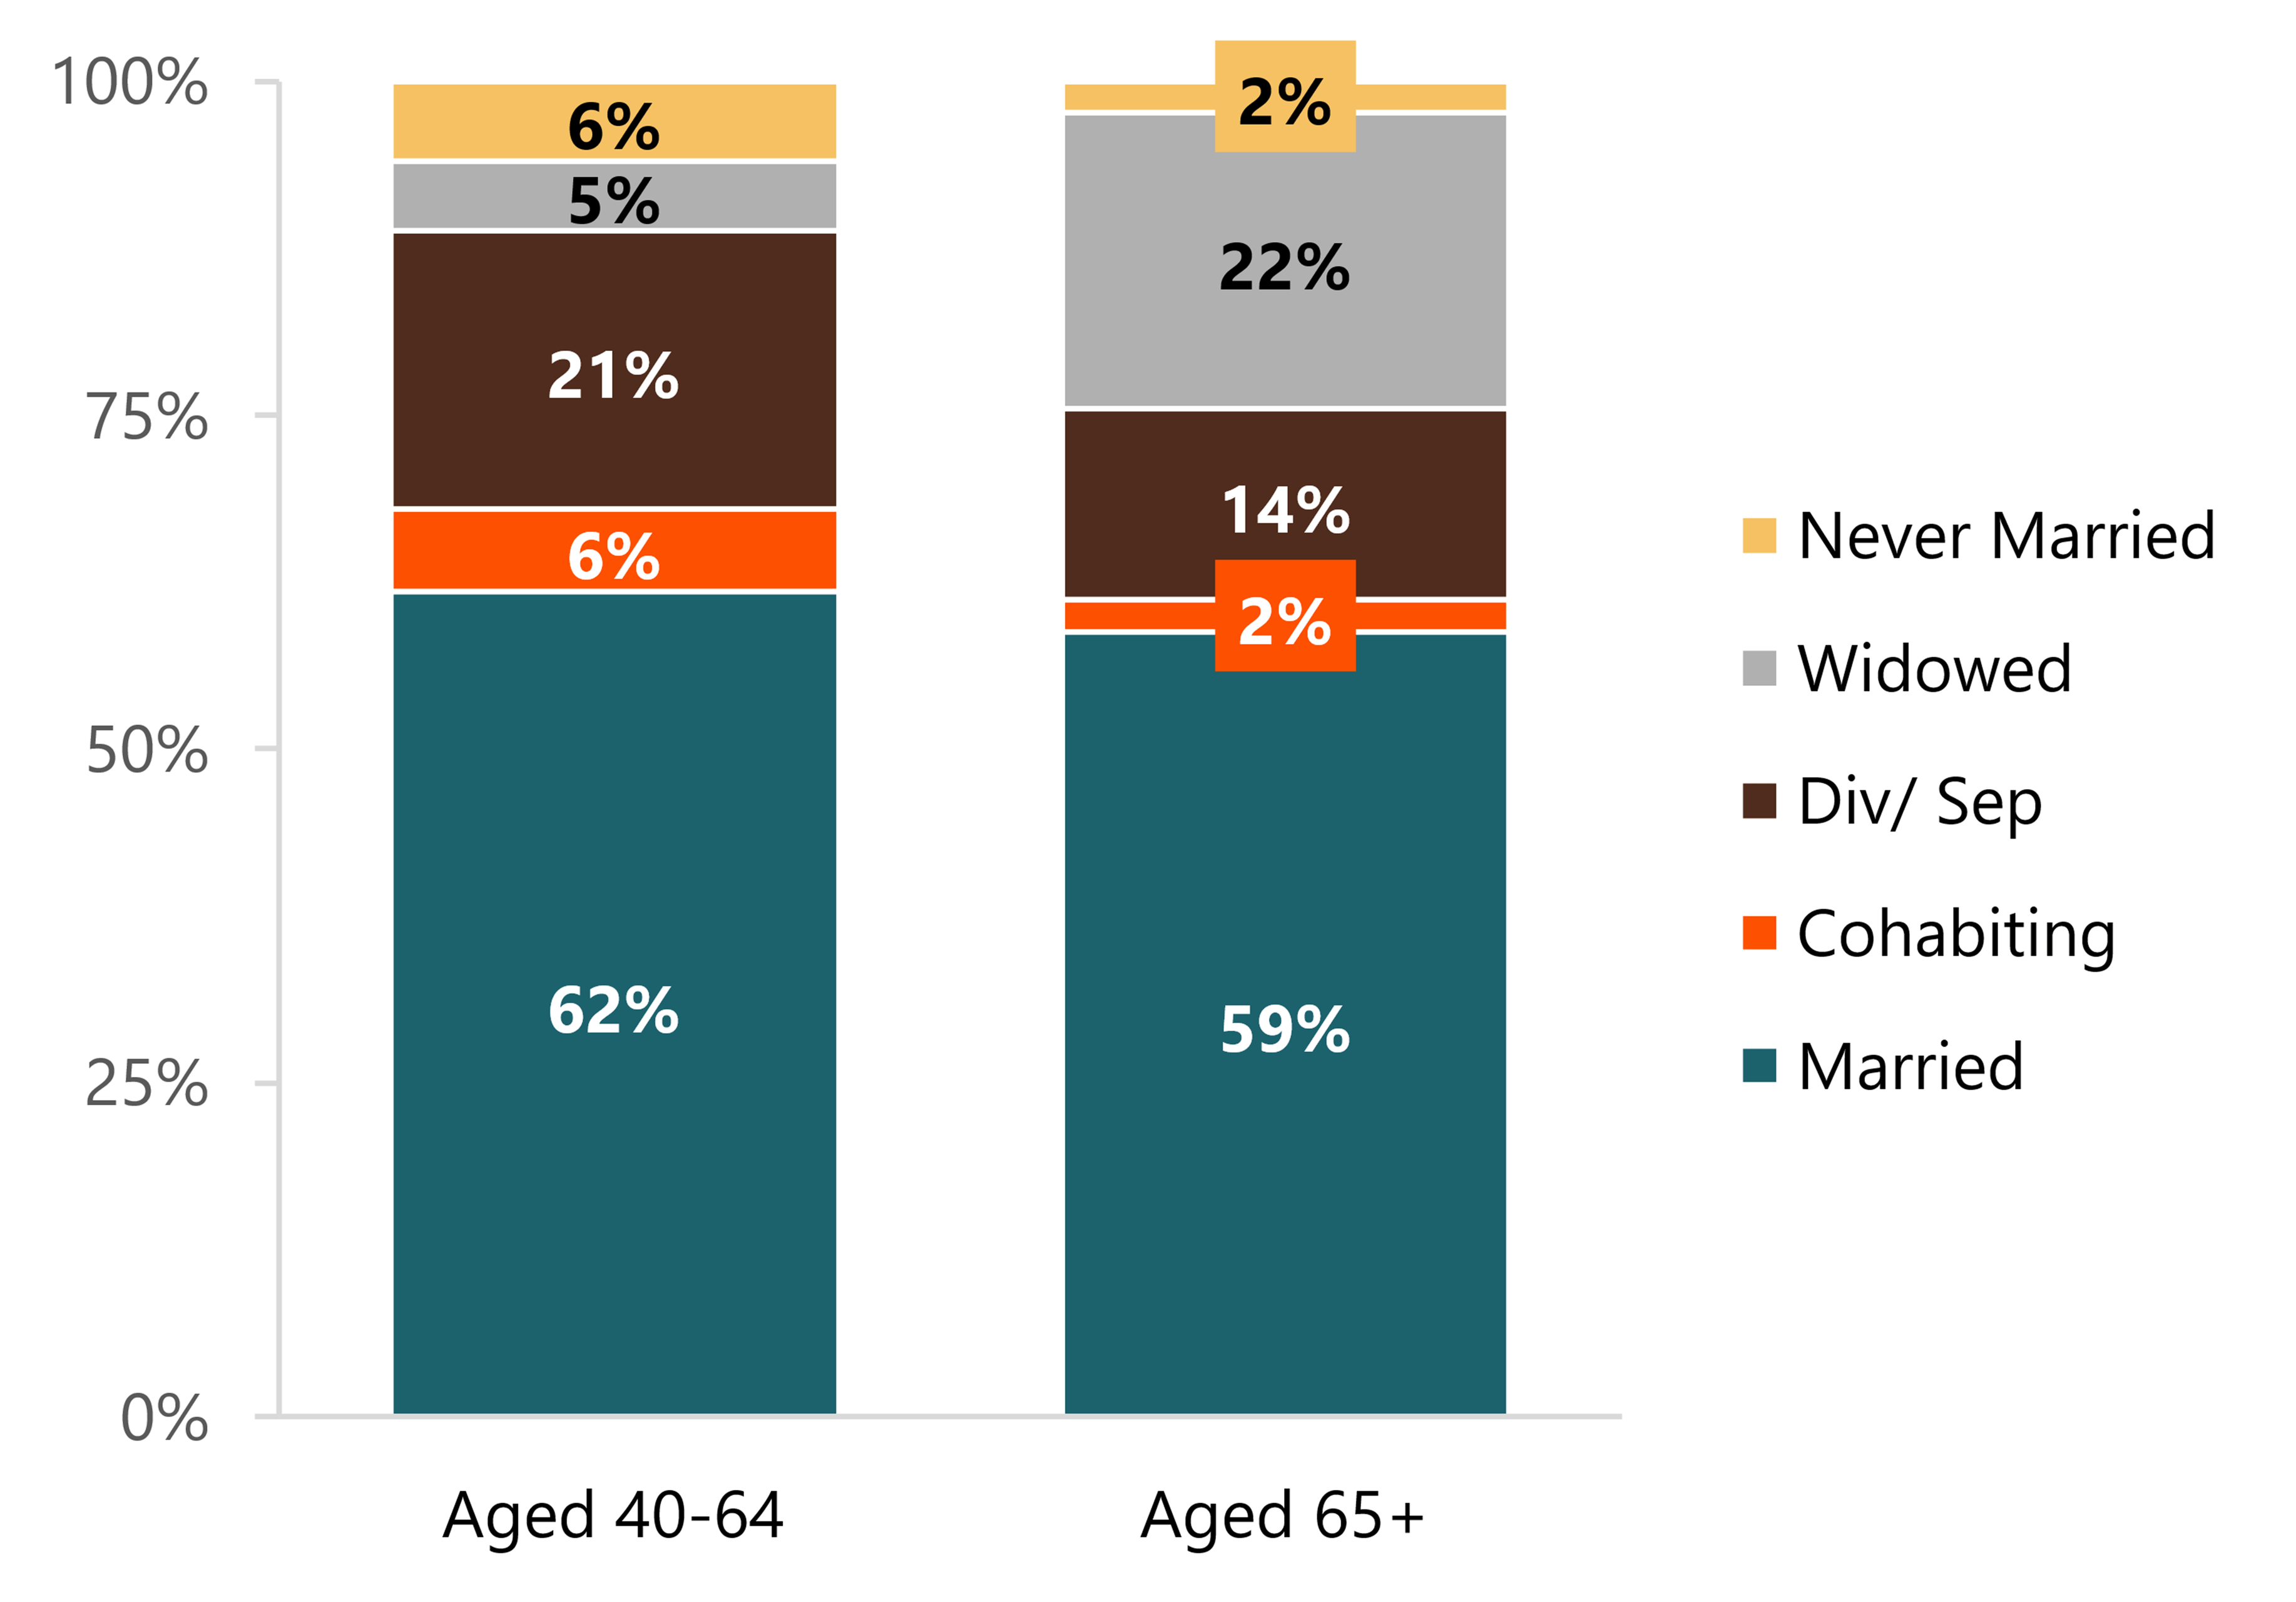
- Most grandparents were married, including 62% of midlife grandparents and 59% of older grandparents.
- About one-fifth (21%) of midlife grandparents were divorced or separated compared to 14% of their older counterparts.
- The share of widowed grandparents was more than four times as high among older grandparents as among midlife adults (22% vs. 5%).
- Few grandparents were cohabiting (6% of midlife grandparents and 2% of older grandparents).
- About 6% of midlife grandparents and only 2% of older grandparents had never married.
Figure 4. Relationship Status of Grandparents by Age Group, 2025
Source: NCFMR analyses of U.S. Census Bureau, Survey of Income and Program Participation, 2014 & 2025
Note. Div = divorced; Sep = separated. Categories may not sum to 100% due to rounding.

Data Source:
U.S. Census Bureau, Survey of Income and Program Participation 2014, Wave 1, and 2025. https://www.census.gov/programs-surveys/sipp.html
References:
Westrick-Payne, K. K. (2023). Grandparents’ characteristics by age. Family Profiles, FP-23-02. Bowling Green, OH: National Center for Family & Marriage Research. https://doi.org/10.25035/ncfmr/fp-23-02
Westrick-Payne, K. K. (2024). Grandparents’ characteristics by age, 2022. Family Profiles, FP-24-20. Bowling Green, OH: National Center for Family & Marriage Research. https://doi.org/10.25035/ncfmr/fp-24-20
Wu, H. (2018). Grandparents’ characteristics by age. Family Profiles, FP-18-04. Bowling Green, OH: National Center for Family & Marriage Research. https://www.bgsu.edu/content/dam/BGSU/college-of-arts-and-sciences/NCFMR/documents/FP/wu-grandparent-characteristics-age-fp-18-04.pdf
Suggested Citation:
Westrick-Payne, K. K. (2026). Grandparents’ characteristics by age group, 2025. Family Profiles, FP-26-21. Bowling Green, OH: National Center for Family & Marriage Research. https://doi.org/10.25035/ncfmr/fp-26-21
Updated: 11/03/2026 05:32PM