
Trends in the Share of Females Who Gave Birth within the Past 12 Months, 2008-2024
Family Profile No. 17, 2026
Author: Krista K. Westrick-Payne
Overall trends in fertility can mask considerable variation in how patterns of childbearing are changing across the population. Examining changes across demographic groups provides a more detailed picture of who has experienced declines in recent childbearing, which groups have experienced relatively little change, and where increases have occurred. Using data from the American Community Survey (ACS), this profile examines trends from 2008 to 2024 in the share of females aged 15-50 who gave birth in the past 12 months by marital status, age, educational attainment and race/ethnicity. We note that the dates of marriage and childbirth are not asked, so these estimates are not precise: they reflect birth experiences in the past 12 months and marital status at the time of interview. It is possible that married respondents were not married when their child was born and unmarried respondents were married when the child was born. This profile is a companion piece to Females Who Gave Birth in the Past 12 Months, 2024 (FP-26-16; Morrison & Westrick-Payne, 2026).
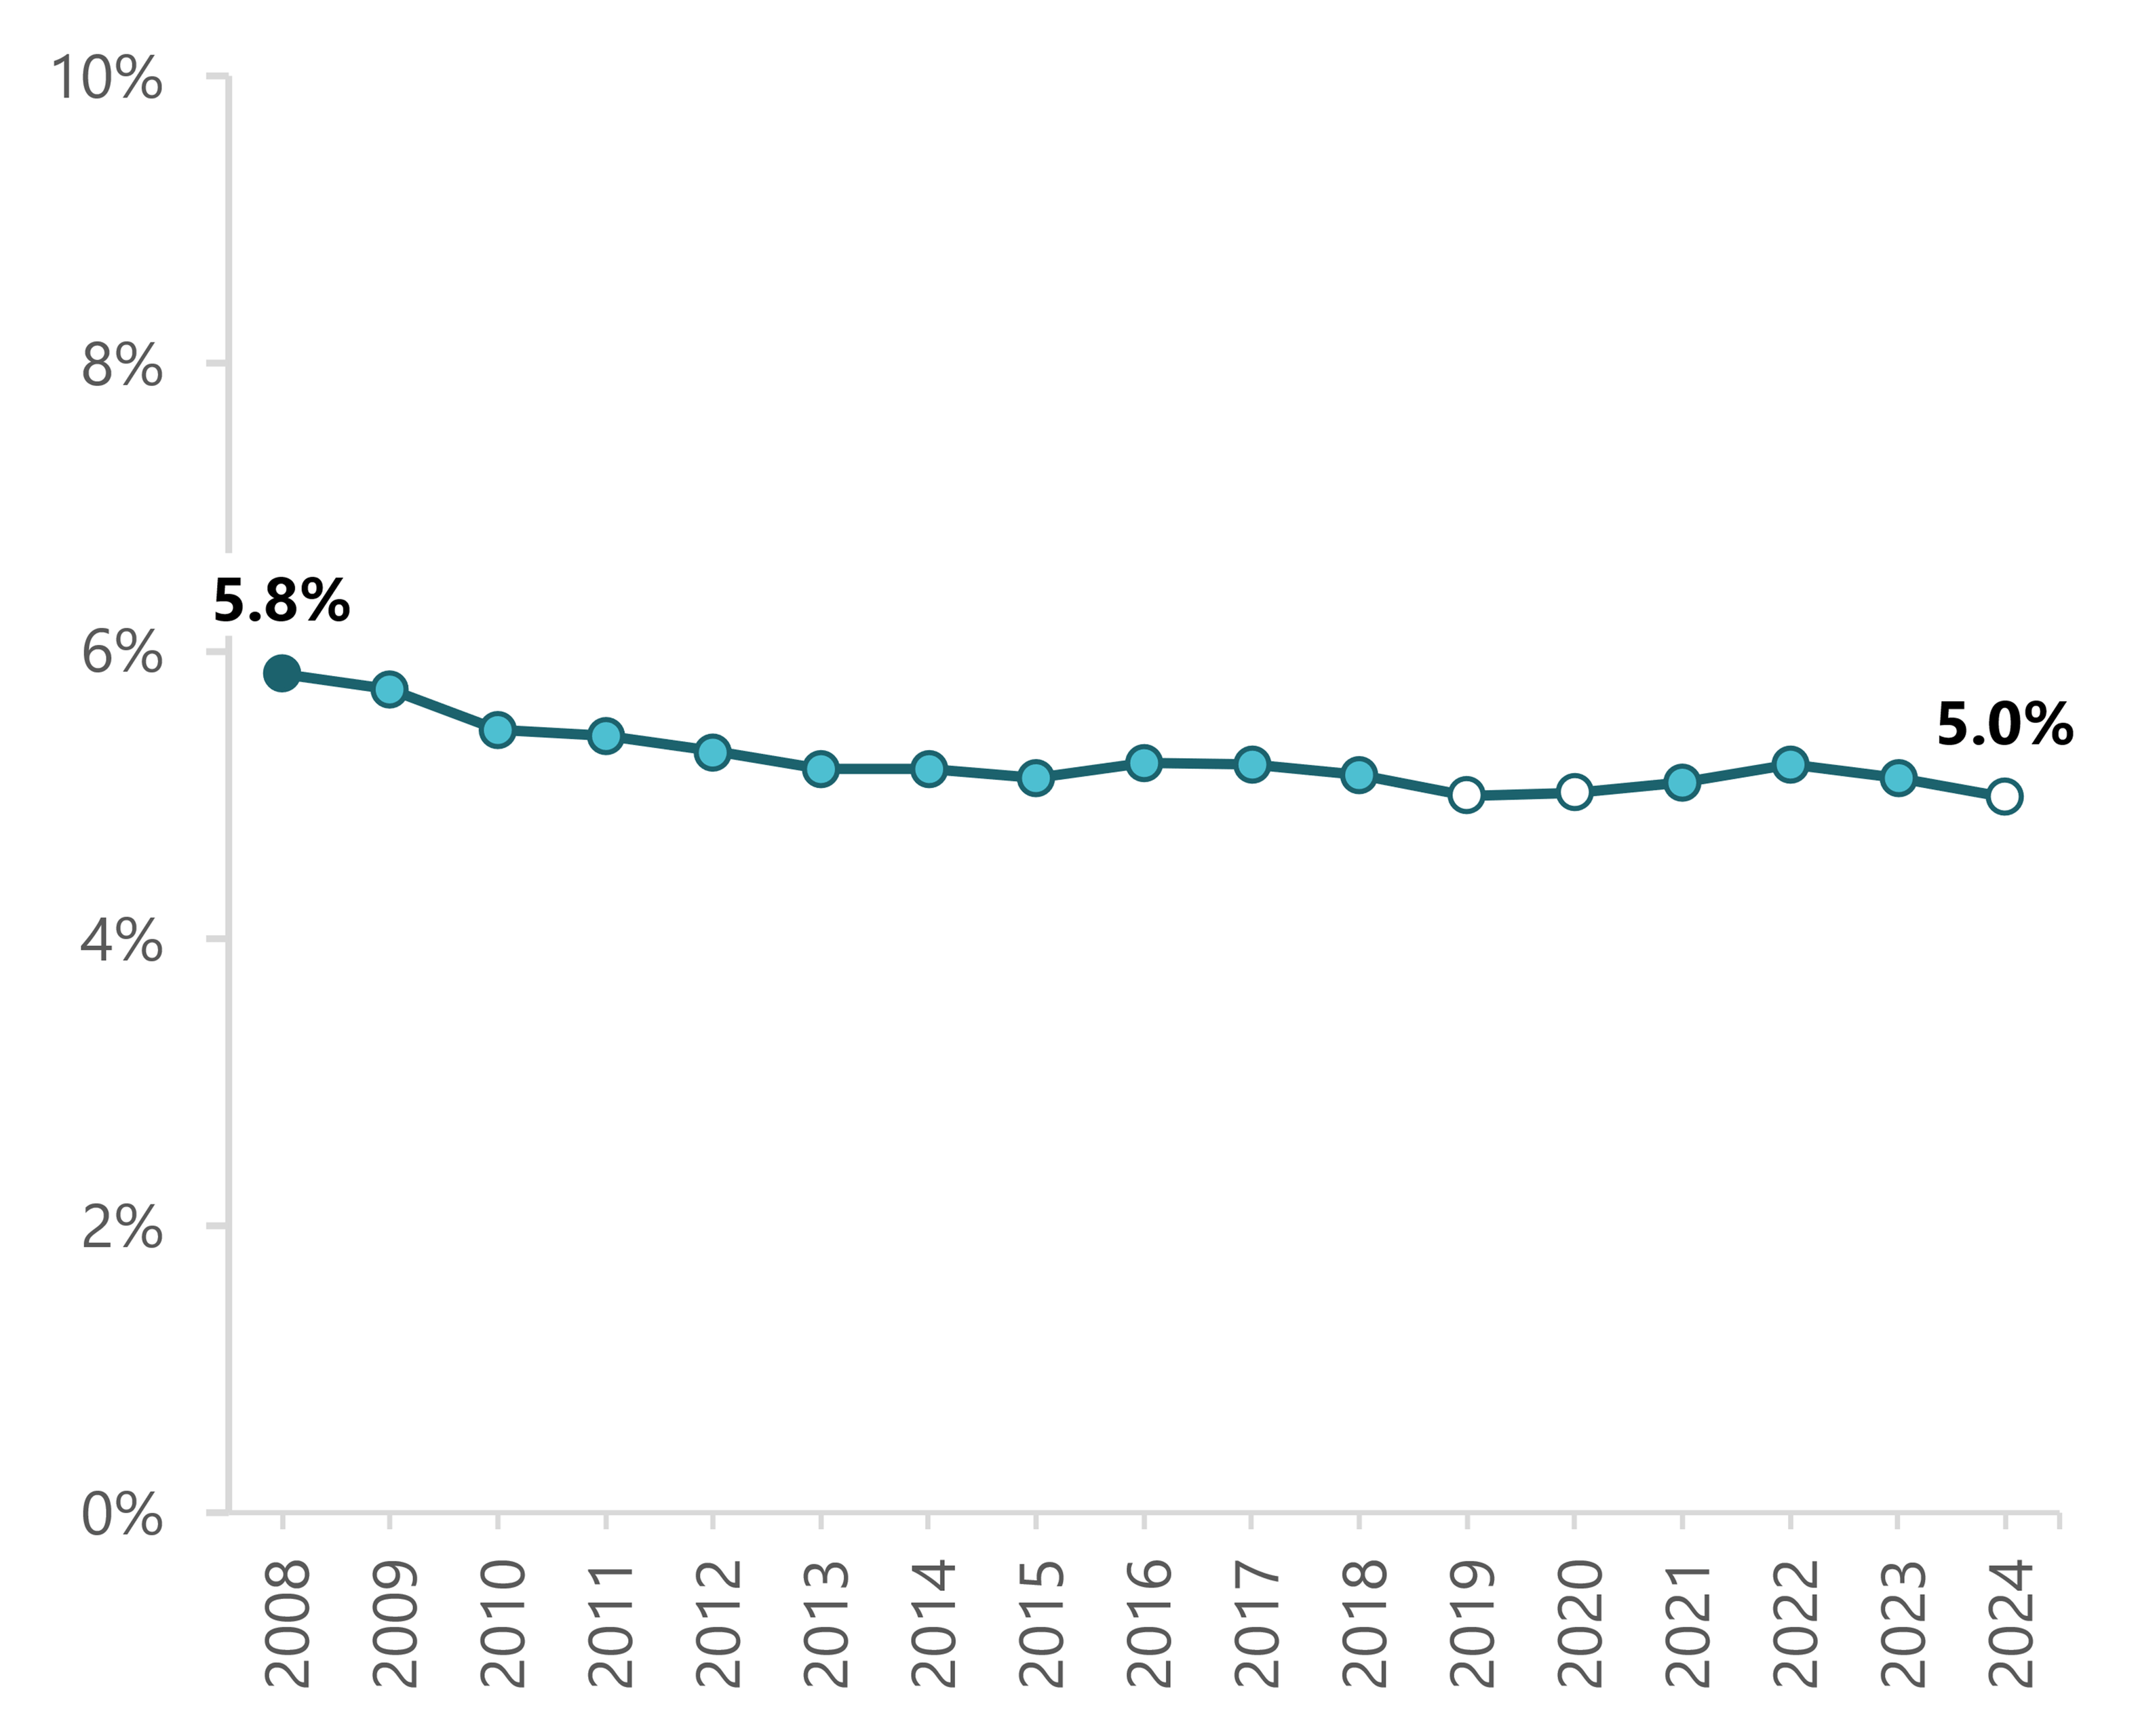
- Data from 2024 indicate 5.0% of females aged 15-50 gave birth in the past 12 months, the same as in 2019 and 2020 and slightly lower than the 5.8% observed in 2008.
Figure 1. Trend in the Share of Females Aged 15-50 Who Gave Birth in the Past 12 Months, 2008-2024
Source: NCFMR analysis of American Community Survey, 1-Year Estimates, 2008-2024 (IPUMS USA)
Note. Due to data collection issues, fertility data were suppressed for 59 PUMAs in Florida, Georgia, Kansas, Montana, North Carolina, Ohio, and Texas in the 2012 ACS (IPUMS USA, 2026).
Marital Status
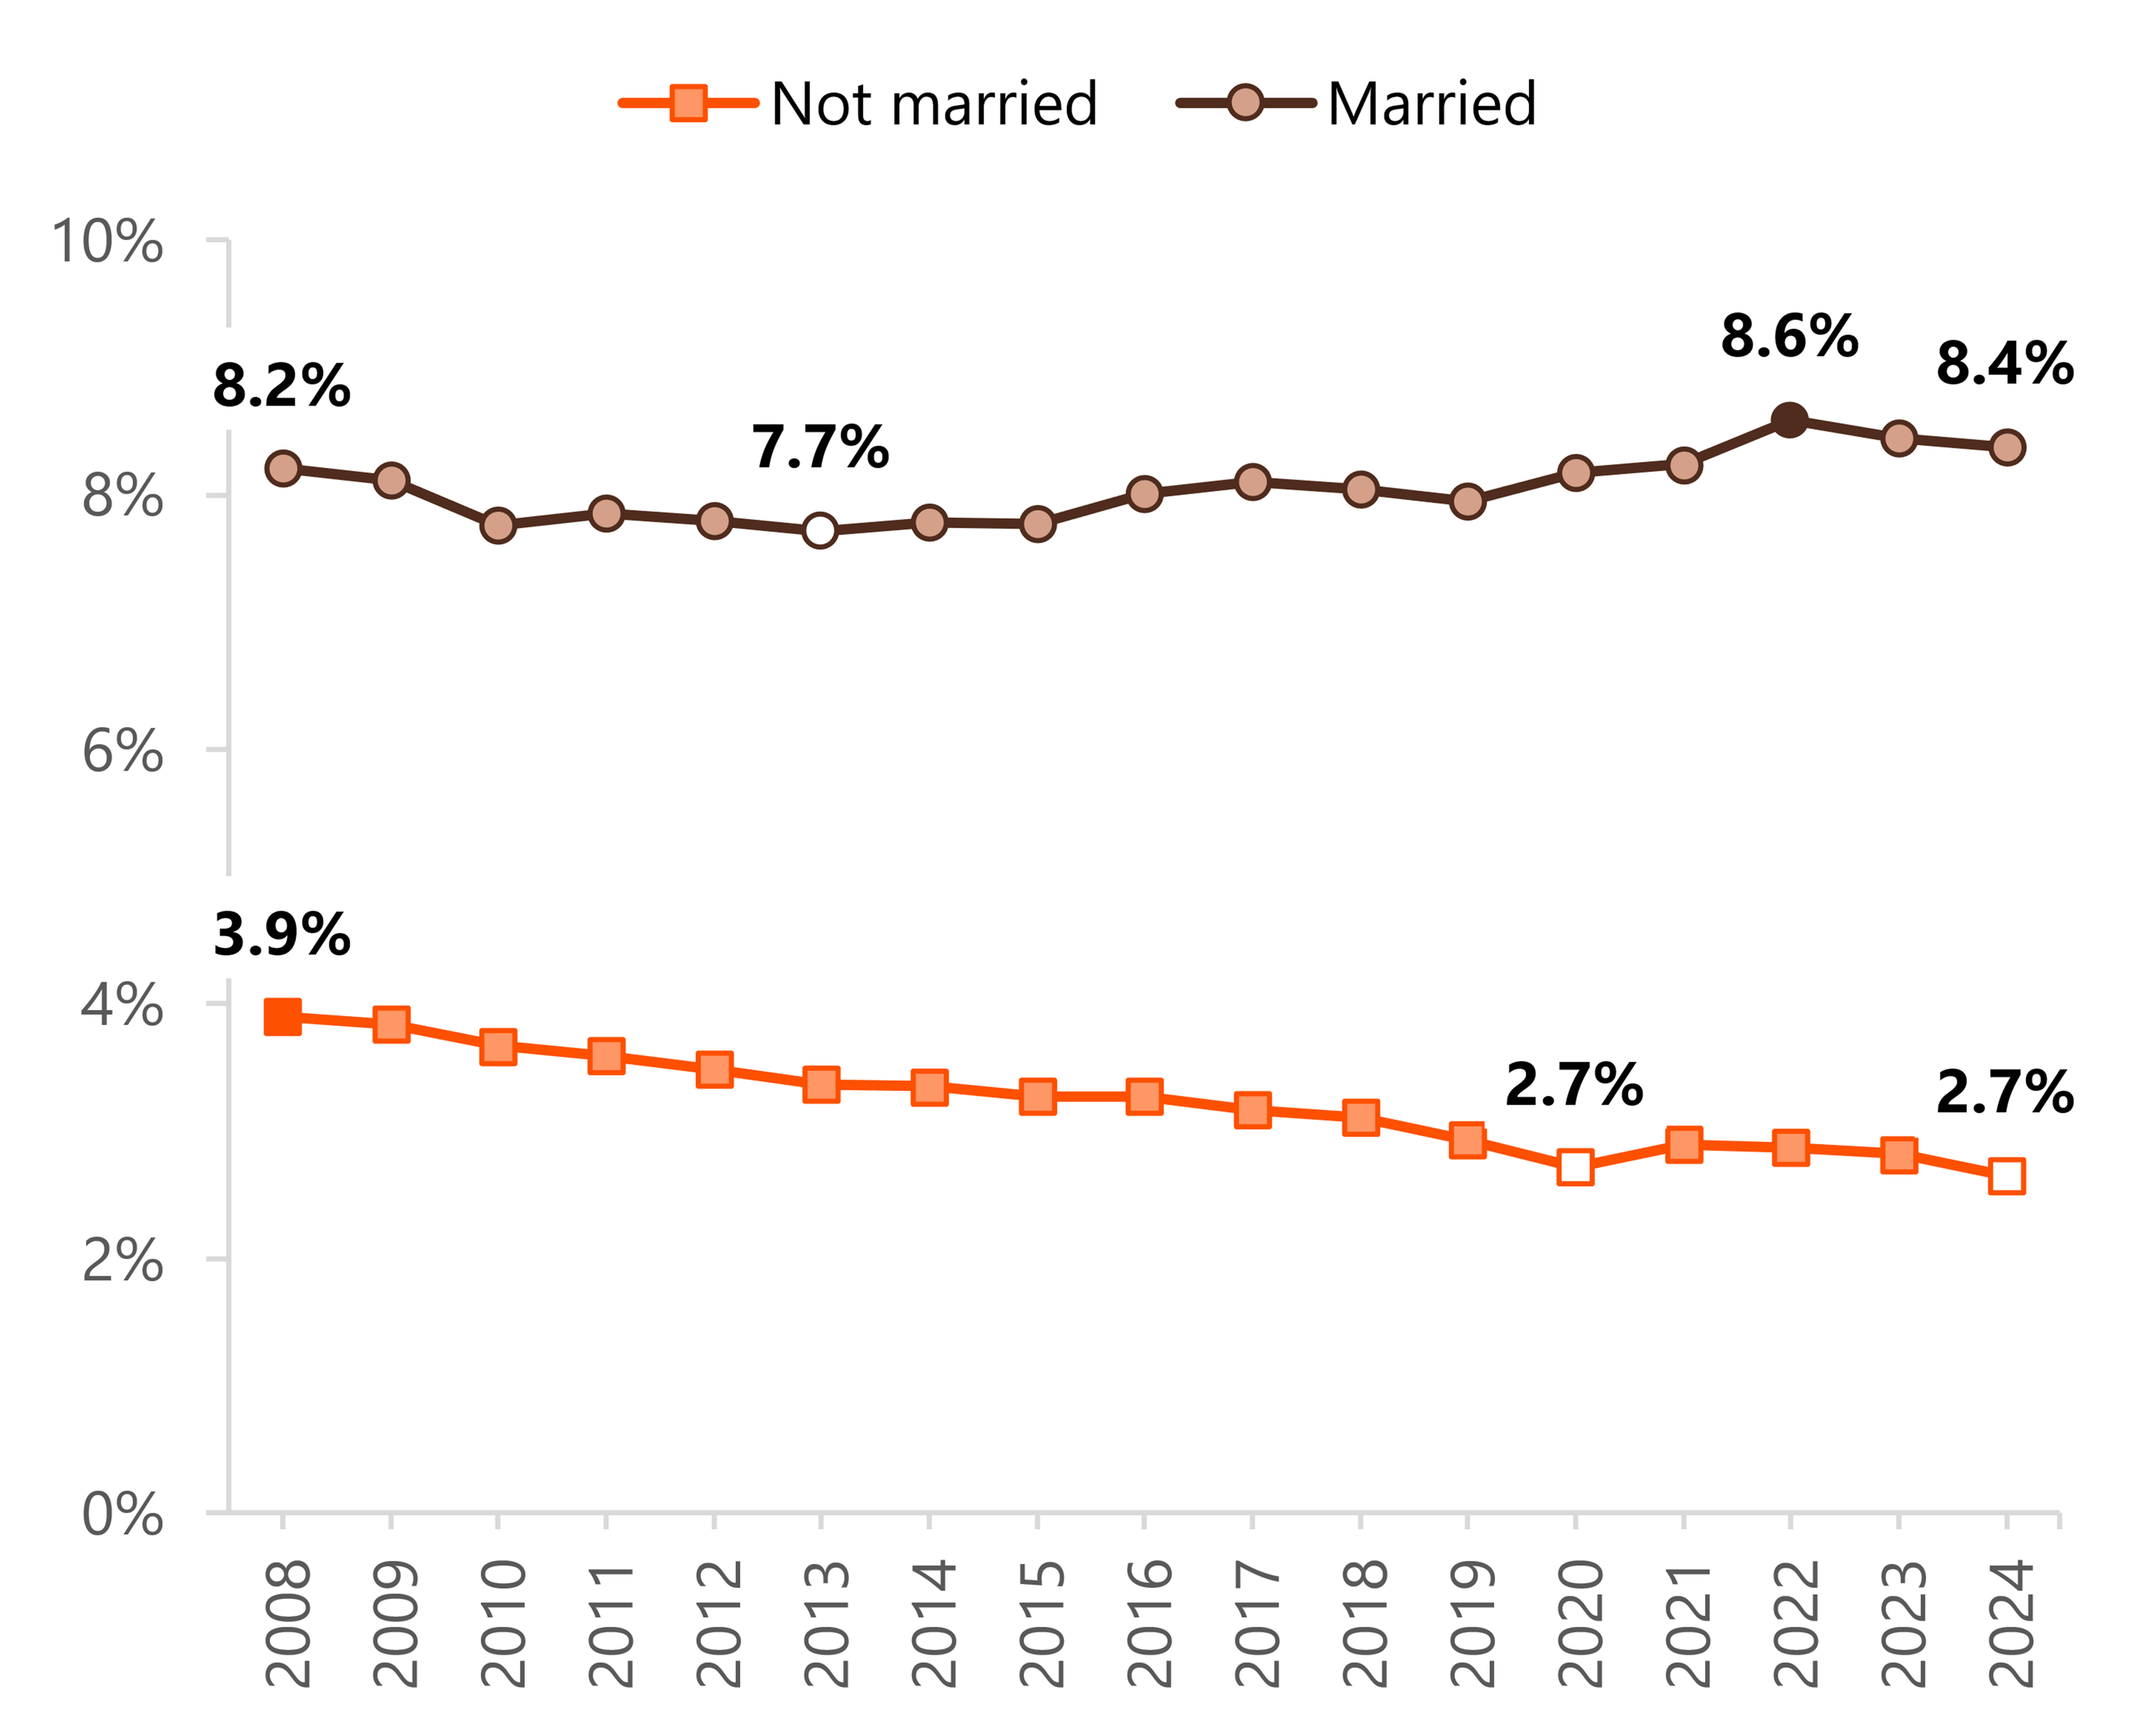
- The share of married females aged 15-50 who gave birth in the past 12 months has remained relatively stable from 2008 to 2024, ranging from a low of 7.7% in 2013 to a high of 8.6% in 2022. In 2024, the share was 8.4%.
- In contrast, the share of unmarried females aged 15-50 who gave birth in the past 12 months declined from 3.9% in 2008 to 2.7% in 2024, the lowest share observed during the period.
Figure 2. Share of Females Aged 15-50 Who Gave Birth in the Past 12 Months by Marital Status, 2008-2024
Source: NCFMR analysis of American Community Survey, 1-Year Estimates, 2008-2024 (IPUMS USA)
Note. Due to data collection issues, fertility data were suppressed for 59 PUMAs in Florida, Georgia, Kansas, Montana, North Carolina, Ohio, and Texas in the 2012 ACS (IPUMS USA, 2026).
Educational Attainment
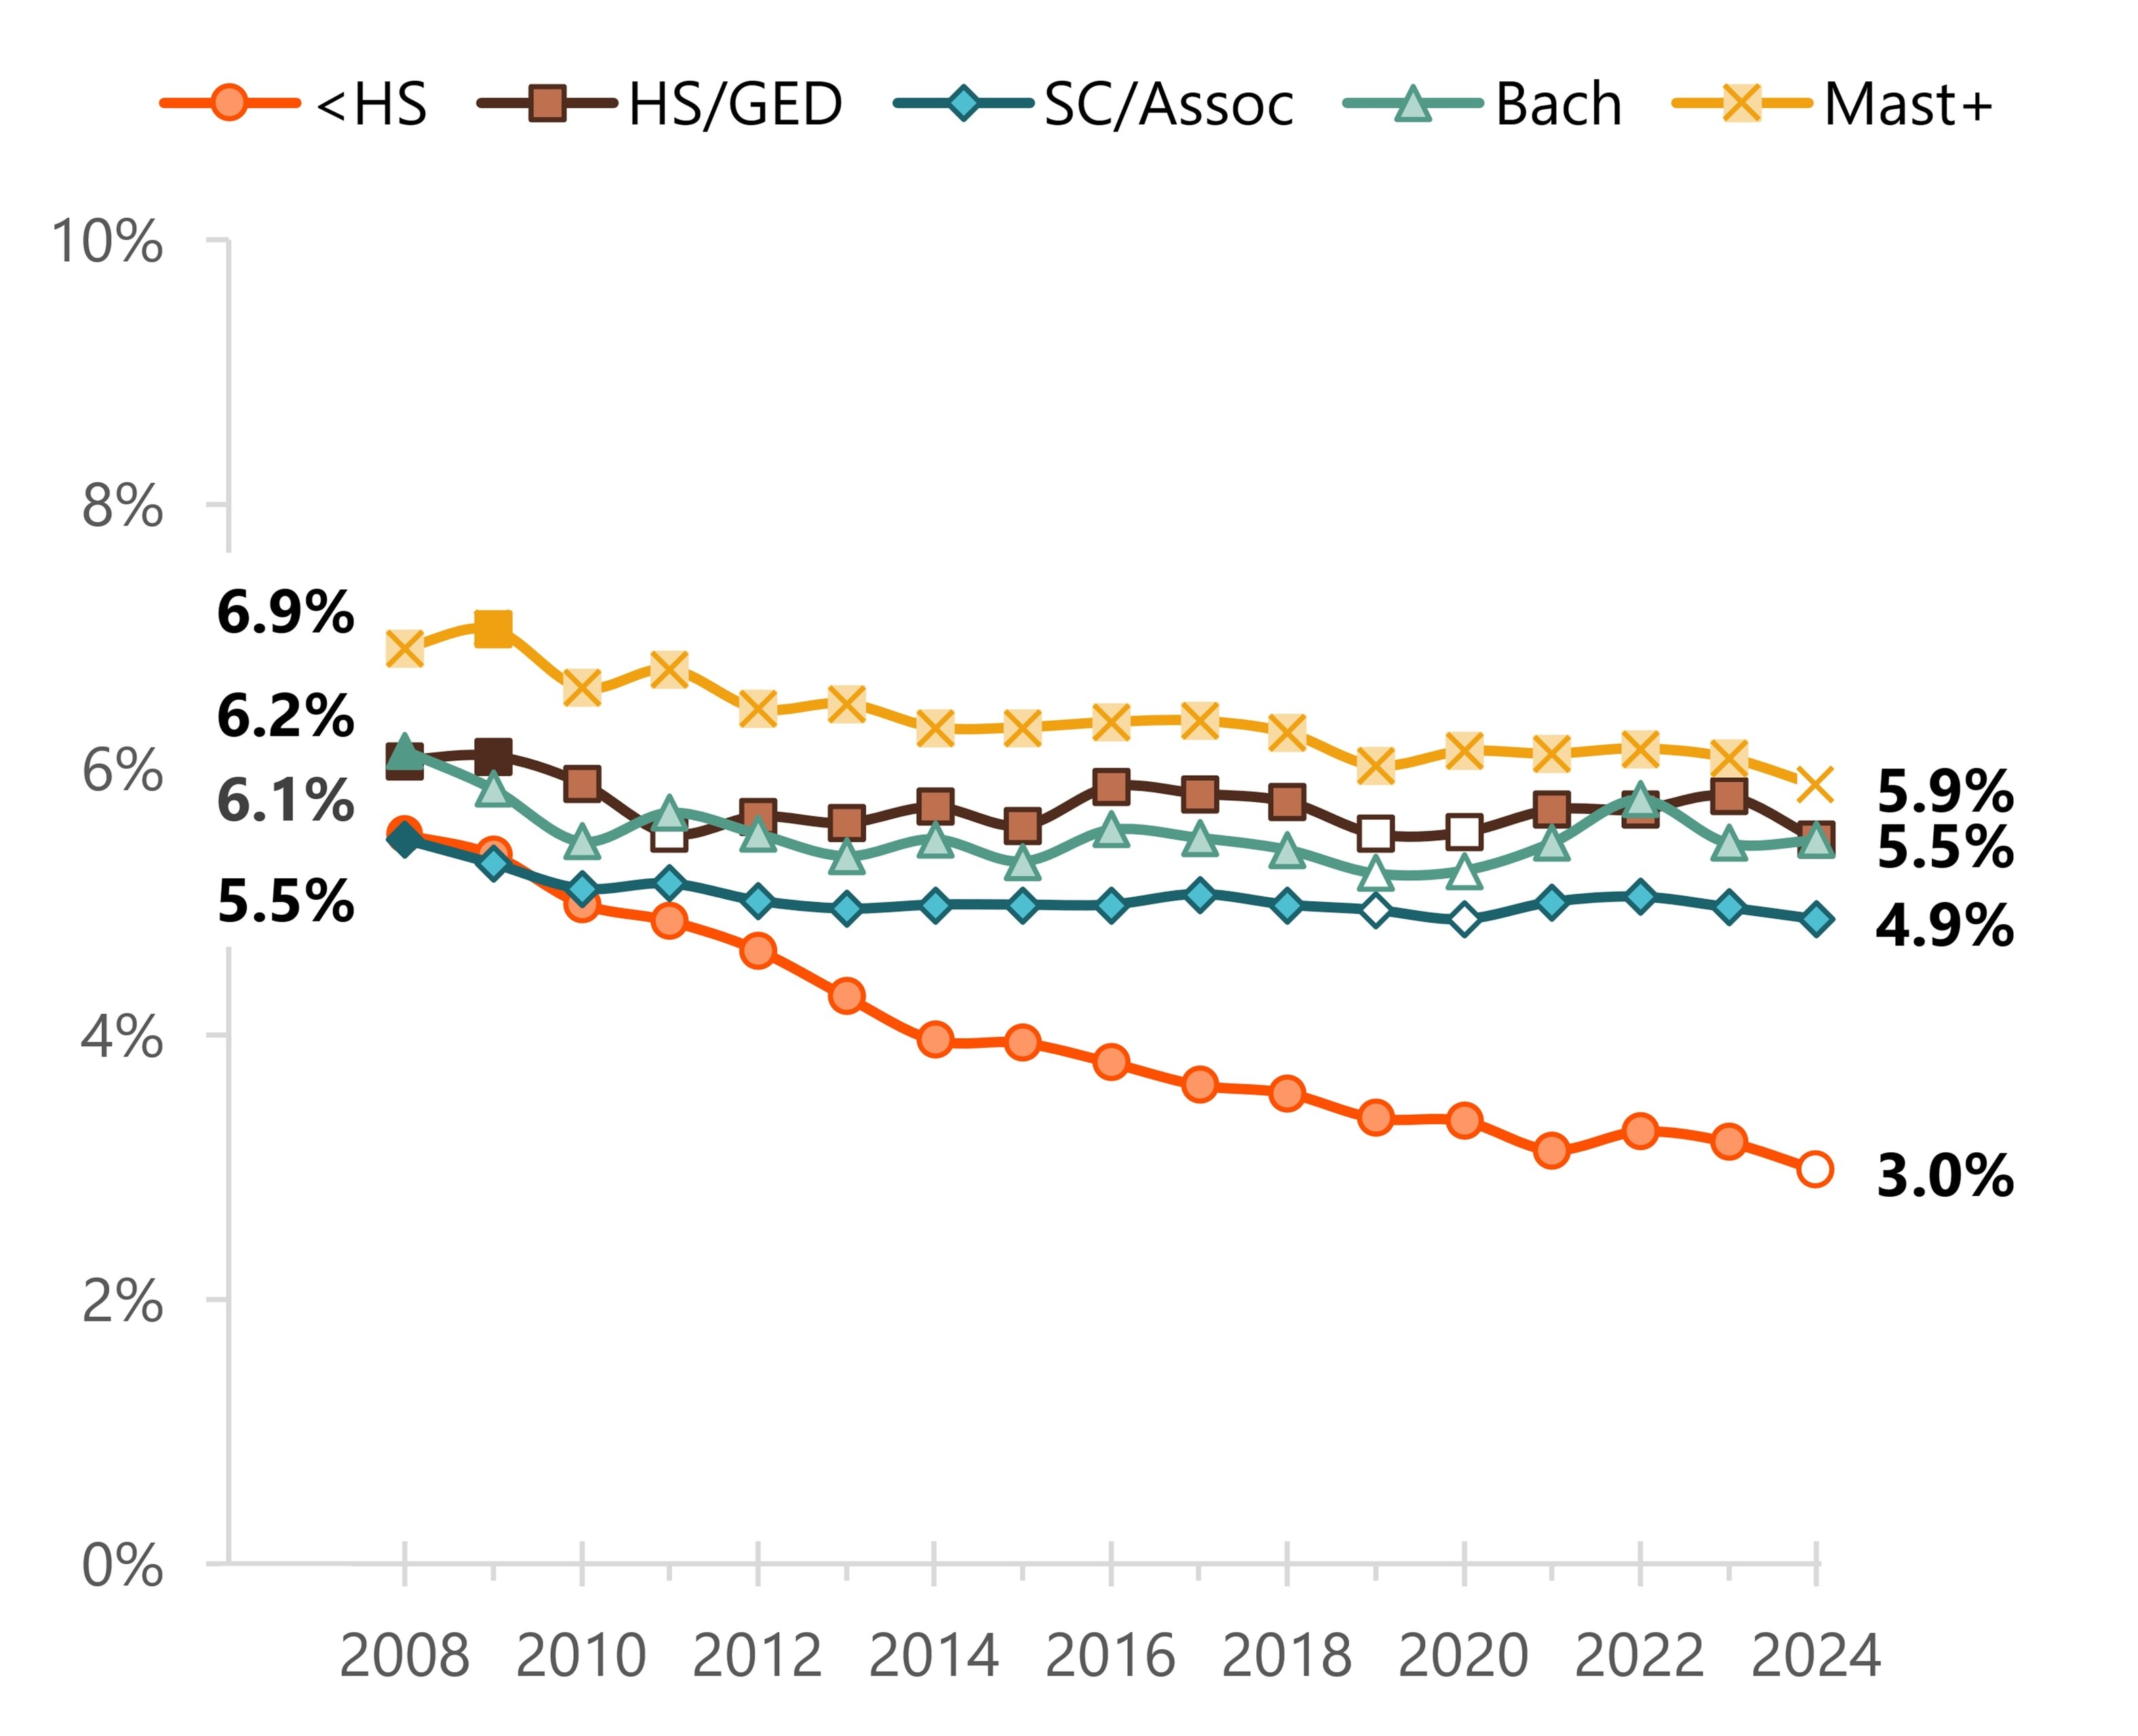
- From 2008 to 2024, the share of females aged 15-50 who gave birth in the past 12 months declined across all educational attainment groups, but some experienced greater proportional declines than others. As such, the gap between the highest and lowest shares nearly doubled over this time period, from 1.5% in 2008 to 2.9% in 2024.
- The steepest decline (nearly a 50% decline) from 2008 to 2024 was observed among females with less than a high school education, from 5.5% to 3.0%. They also had the lowest shares in both 2008 and 2024.
- Similar and slight declines occurred among those with a high school diploma/GED, some college/associate degree, and a bachelor’s degree. The shares having a birth in the past 12 months among females with a high school diploma/GED and those with a bachelor’s degree were also similar in 2008 (6.1% and 6.2%, respectively) and in 2024 (5.5% for both groups). Among those with some college/associate degree, 5.5% experienced a birth in the past 12 months in 2008 compared with 4.9% in 2024.
- Among those with at least a master’s degree, the share who experienced a birth in the past 12 months declined from 6.9% in 2008 to 5.9% in 2024. In both 2008 and 2024, this highly educated group had the highest share who gave birth in the past 12 months.
Figure 3. Share of Females Aged 15-50 Who Gave Birth in the Past 12 Months by Educational Attainment, 2008-2024
Source: NCFMR analysis of American Community Survey, 1-Year Estimates, 2008-2024 (IPUMS USA)
Note. Due to data collection issues, fertility data were suppressed for 59 PUMAs in Florida, Georgia, Kansas, Montana, North Carolina, Ohio, and Texas in the 2012 ACS (IPUMS USA, 2026). HS = high school; SC = some college; Assoc = associate degree; Bach = bachelor’s degree; Mast+ = master’s degree or higher.
Race and Ethnicity
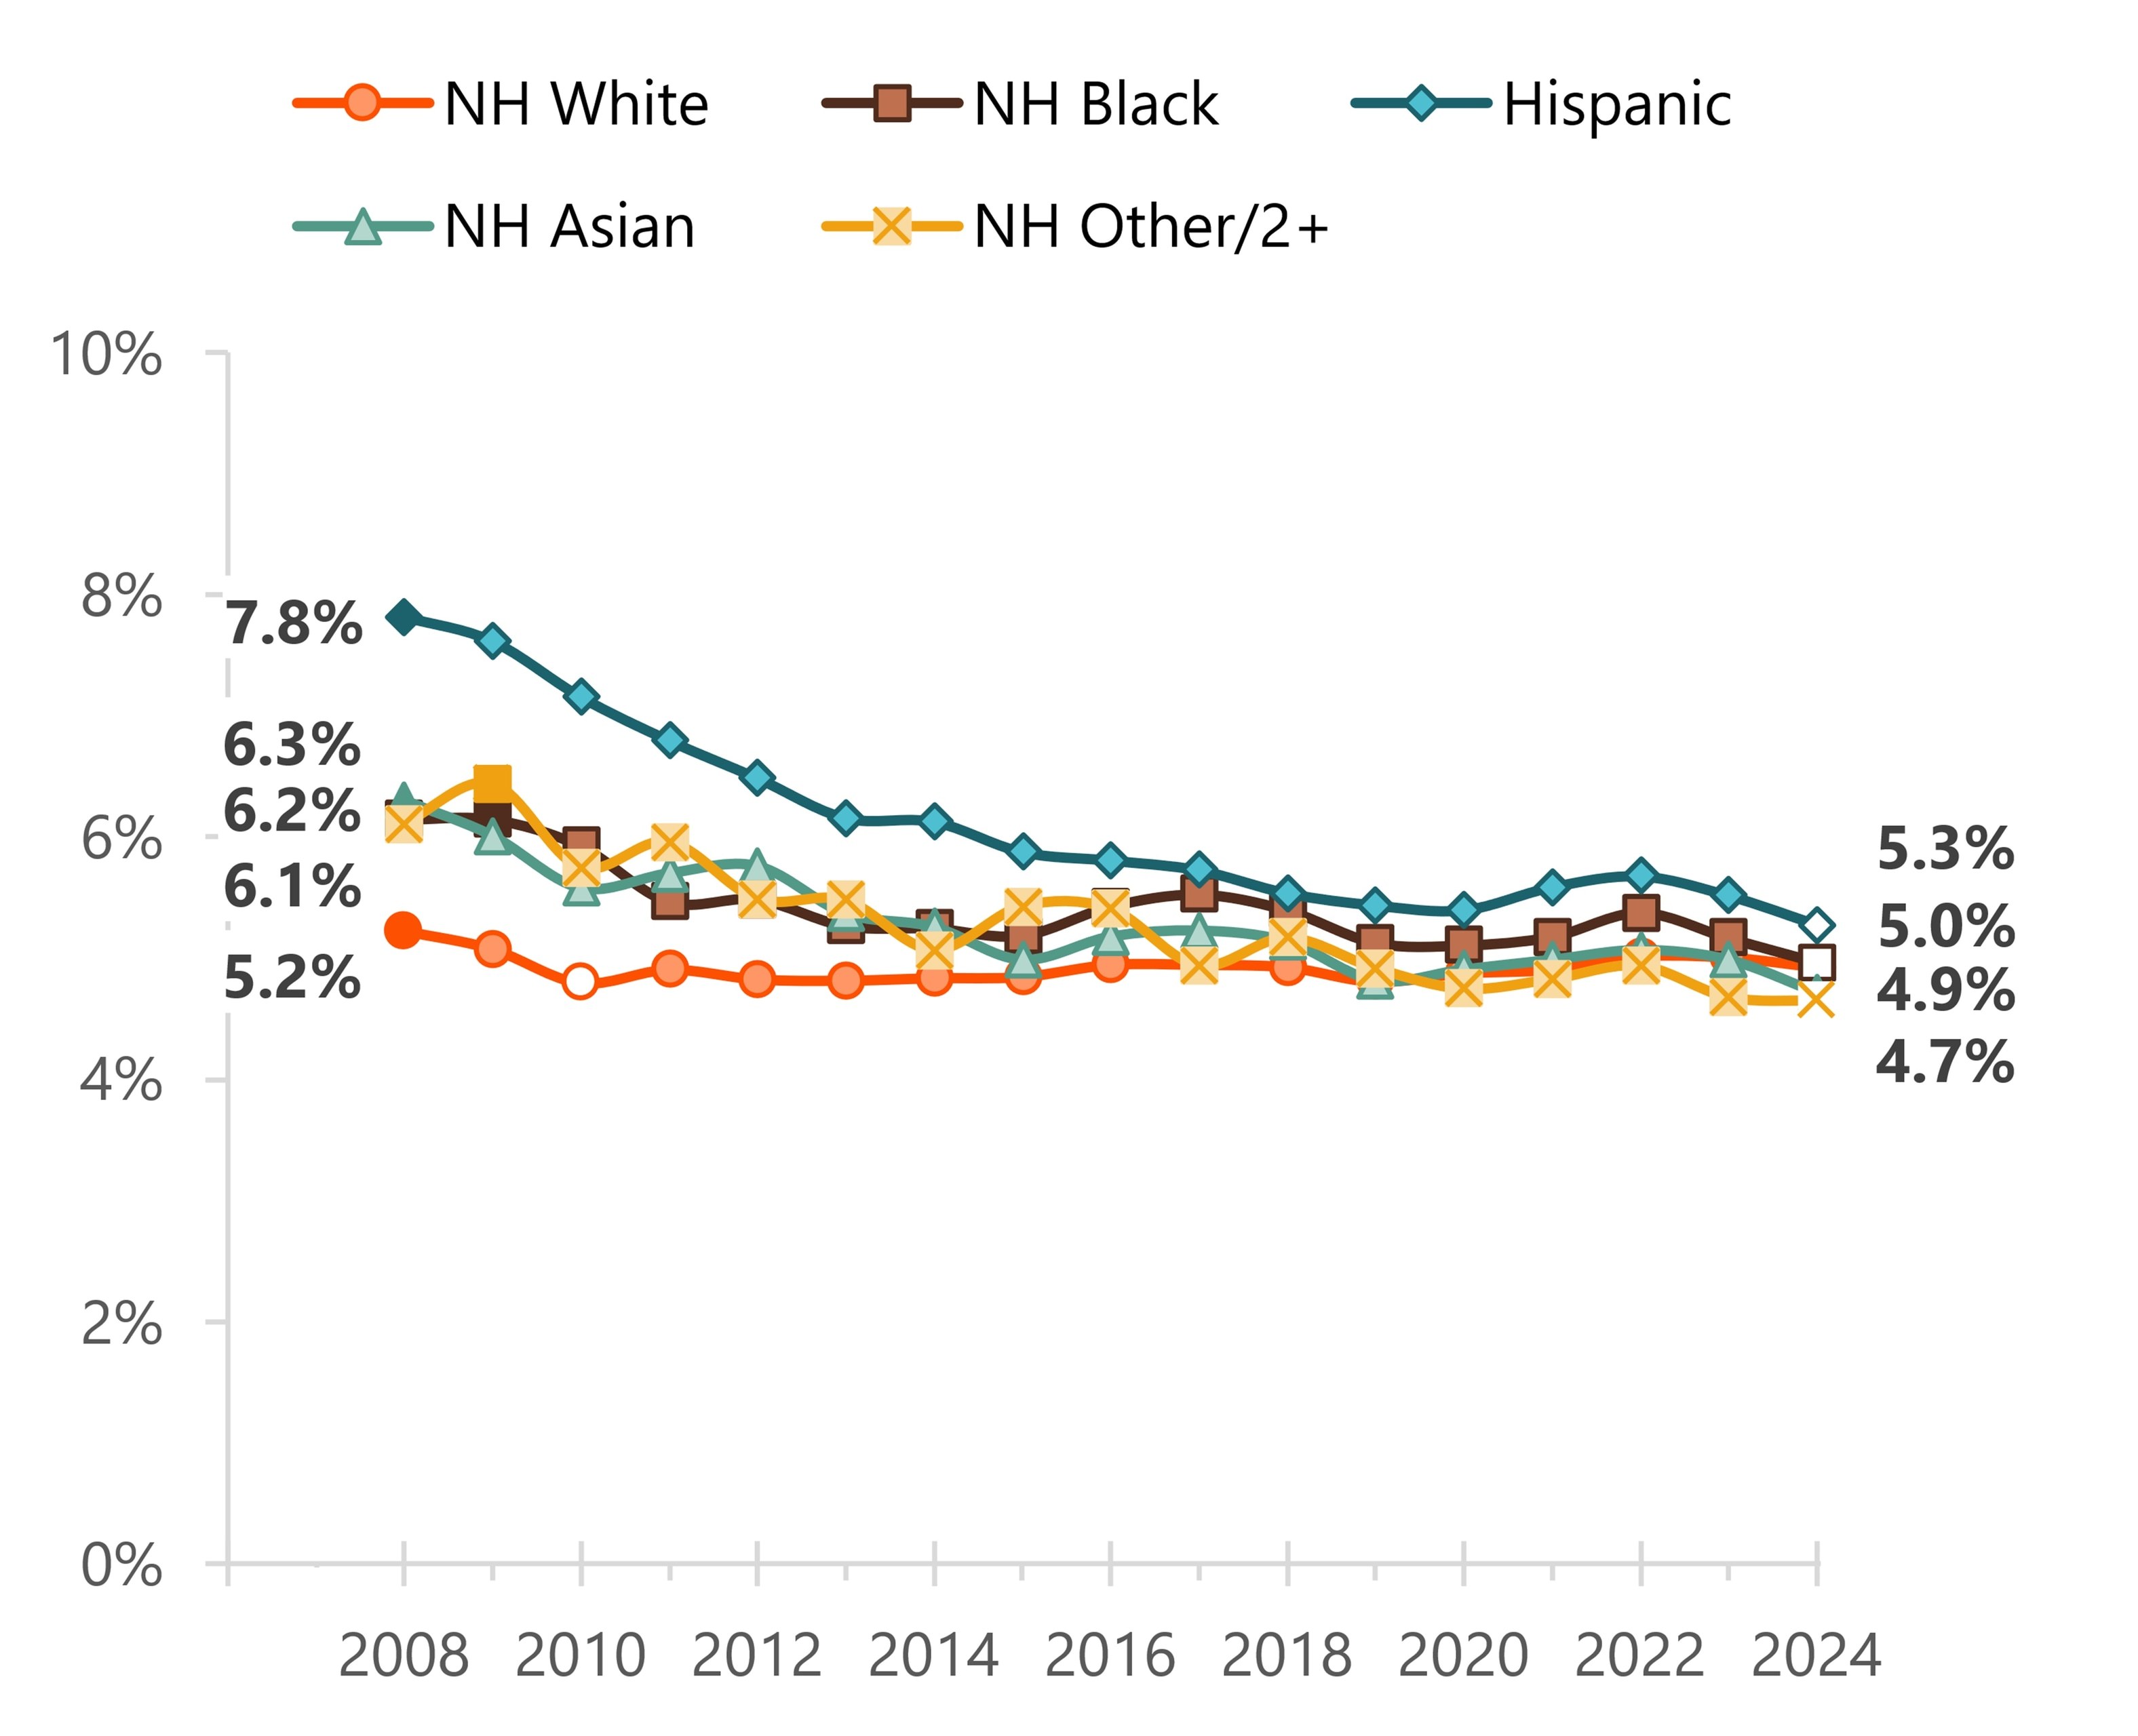
- From 2008 to 2024, the share of females aged 15-50 who gave birth in the past 12 months declined across all racial and ethnic groups, but proportional declines were greatest among Hispanics and least among non-Hispanic Whites. The share of Hispanic females who had a child in the past 12 months declined from 7.8% in 2008 to 5.3% in 2024. In contrast, the share of non-Hispanic White females who had a child in the past 12 months declined from 5.2% in 2008 to 4.9% in 2024.
- The pattern in the share who gave birth in the past 12 months by race and ethnicity is one of convergence. In 2008, the shares ranged from a high of 7.8% among Hispanic females aged 15-50 to a low of 5.2% among non-Hispanic White females. In 2024, the highest share was still observed among Hispanic females at 5.3%, while the lowest share was observed among non-Hispanic Asian and non-Hispanic Other/2+ females at 4.7%.
Figure 4. Share of Females Aged 15-50 Who Gave Birth in the Past 12 Months by Race/Ethnicity, 2008-2024
Source: NCFMR analysis of American Community Survey, 1-Year Estimates, 2008-2024 (IPUMS USA)
Note. Due to data collection issues, fertility data were suppressed for 59 PUMAs in Florida, Georgia, Kansas, Montana, North Carolina, Ohio, and Texas in the 2012 ACS (IPUMS USA, 2026). NH = Non-Hispanic. “NH Asian” includes non-Hispanic individuals identifying as Asian or Native Hawaiian and Other Pacific Islander. “Other/2+ Races” includes non-Hispanic individuals identifying as American Indian or Alaska Native alone, some other race alone, or two or more races.
Age Group
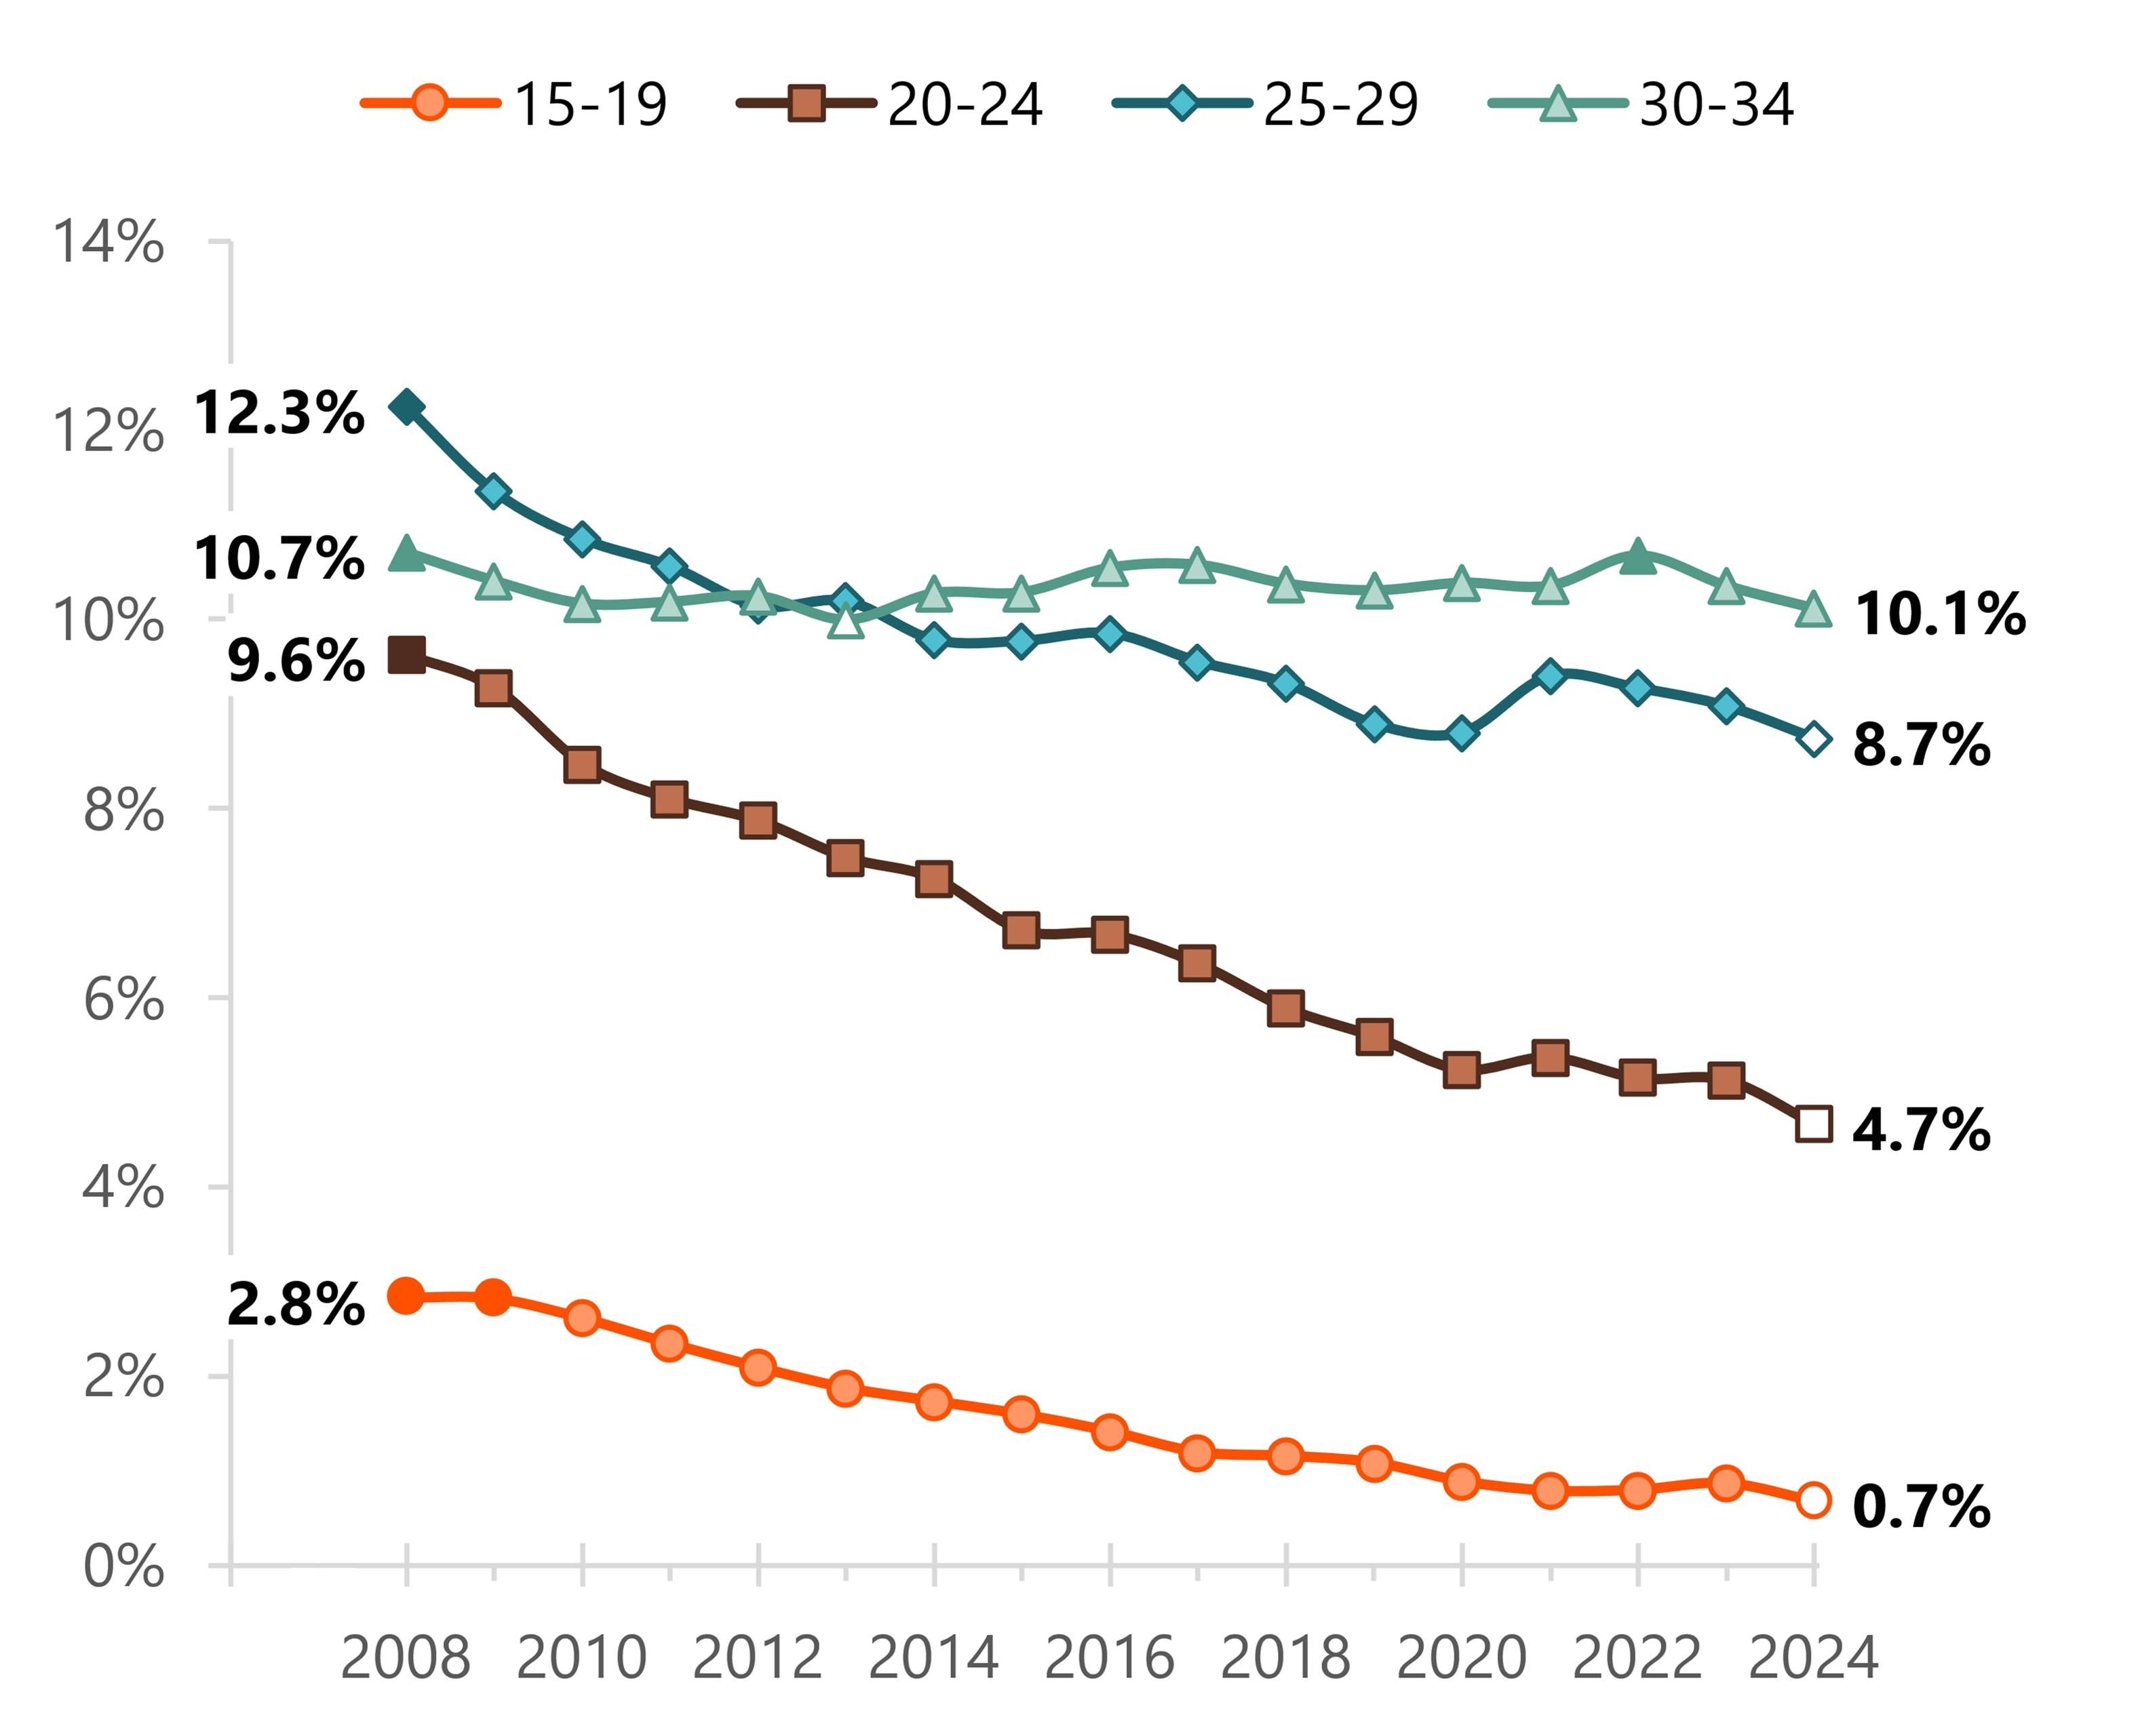
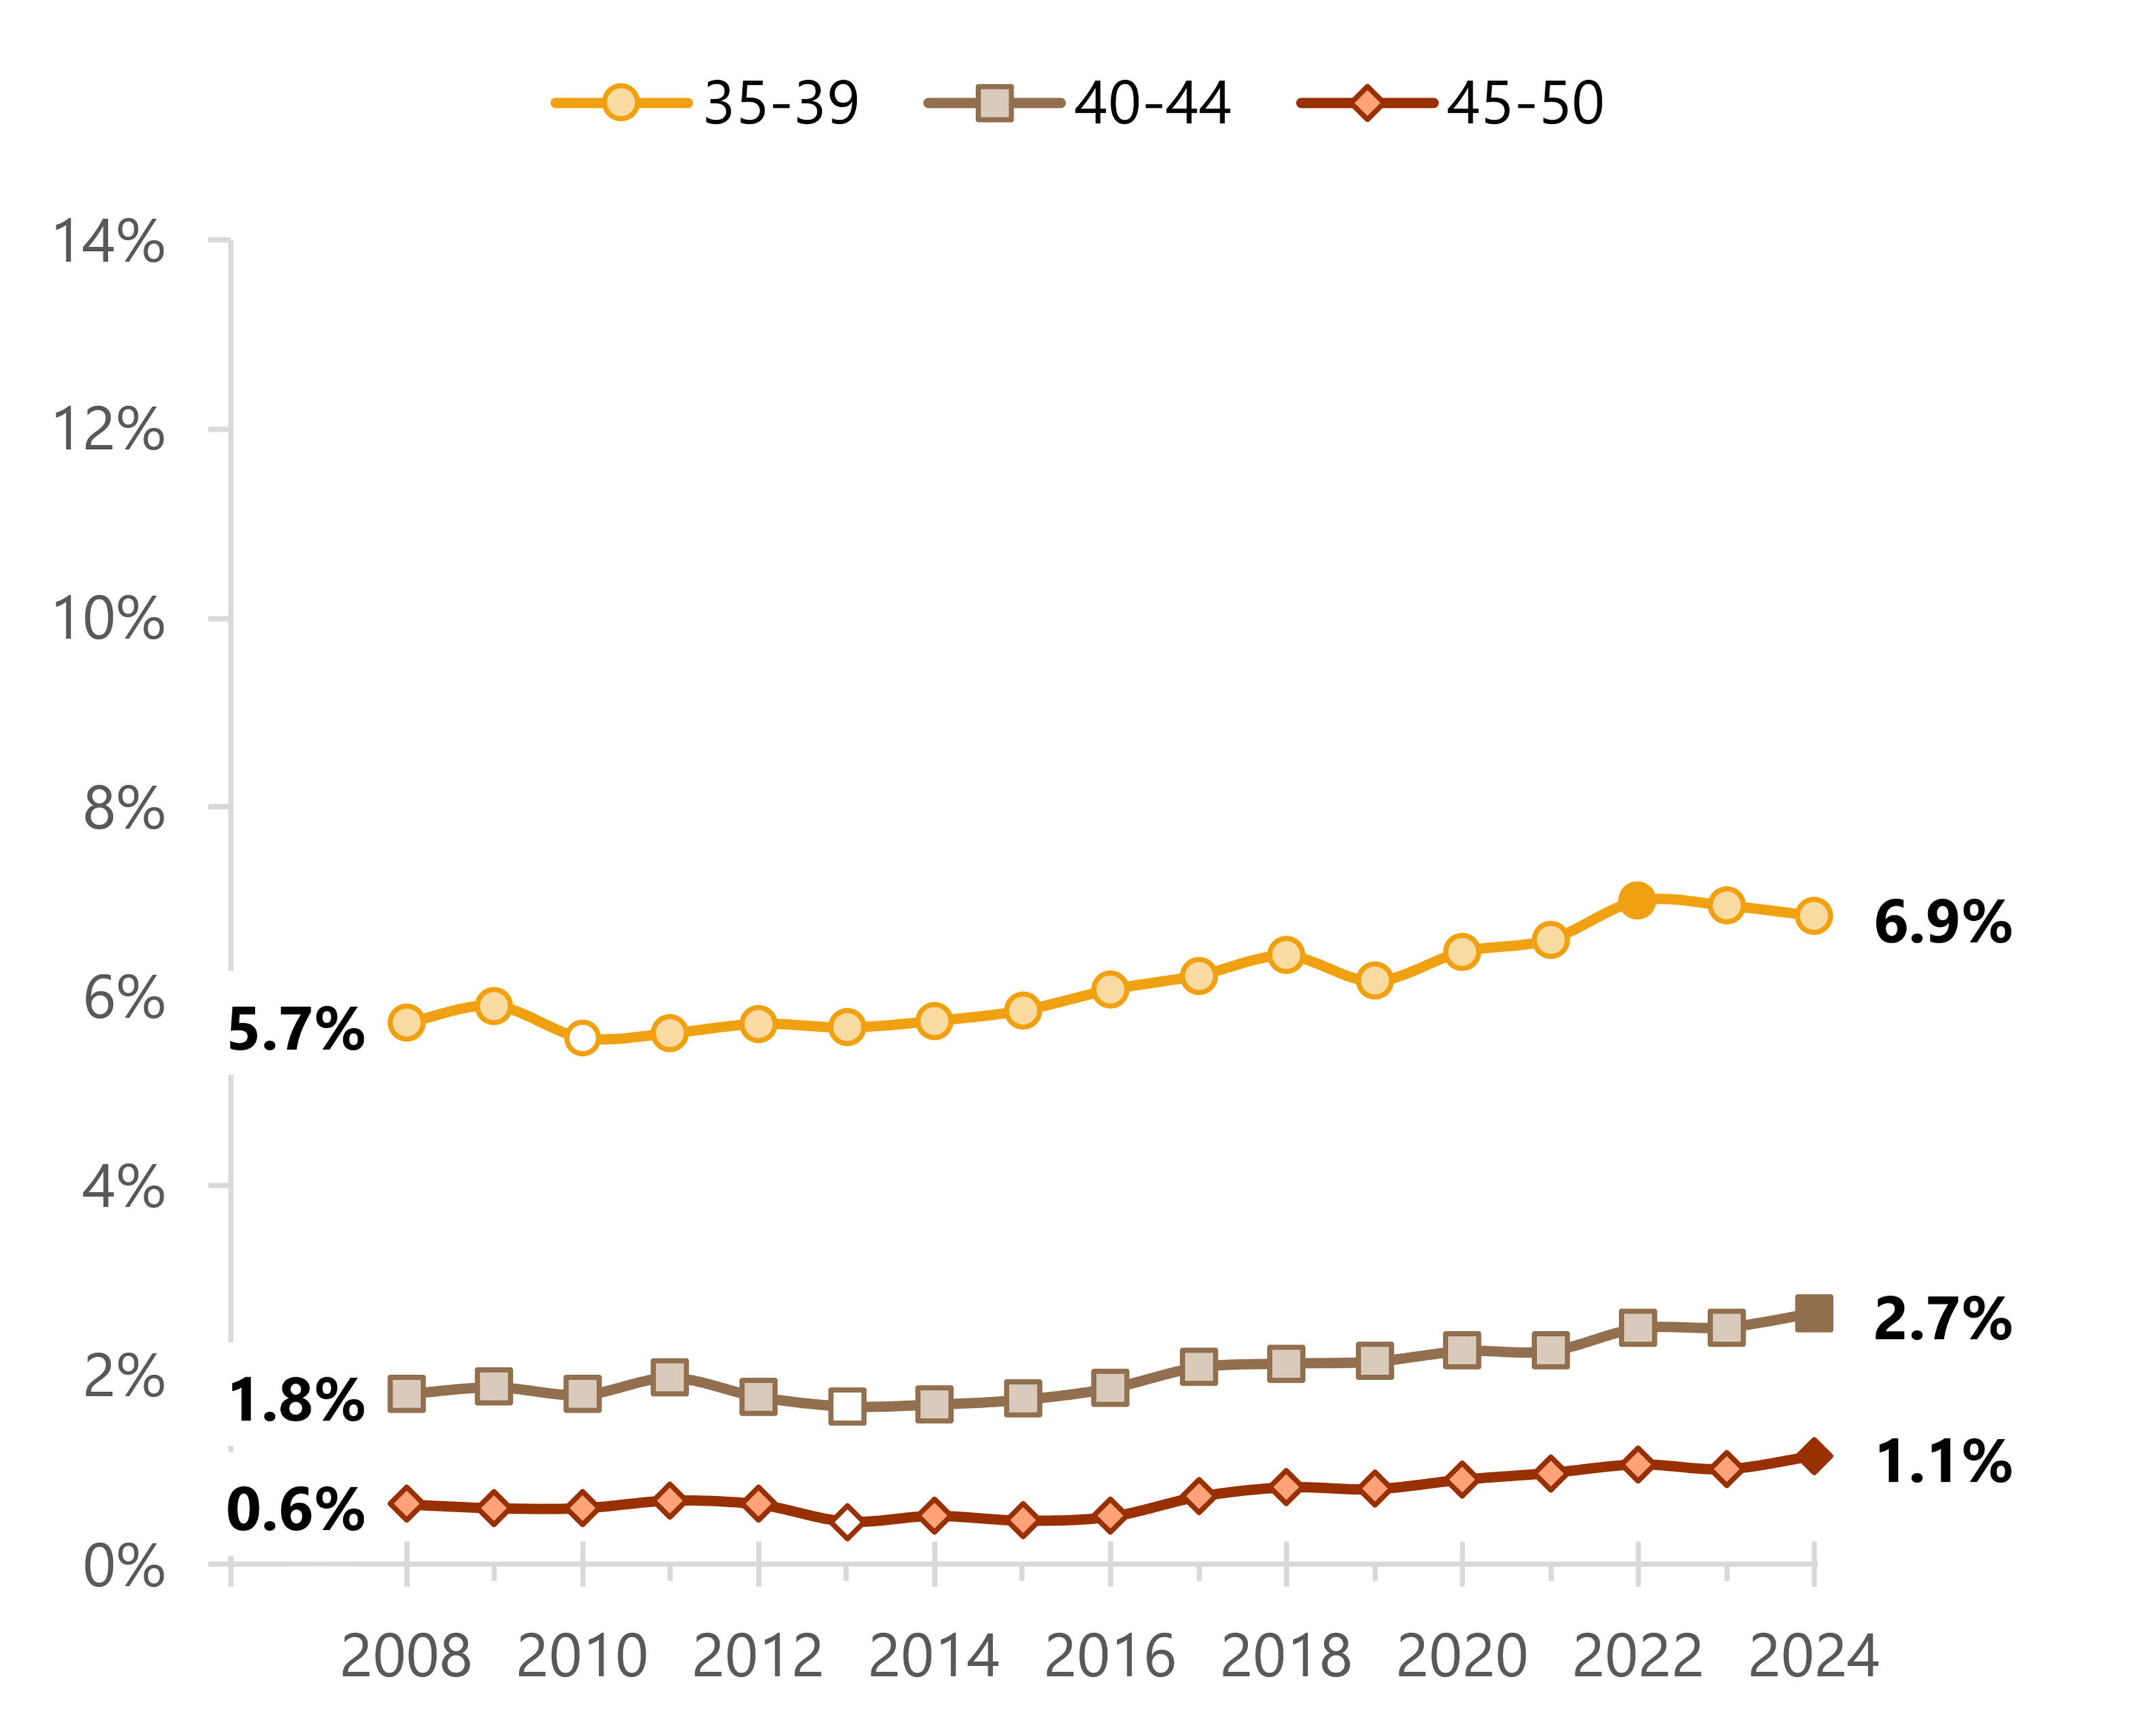
- Changes in the share of females who experienced a birth in the past 12 months varied considerably by age. From 2008 to 2024, proportional declines diminished with age among those aged 15 to 34, with those aged 30-34 experiencing the smallest decline. Conversely, the share increased among each successive age group beginning with those aged 35-39.
- The age group with the highest share having a child in the past 12 months also shifted over this period. In 2008, the highest share was among those aged 25-29 (12.3%), whereas in 2024 it was among those aged 30-34 (10.1%).
- Between 2008 and 2024 the age group with the lowest share having a child in the past 12 months changed from the oldest to the youngest age group. In 2008, the lowest share was among the oldest age group, those aged 45-50 (0.6%); by 2024, it was among the youngest age group, those aged 15-19 (0.7%).
Figure 5. Share of Females Aged 15-50 Who Gave Birth in the Past 12 Month by Age Group, 2008-2024
Source: NCFMR analysis of American Community Survey, 1-Year Estimates, 2008-2024 (IPUMS USA)
Note. Due to data collection issues, fertility data were suppressed for 59 PUMAs in Florida, Georgia, Kansas, Montana, North Carolina, Ohio, and Texas in the 2012 ACS (IPUMS USA, 2026).
This Family Profile is a companion piece to FP-26-16

Data Source:
Ruggles, S., Flood, S., Sobek, M., Backman, D., Chen, A., Cooper, G., Richards, S., Rodgers, R., & Schouweiler, M. (2023). IPUMS USA: Version 14.0 (14.0) American Community Survey. Minneapolis, MN: IPUMS. https://doi.org/10.18128/D010.V14.0
References:
Morrison, O. P., & Westrick-Payne, K. K. (2026). Women who gave birth within the past 12 months, 2024. Family Profiles, FP-26-16. Bowling Green, OH: National Center for Family & Marriage Research. https://doi.org/10.25035/ncfmr/fp-26-16
Suggested Citation:
Westrick-Payne, K. K. (2026). Trends in the share of women who gave birth within the past 12 months, 2008-2024. Family Profiles, FP-26-17. Bowling Green, OH: National Center for Family & Marriage Research. https://doi.org/10.25035/ncfmr/fp-26-17
Updated: 10/02/2026 02:20PM