
Mean Age of Mother at First Birth, 2024
Family Profile No. 12, 2026
Author: Molly N. Craig
In the U.S. most young women report wanting to become a parent and desiring on average two children (Guzzo & Hayford, 2023). At the same time, the timing of fertility has shifted such that birth rates have decreased among younger women and risen among those aged 35 and older (Hamilton et al., 2025; Osterman et al., 2024). In this profile, we focus on the timing of entry into motherhood by examining the mean age of mothers at the time of their first birth. Data on women’s age at first birth are drawn from the National Center for Health Statistics National Vital Statistical System’s natality file (2016-2024). We present the trend in mean age of entry into motherhood as well as the mean age of motherhood in 2024 based on race/ethnicity, educational attainment, and state of residence. This is an update of a previous profile, FP-25-29 (Westrick-Payne & Manning, 2025) To see how this trend relates to age at first marriage, check out FP 25-13 (Westrick-Payne, Brown, & Manning, 2025).
Trend in the Mean Age of Mother at First Birth
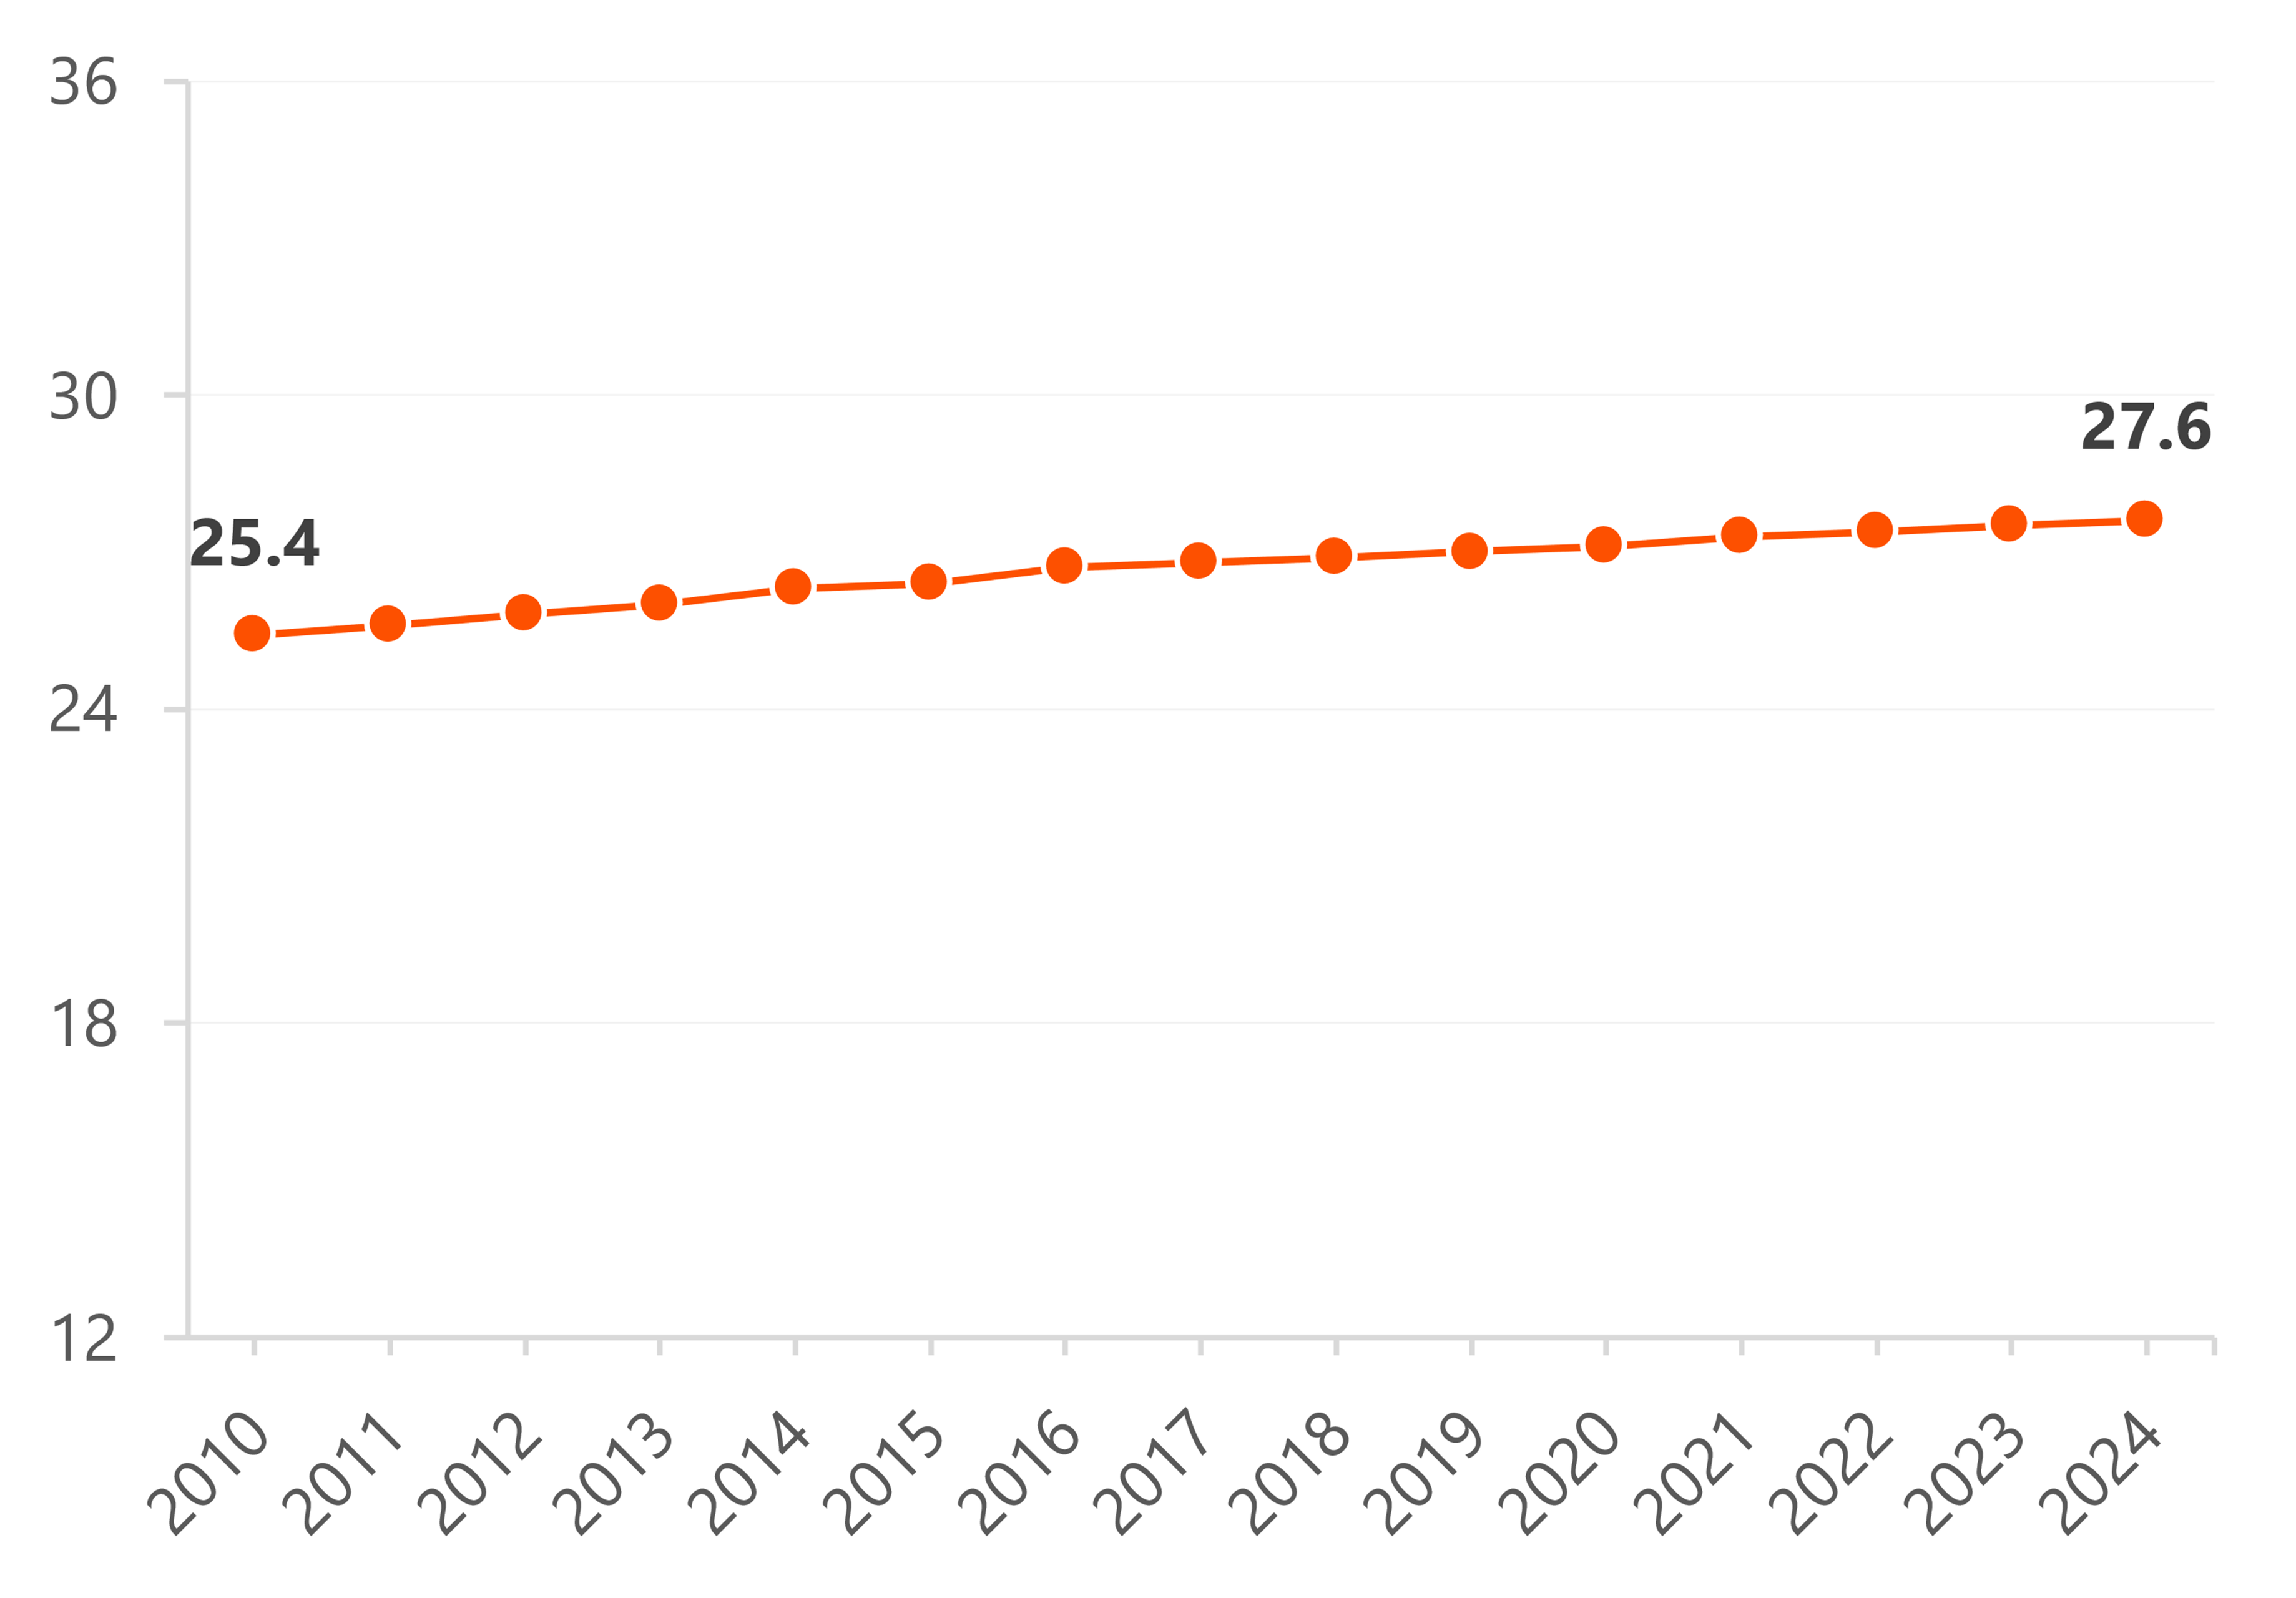
- The mean age of mothers at the time of their first birth has increased by about 2 years since 2010.
- In 2010, the mean age was 25.4 years while it was 27.6 years in 2024.
- Although not shown, the current mean age at first birth is at its highest since 1970 when it was at 21.4 years (Matthews et al., 2002).
Figure 1. Mothers’ Mean Age at First Birth, 2010-2024
Source: NCFMR analyses of National Center for Health Statistics, National Vital Statistics System, natality date file, 2010-2024
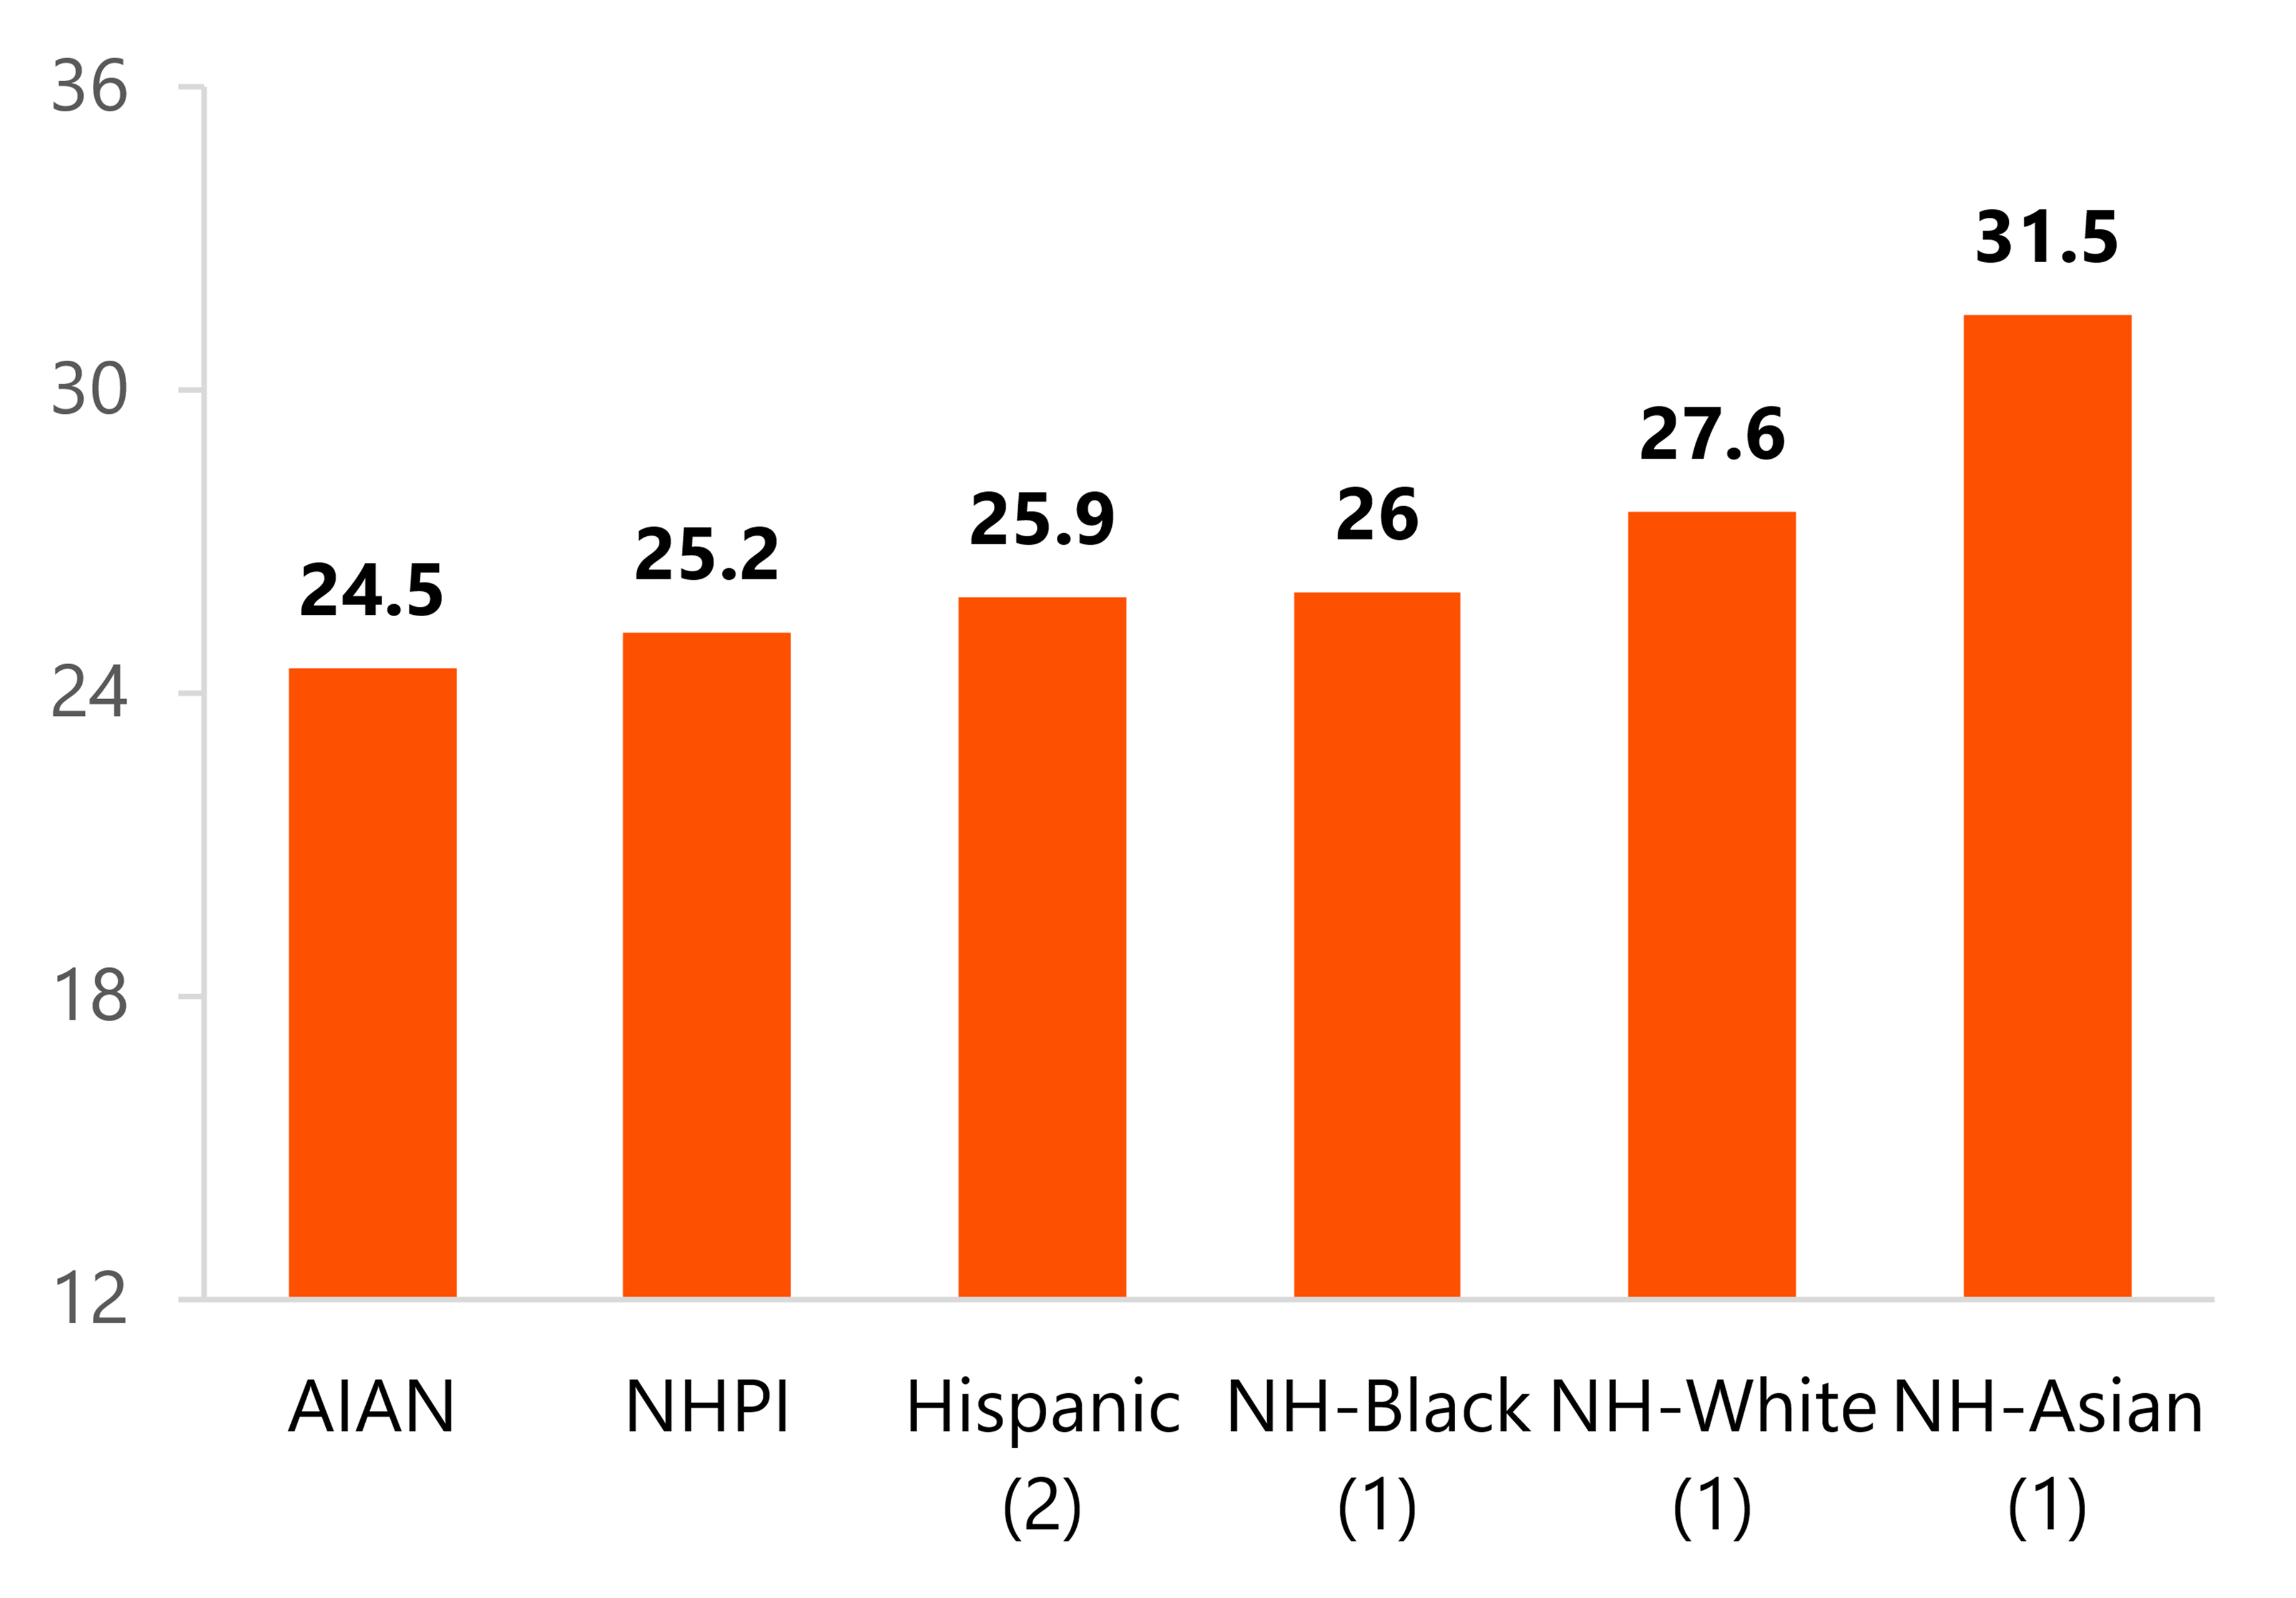
Figure 2. Mean Age at First Birth by Race and Ethnicity of the Mother, 2024
Source: NCFMR analyses of National Center for Health Statistics, National Vital Statistics System, natality date file, 2024
Note. (1) NH = Non-Hispanic. Race groups are single race. Race and Hispanic origin are reported separately on birth certificates. In this figure, non-Hispanic females are classified by race. (2) Includes all people of Hispanic origin of any race. AIAN = American Indian and Alaska Native. NHPI = Native Hawaiian and Pacific Islander
- The mean age at first birth among mothers in 2024 varied by race and ethnicity.
- The youngest age at first birth was among mothers who identified as American Indian and Alaska Native at 24.5 years.
- The oldest age at first birth was among mothers who identified as non-Hispanic Asian at 31.5 years.
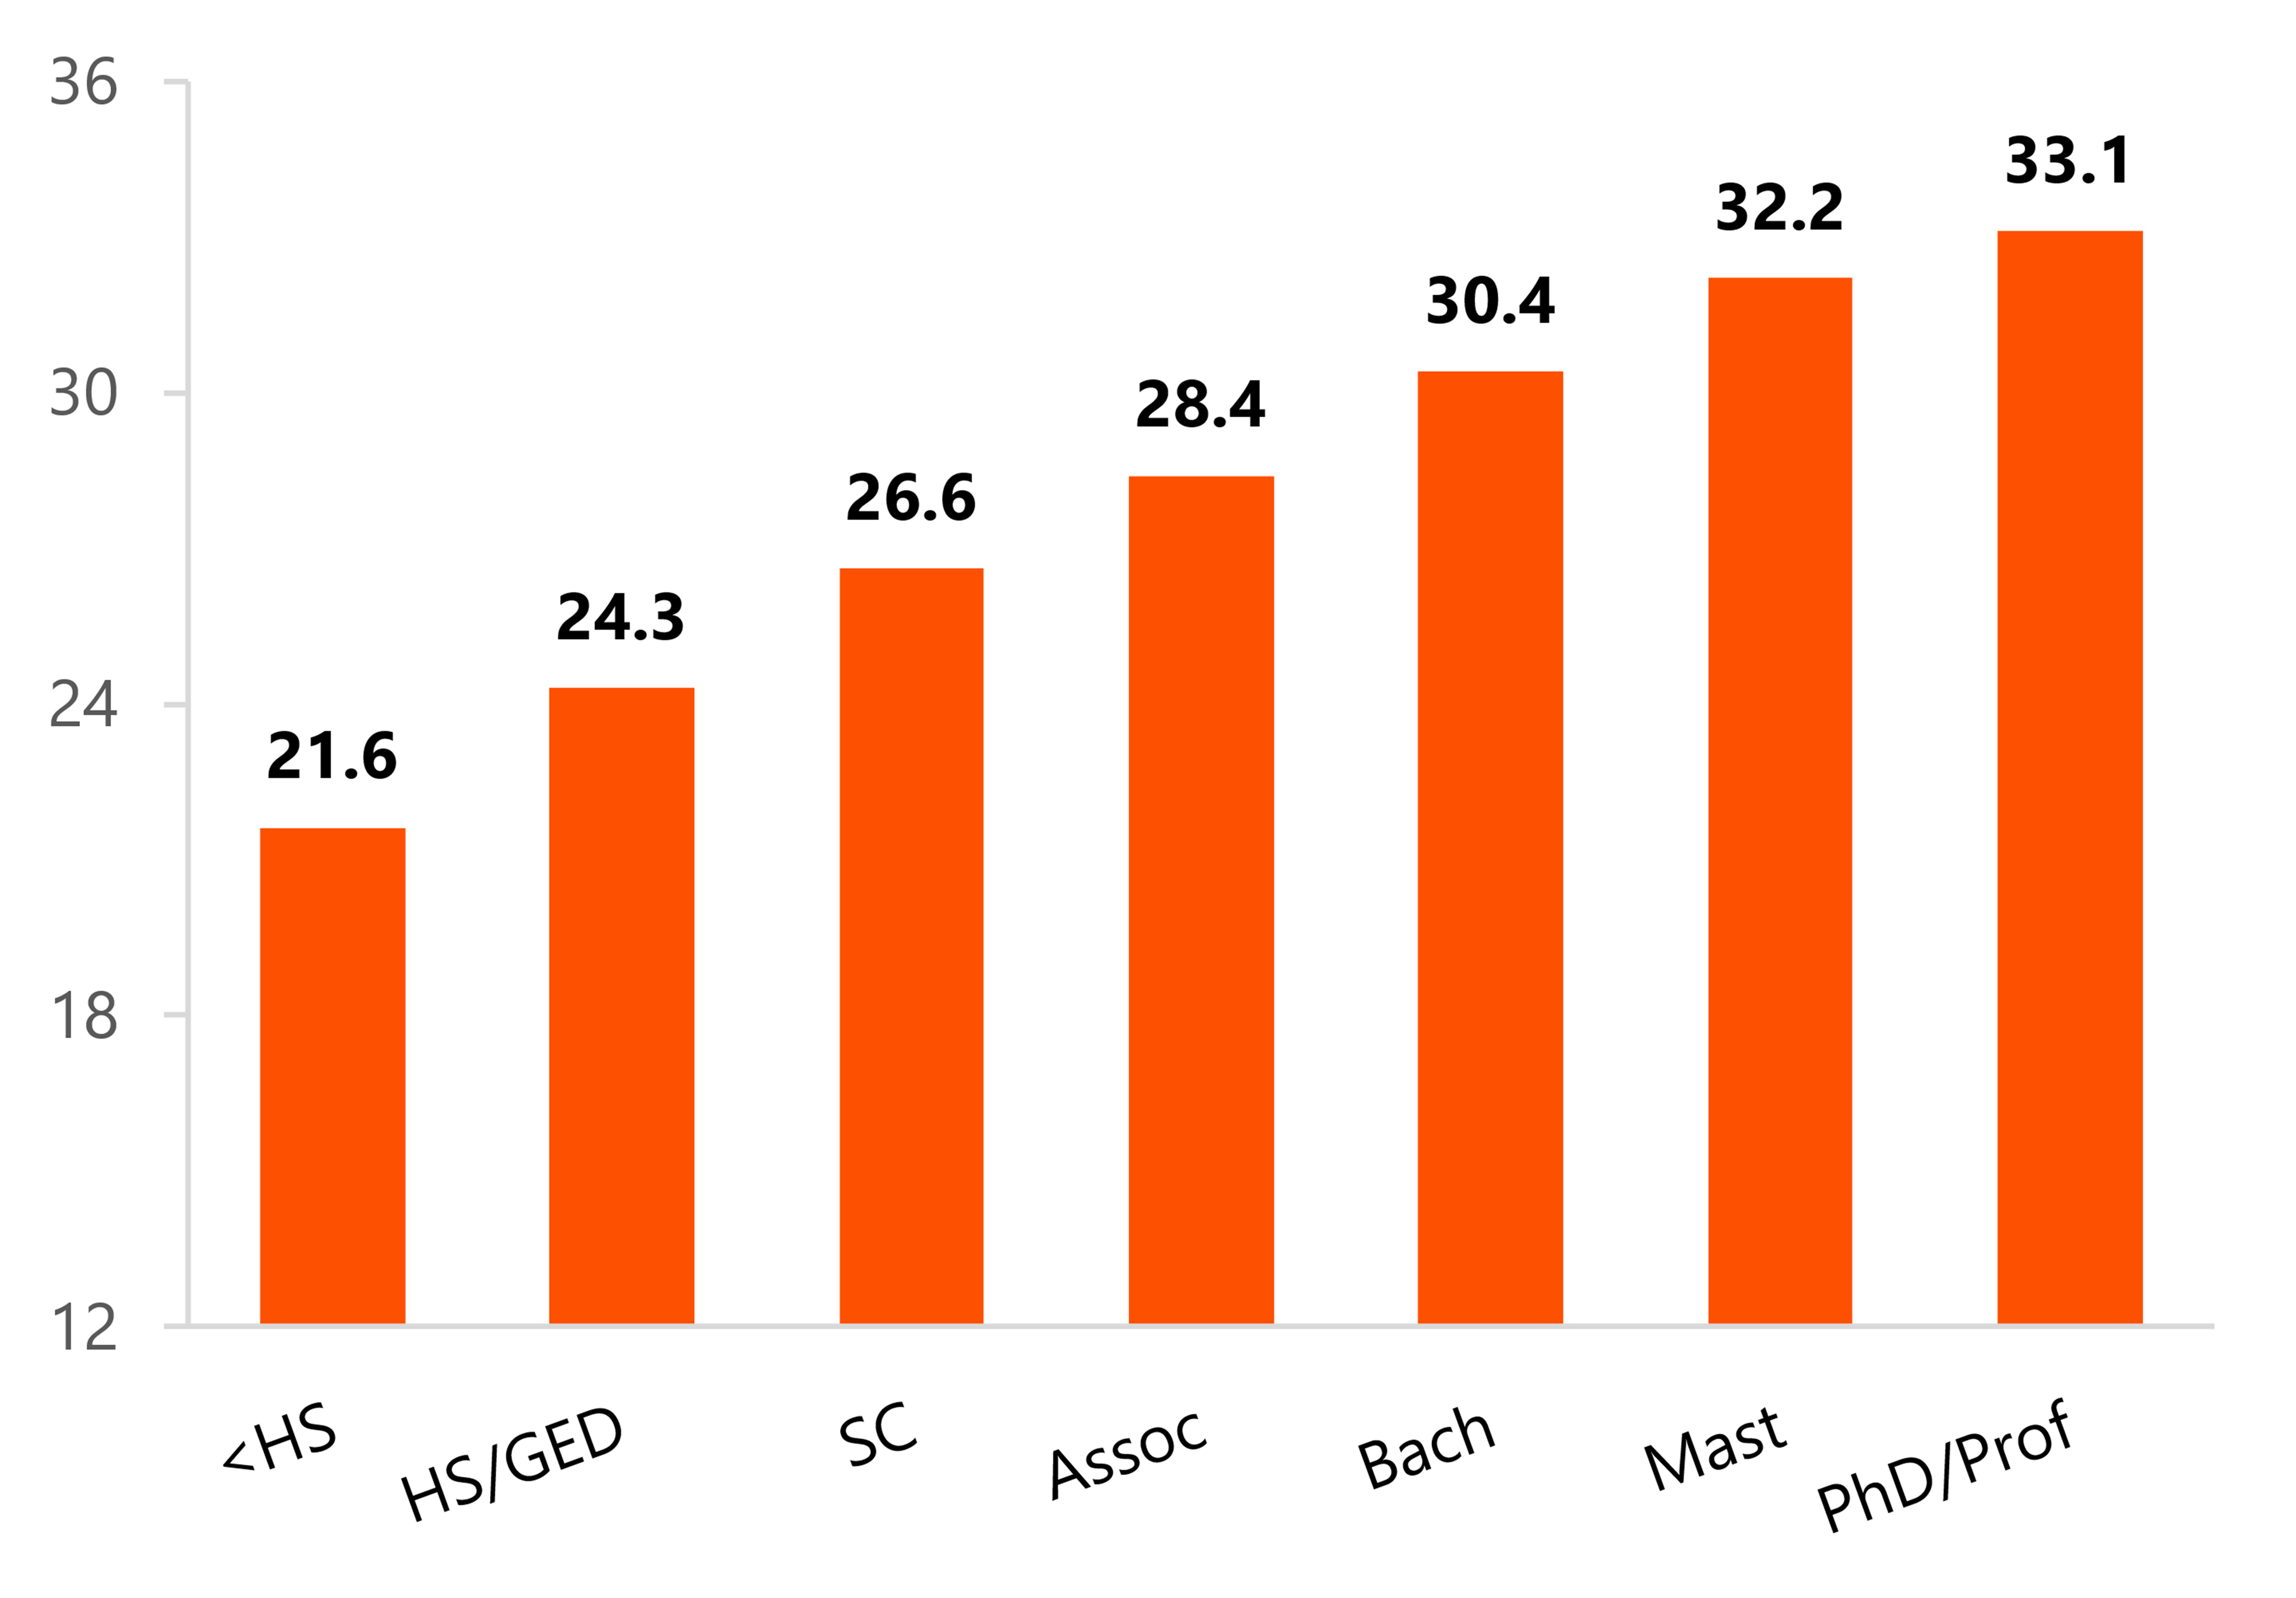
- In 2024, as mother’s educational attainment increased, the average age at first birth also increased.
- The youngest average age was among mothers who had less than a high school diploma/GED with a mean age at first birth of 21.6 years. This is more than six years younger than the average among all first-time mothers (27.6).
- About half of females (47%) ages 25-34 have a bachelor’s degree (Hurst, 2024) and the average age at first birth for mothers with a bachelor’s degree in 2024 was 30.4.
- The oldest average age was among mothers who had earned a doctoral or professional degree. Their mean age was 33.1 years, more than five years older than the average among all first-time mothers.
Figure 3. Mean Age at First Birth by Educational Attainment of the Mother, 2024
Source: NCFMR analyses of National Center for Health Statistics, National Vital Statistics System, natality date file, 2024
Note. HS = high school; GED = general education diploma; SC = some college; Assoc = associate degree; Bach = bachelor’s degree; Mast = master’s degree; PhD = doctoral degree; Prof = professional degree.
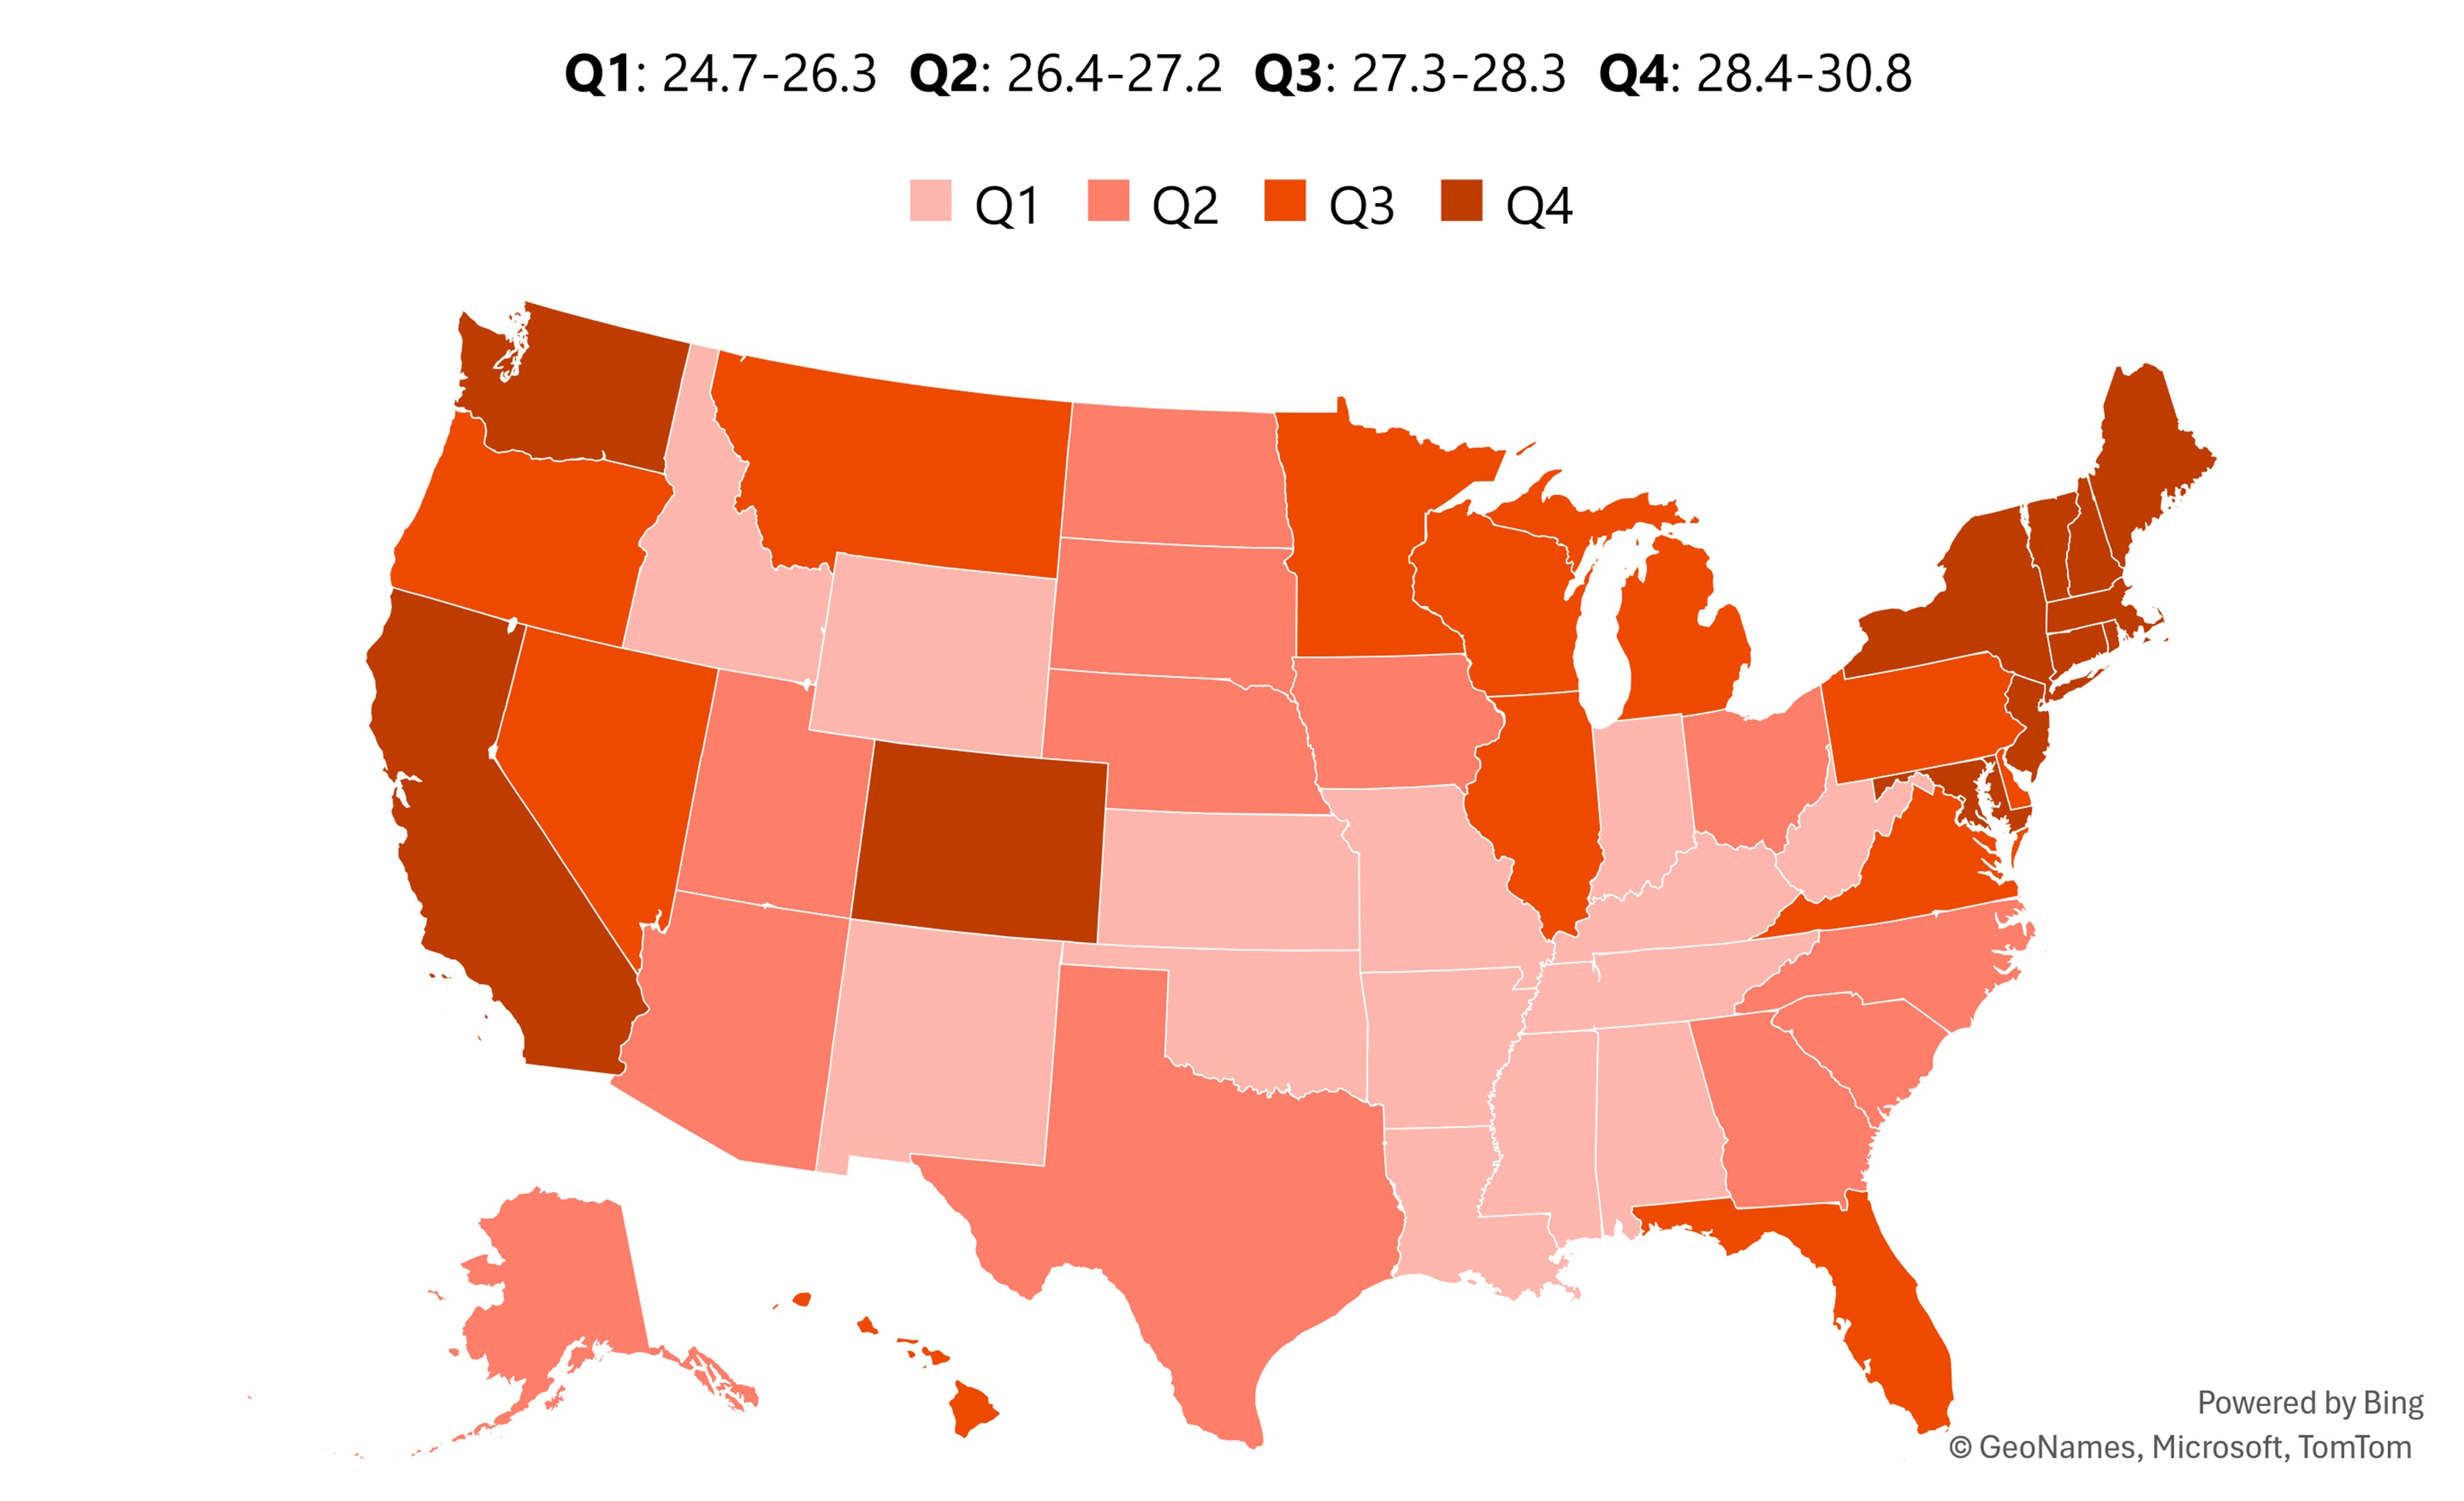
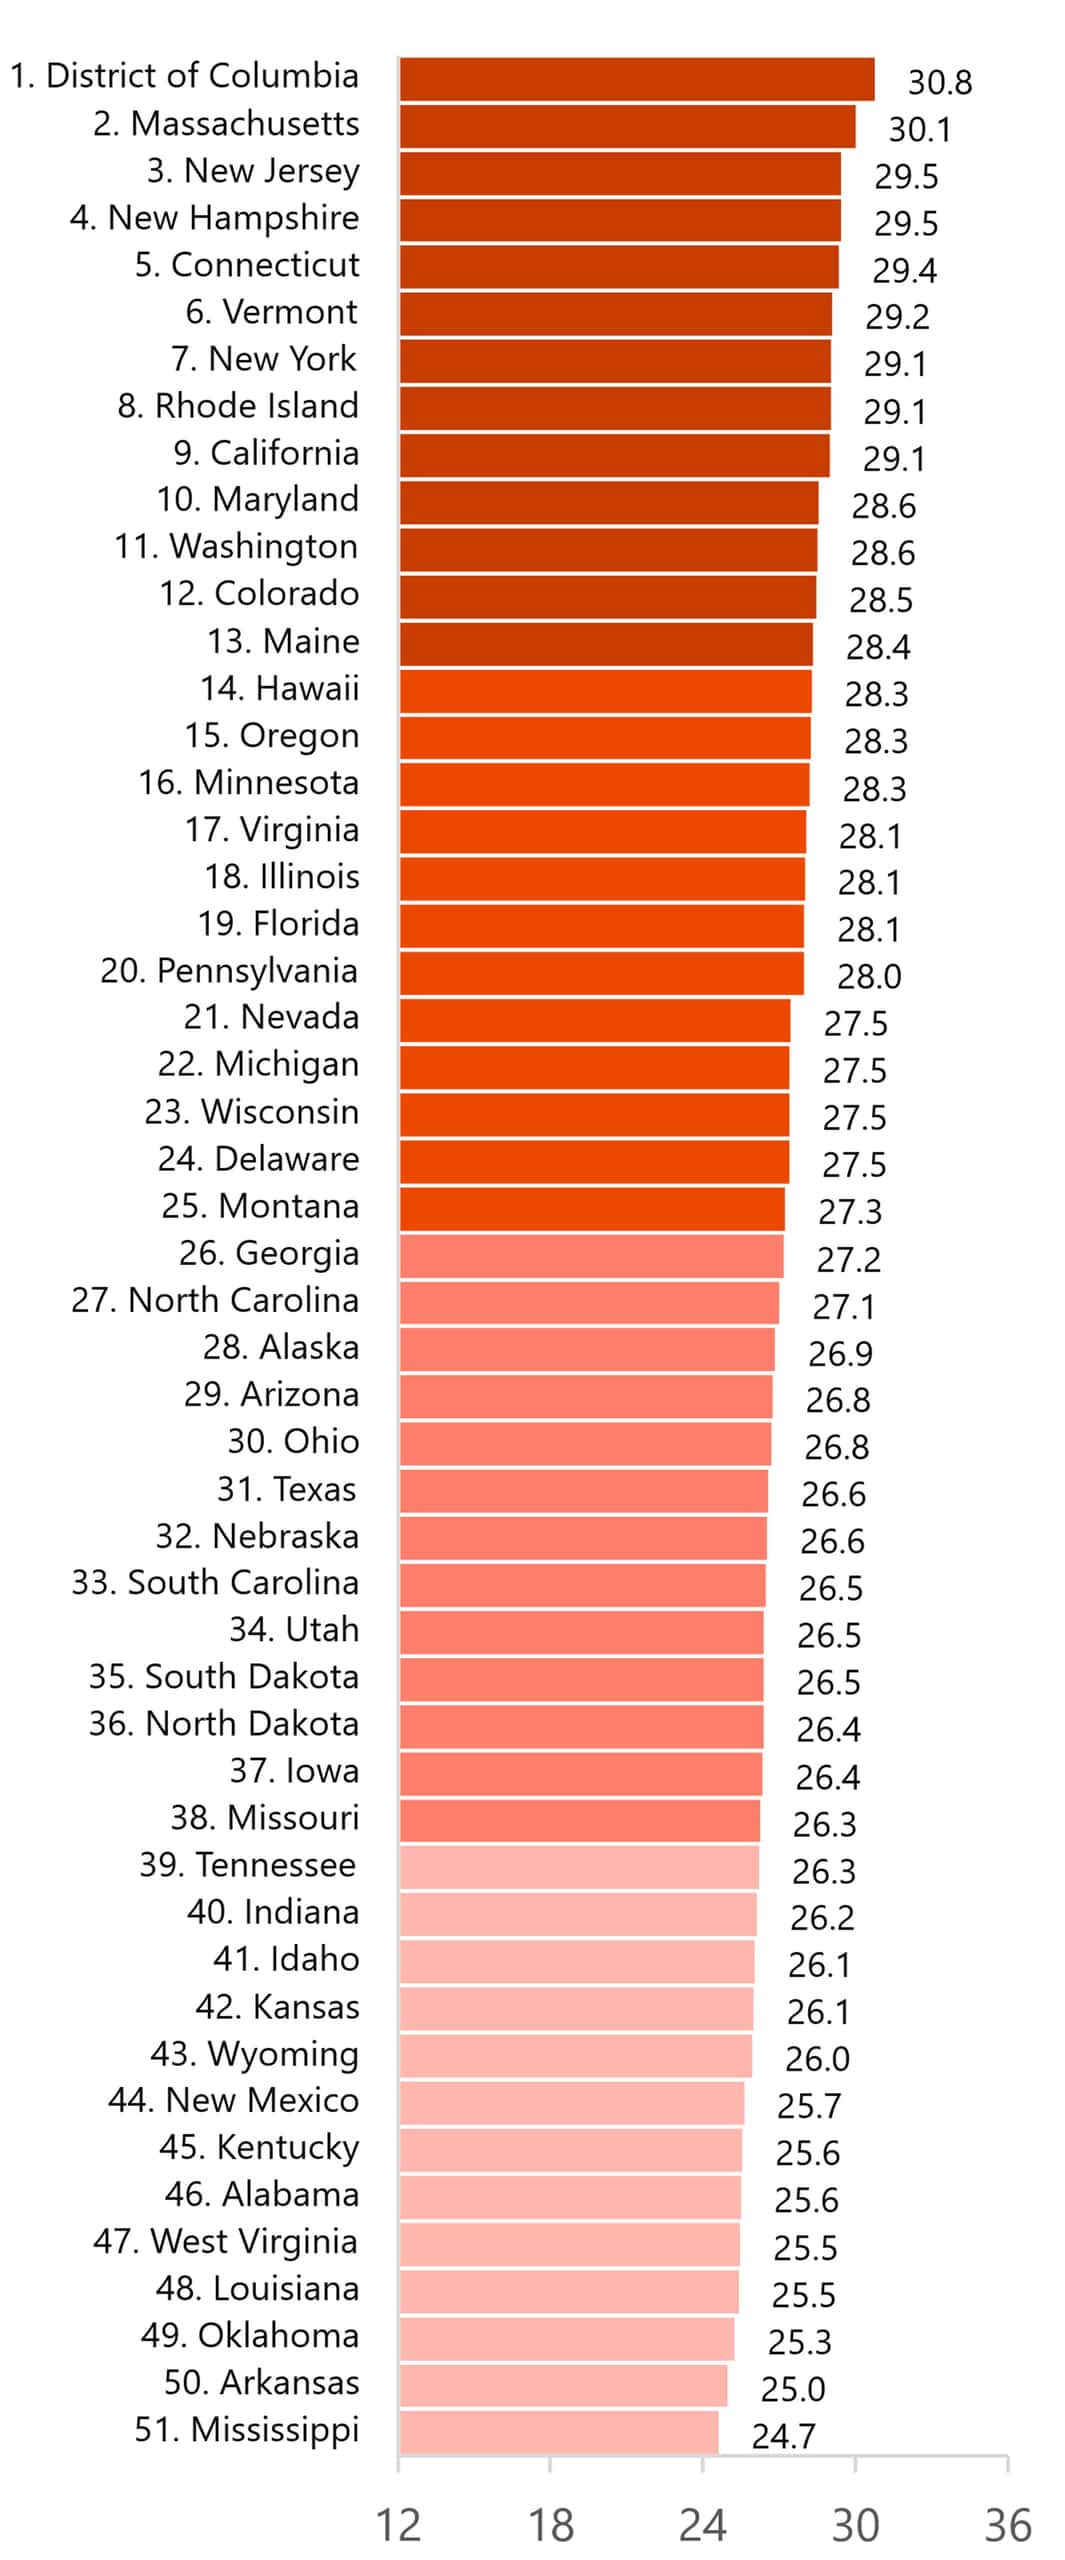
- State-level average age of mothers at the time of their first birth ranged from a low of 24.7 in Mississippi to a high of 30.8 in Washington, DC.
- The bottom quartile (Q1) represents states with a mean age of first-time mothers ranging from 24.7 to 26.3. Southern states made up the largest share of these states.
- The second quartile (Q2) had states with mean ages of first-time mothers ranging from 26.4 to 27.2. States in the Midwest and South made up the largest share of these states.
- States in the third quartile (Q3) had mean ages of first-time mothers ranging from 27.3 to 28.3. The Midwest and West had the largest representation in this quartile.
- The highest quartile (Q4) represents the states with the oldest mean ages of first-time mothers. They ranged from 28.4 to 30.8. Overwhelmingly, Northeastern states made up the largest share of these states.
Figure 4. Geographic Variation in the Mothers’ Mean Age at First Birth, 2024
Source: NCFMR analyses of National Center for Health Statistics, National Vital Statistics System, natality date file, 2024
Figure 5. State Rankings of the Mean Age at First Birth, 2024
Source: NCFMR analyses of National Center for Health Statistics, National Vital Statistics System, natality date file, 2024
This Family Profile is an update of: FP-25-29.


Data Source:
Centers for Disease Control and Prevention, National Center for Health Statistics. (2024). National Vital Statistics System, Natality on CDC WONDER Online Database [Data set]. Data from Natality Records 2016–2024, as compiled from data provided by the 57 vital statistics jurisdictions through the Vital Statistics Cooperative Program. http://wonder.cdc.gov/natality-expanded-current.html
References:
Guzzo, K. B., & Hayford, S. R. (2023). Evolving fertility goals and behaviors in current U.S. childbearing cohorts. Population and Development Review, 49(1), 7–42. https://doi.org/10.1111/padr.12535
Hamilton, B. E., Martin, J. A., & Osterman, M. J. K. (2025, April). Births: Provisional data for 2024. Vital Statistics Rapid Release, No. 38, pp. 1–10. National Center for Health Statistics. https://dx.doi.org/10.15620/cdc/174587
Hurst, K. (2024). U.S. women are outpacing men in college completion, including in every major racial and ethnic group. Pew Research Center. https://pewrsr.ch/4fxwAE7
Osterman, M. J. K., Hamilton, B. E., Martin, J. A., Driscoll, A. K., & Valenzuela, C. P. (2025, March 18). Births: Final data for 2023. National Vital Statistics Reports, No. 39. National Center for Health Statistics (U.S.). https://stacks.cdc.gov/view/cdc/175204
Mathews, T. J., & Hamilton, B. E. (2002). Mean age of mother, 1970–2000. National Vital Statistics Reports, Vol. 51, No. 1. National Center for Health Statistics. https://www.cdc.gov/nchs/data/nvsr/nvsr51/nvsr51_01.pdf
Westrick-Payne, K. K., Brown, S. L., & Manning, W. D. (2025). Crossover in the median age at first marriage and first birth: Forty-three years of change. Family Profiles, FP-25-13. Bowling Green, OH: National Center for Family & Marriage Research. https://doi.org/10.25035/ncfmr/fp-25-13
Westrick-Payne, K. K., & Manning, W. D. (2025). Mean age of mother at first birth, 2023. Family Profiles, FP-25-29. National Center for Family & Marriage Research. https://doi.org/10.25035/ncfmr/fp-25-29
Suggested Citation:
Craig, M. N. (2026). Mean age of mother at first birth, 2024. Family Profiles, FP-26-12. Bowling Green, OH: National Center for Family & Marriage Research. https://doi.org/10.25035/ncfmr/fp-26-12
Updated: 07/28/2026 05:48PM