
Number of Children Ever Born to Females Aged 40-44, 1980-2024
Family Profile No. 18, 2026
Author: Krista K. Westrick-Payne
Measures of recent childbearing provide important information about current fertility patterns but do not necessarily reflect the number of children females ultimately have. Changes in the timing of births can affect period fertility measures even when completed family size changes relatively little. Examining the number of children ever born to females nearing the end of their reproductive years provides a longer-term perspective on changes in fertility and family size. In this profile, we use data from the Current Population Survey’s (CPS) biennial June Fertility Supplement for the years 1980, 1990, 2000, 2010, and 2024 to analyze completed fertility at the end of females’ reproductive years. We excluded 2020 because of the pandemic and instead focused on the most recent data period. We present trends in the distribution of children ever born (one, two, three, or four or more) for females aged 40-44 for the overall population and by race and Hispanic ethnicity and educational attainment. This is an update of previous Family Profiles FP-23-29 (Guzzo & Loo, 2023) and FP-20-04 (Guzzo & Schweizer, 2020).
Overall Trends in the Distribution of Children Ever Born
The longer-term trend in the U.S. has been toward smaller families. In 1980, the mean number of children ever born was 3.0. By 1990, it had fallen to 2.1 and, since 2000, has hovered around 1.9 (Hays, 2026).
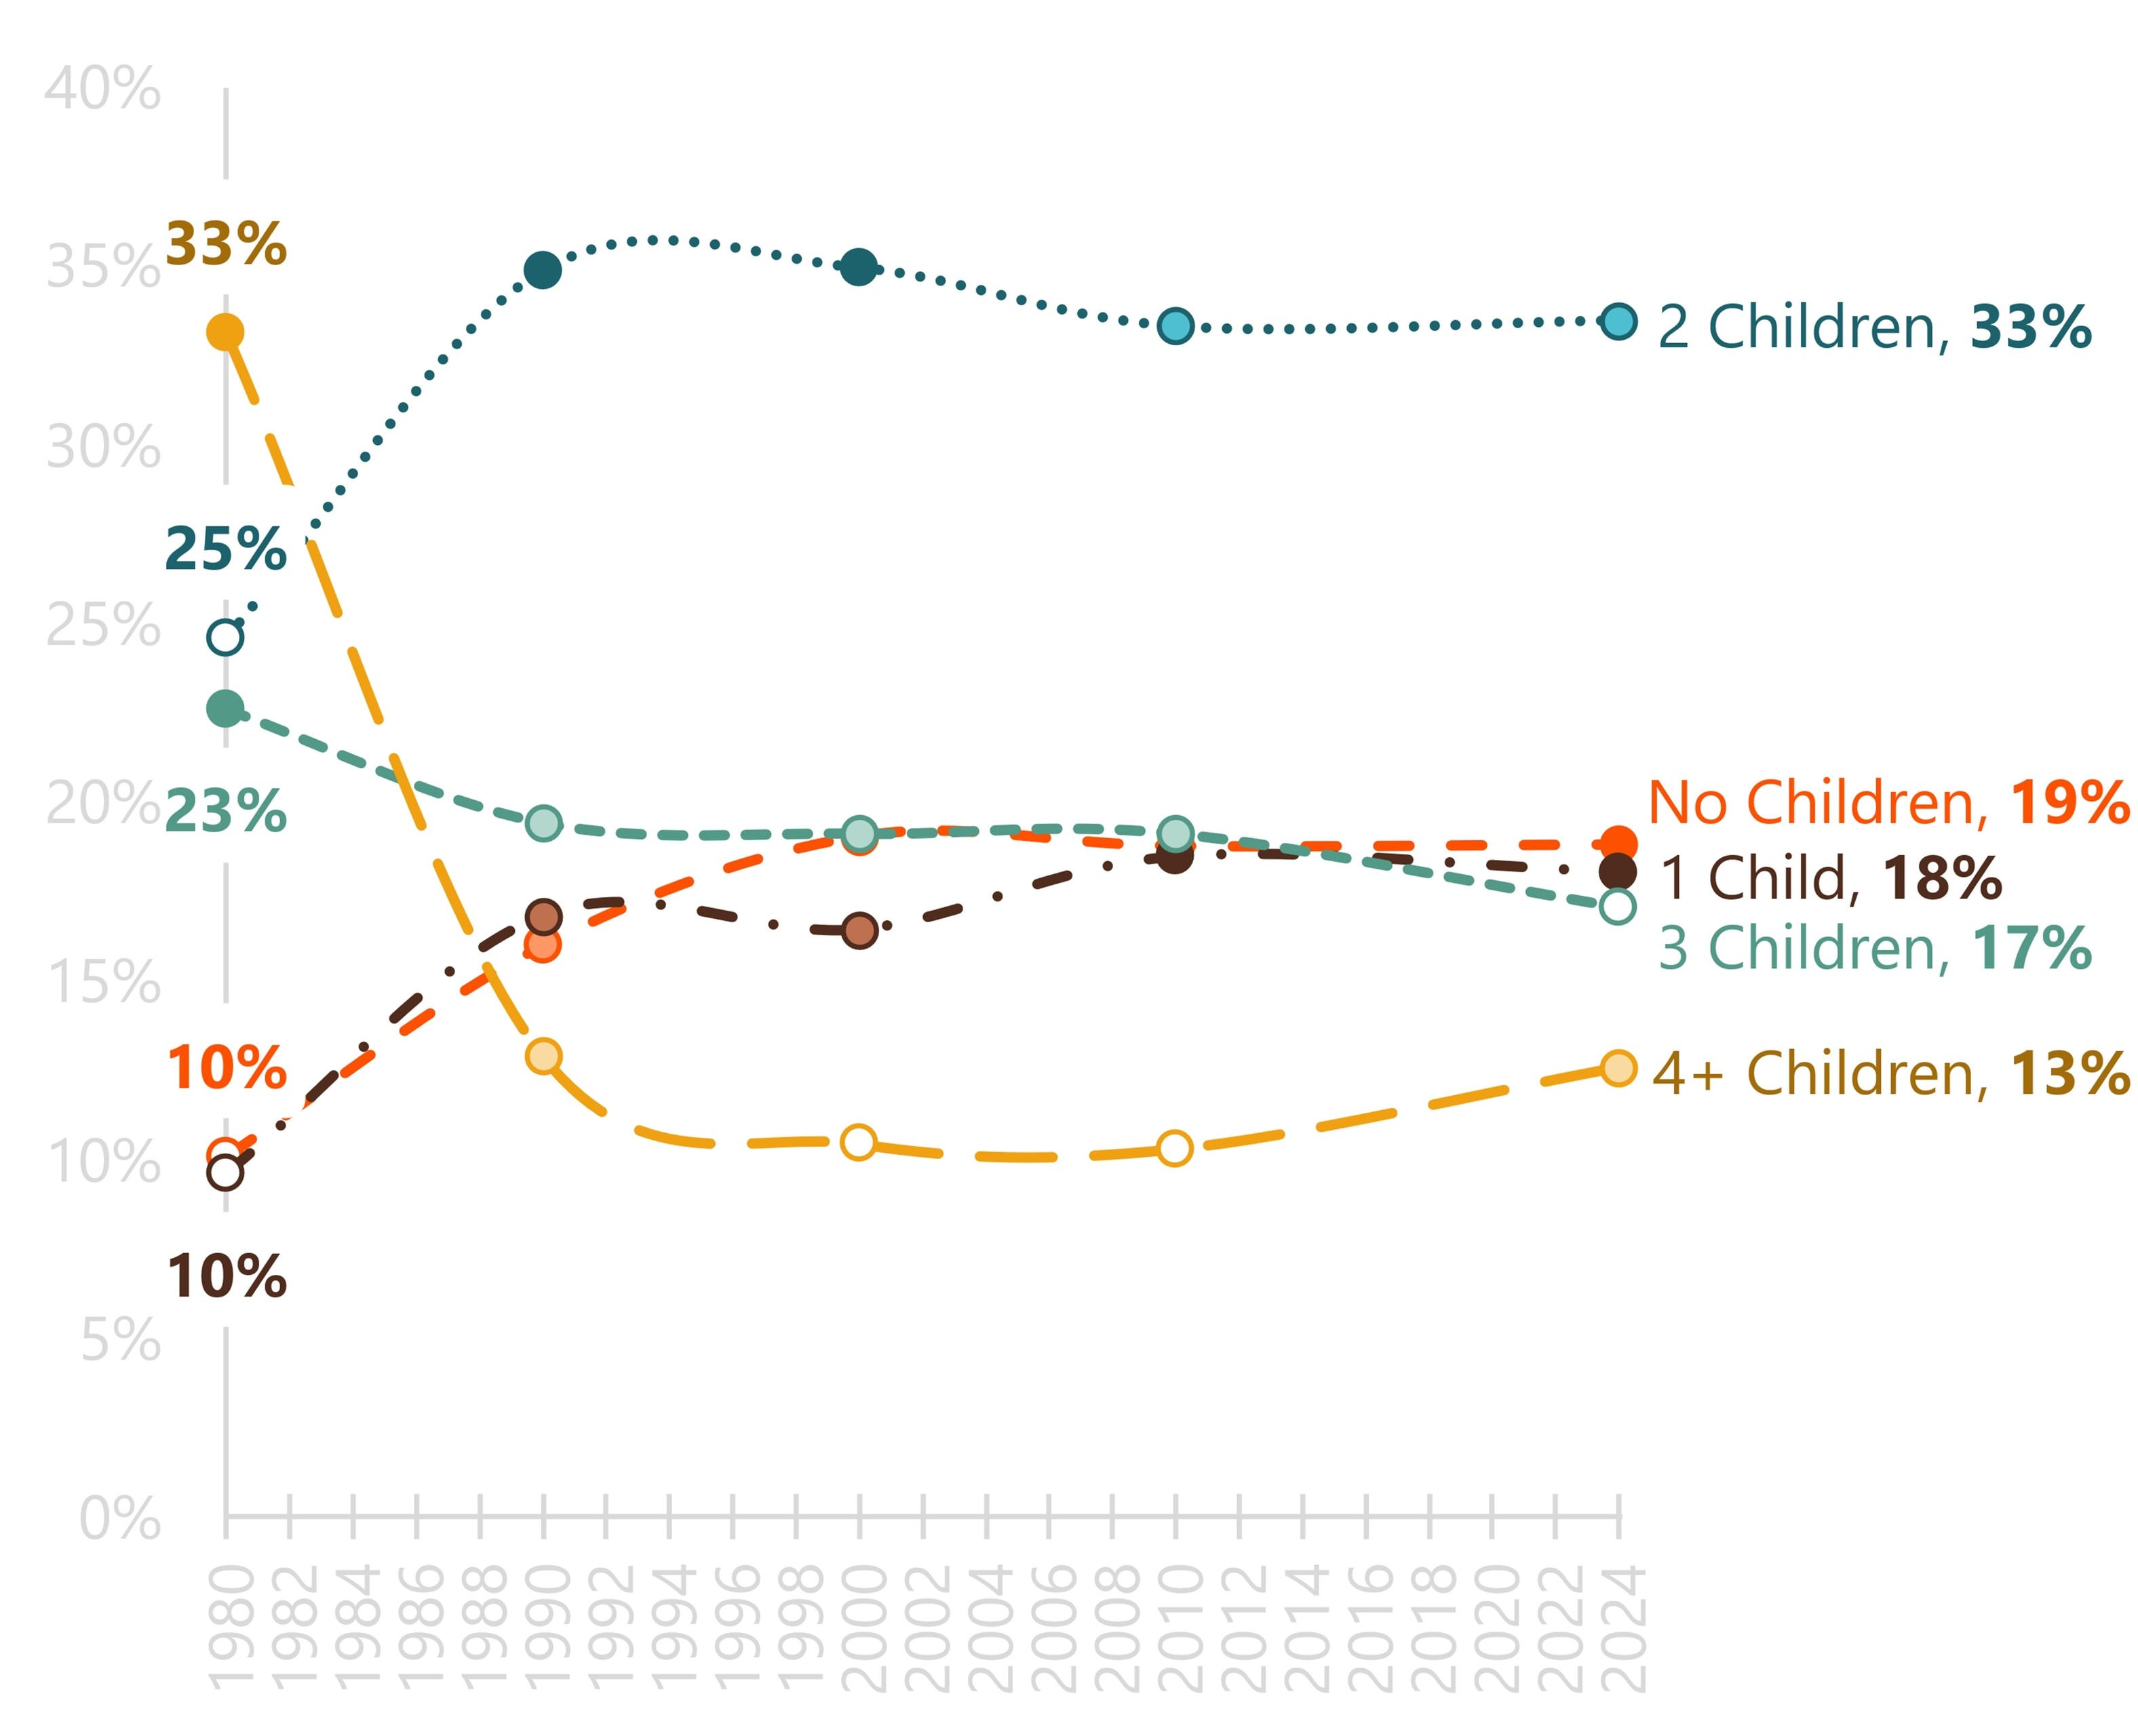
- The percentage of females aged 40 to 44 who did not have children increased from 10% in 1980 to 19% in 2000 and has since remained roughly stable through 2024.
- The share of females with only one child nearly doubled from 10% in 1980 to 19% in 2010 and has since plateaued around that level, at 18% in 2024.
- Having two children has been the most common pattern since 1990, but the percentage has decreased slightly from 35% in 2000 to 33% in 2024.
- The proportion of females with three children has remained stable for nearly three decades, with about 19% in this category from 1990 to 2010. Since then, it has dropped slightly to 17% in 2024.
- Females with four or more children were the modal category in 1980 (33%) but represented the lowest percentage since 1990. Since 2010 it has increased slightly from 10% to 13% in 2024.
Figure 1. Number of Children Ever Born to Females Aged 40-44, 1980-2024
Source: NCFMR analyses of Current Population Survey, June Fertility and Marriage Supplement, 1980, 1990, 2000, 2010, 2024
Note. Categories may not sum to 100% due to rounding. Estimates from 2020 are not presented because the Census Bureau noted unusually low CPS response rates due to COVID-19, and IPUMS states this could potentially affect Fertility Supplement estimates.
Trends in the Distribution of Children Ever Born by Race and Hispanic Ethnicity
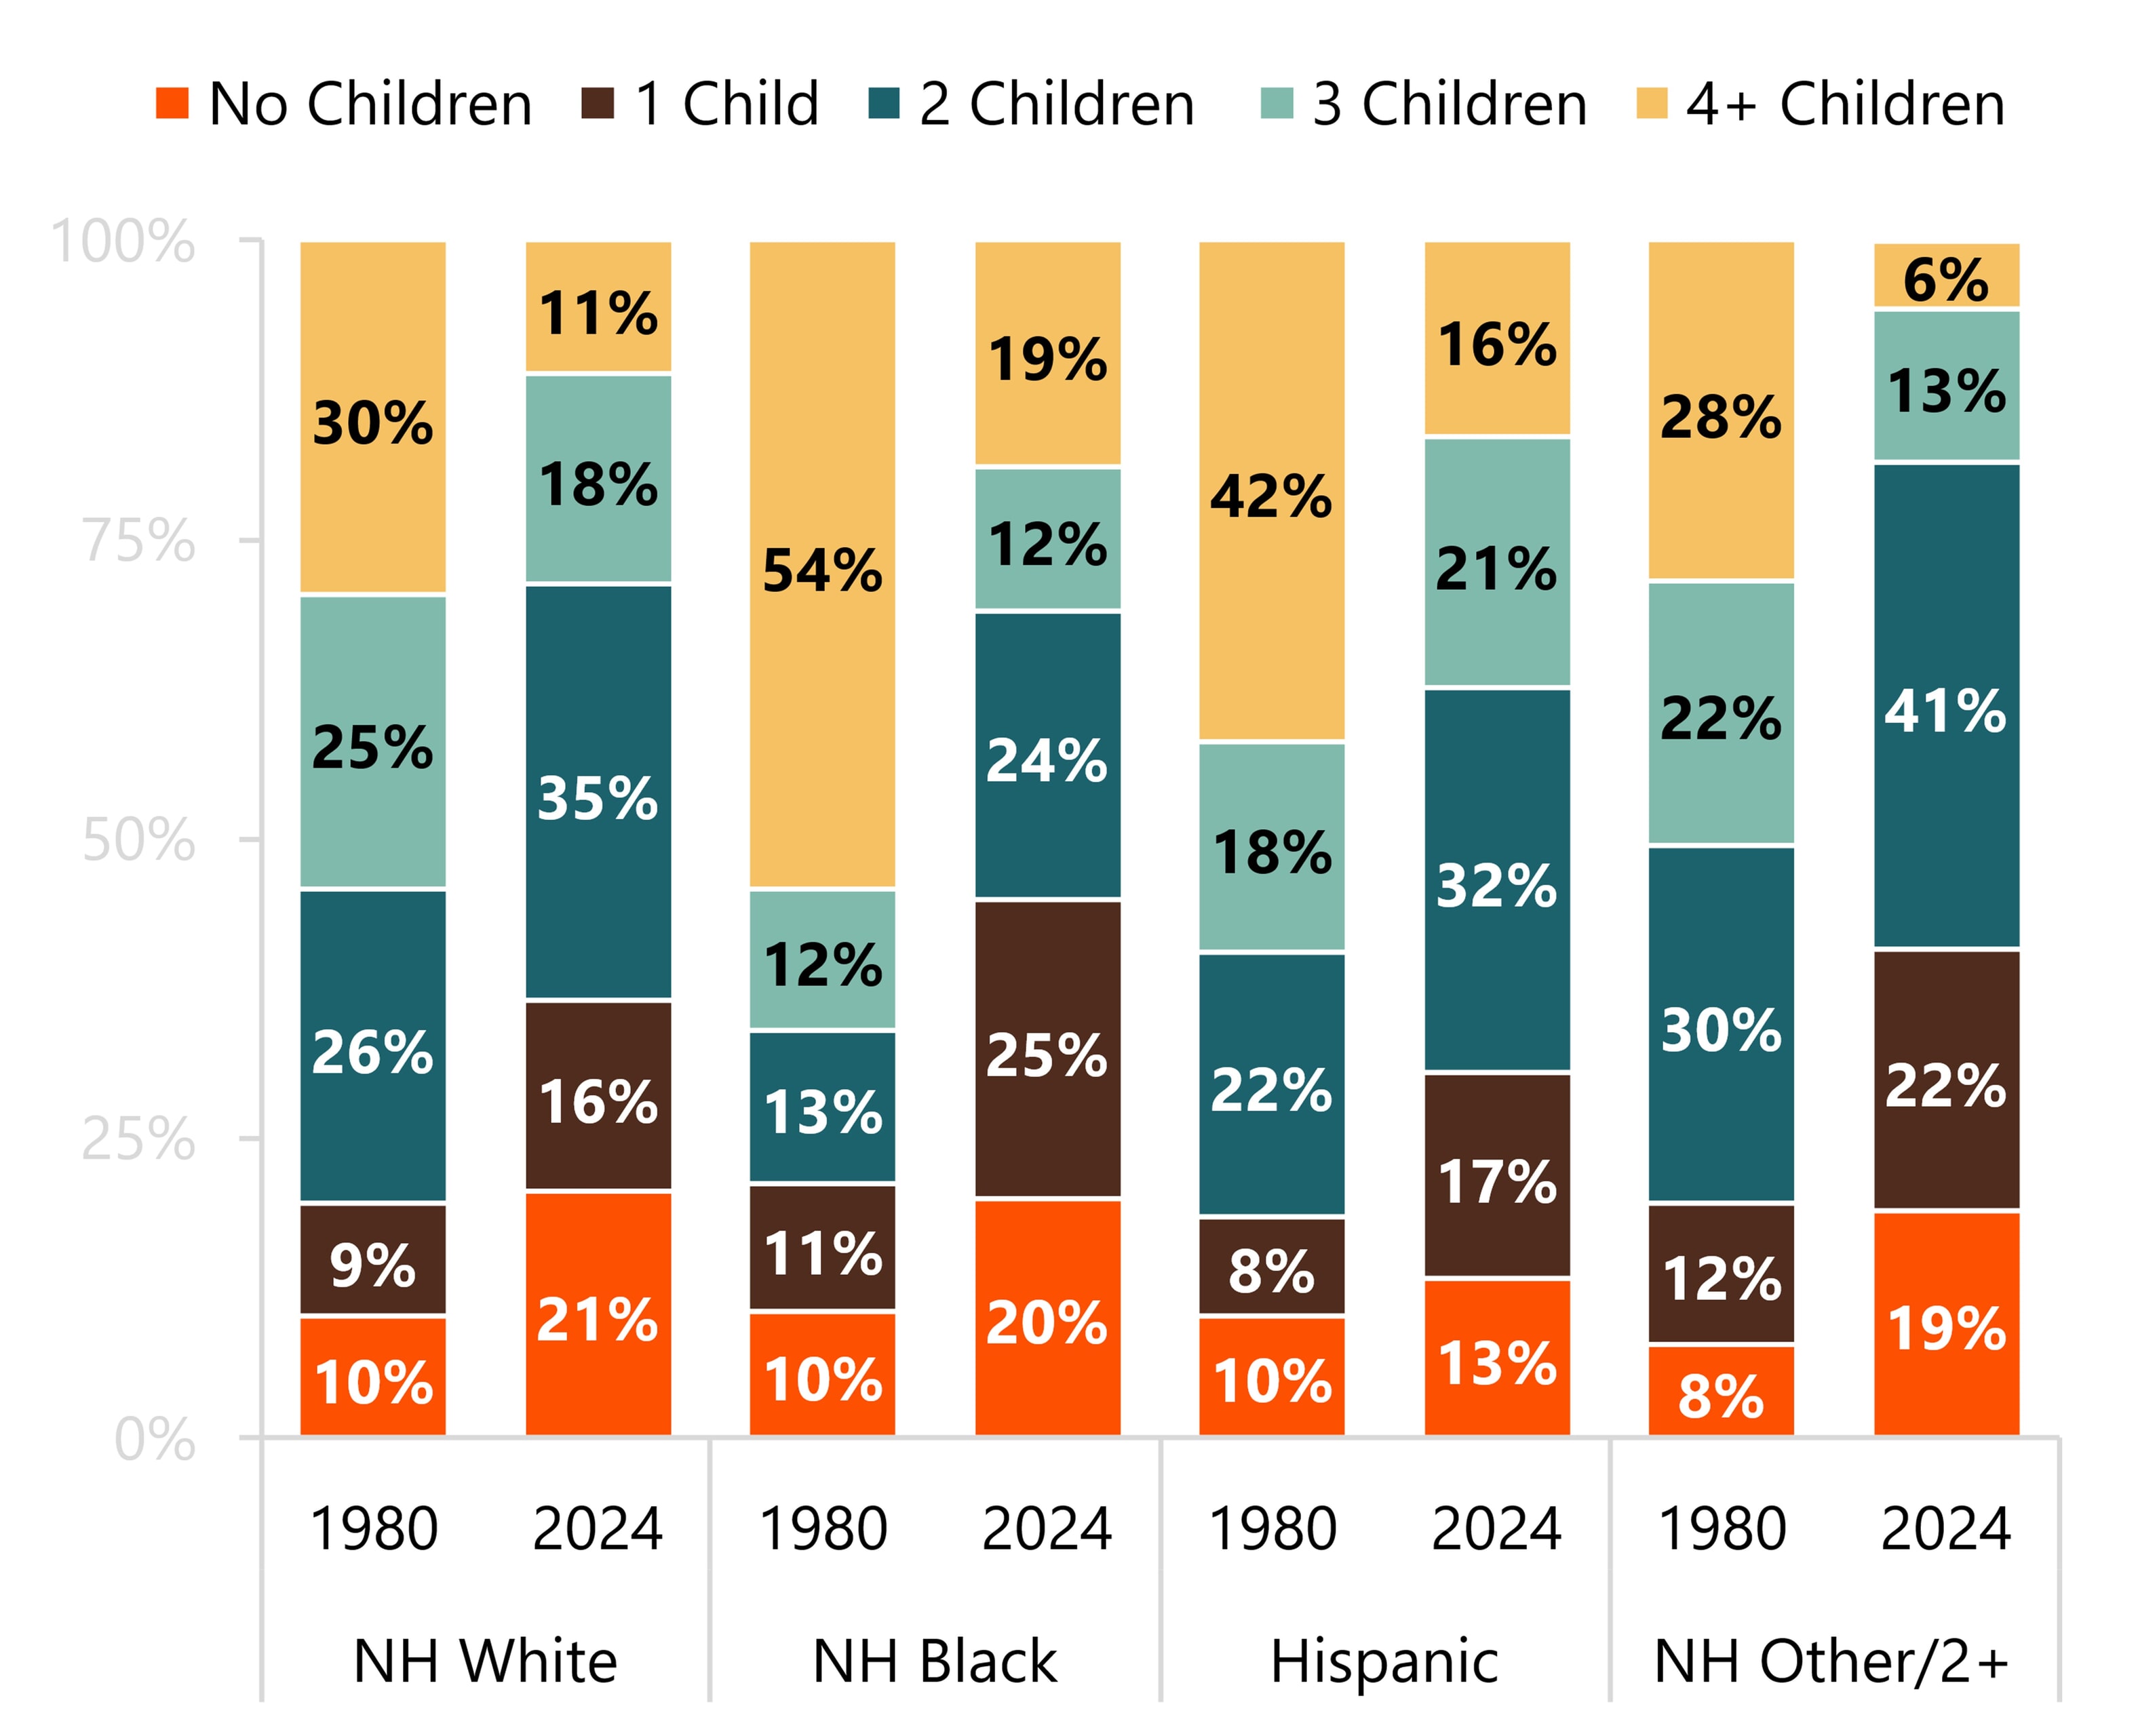
- Childlessness increased substantially across most groups from 1980 to 2024. The growth was smallest among Hispanic females, for whom childlessness increased from 10% in 1980 to 13% in 2024. For the remaining race/ethnic groups considered here childlessness has at least doubled. Growth was largest among non-Hispanic Other/2+ females, for whom childlessness increased from 8% in 1980 to 19% in 2024.
- Growing shares of females had only one child from 1980 to 2024 across all groups. In 2024, the greatest share having one child was among non-Hispanic Black females (25%), for whom it was the most common completed family size.
- All groups experienced increases in the share having two children; in 2024, it was the modal category for all groups, except for non-Hispanic Black females.
- The percentage with three children rose for Hispanic females since 1980 (18% to 21%) and was unchanged among non-Hispanic Black females (12%).
- Large families—those with four or more children—declined substantially across all groups.
Figure 2. Number of Children Ever Born to Females Aged 40-44 by Race and Hispanic Ethnicity, 1980 & 2024
Source: NCFMR analyses of Current Population Survey, June Fertility and Marriage Supplement, 1980 & 2024
Note. Categories may not sum to 100% due to rounding. NH = non-Hispanic. Other/2+ Races includes non-Hispanic individuals identifying as Asian (including Native Hawaiian and Other Pacific Islander), American Indian or Alaska Native alone, some other race alone, or two or more races.
Trends in the Distribution of Children Ever Born by Educational Attainment
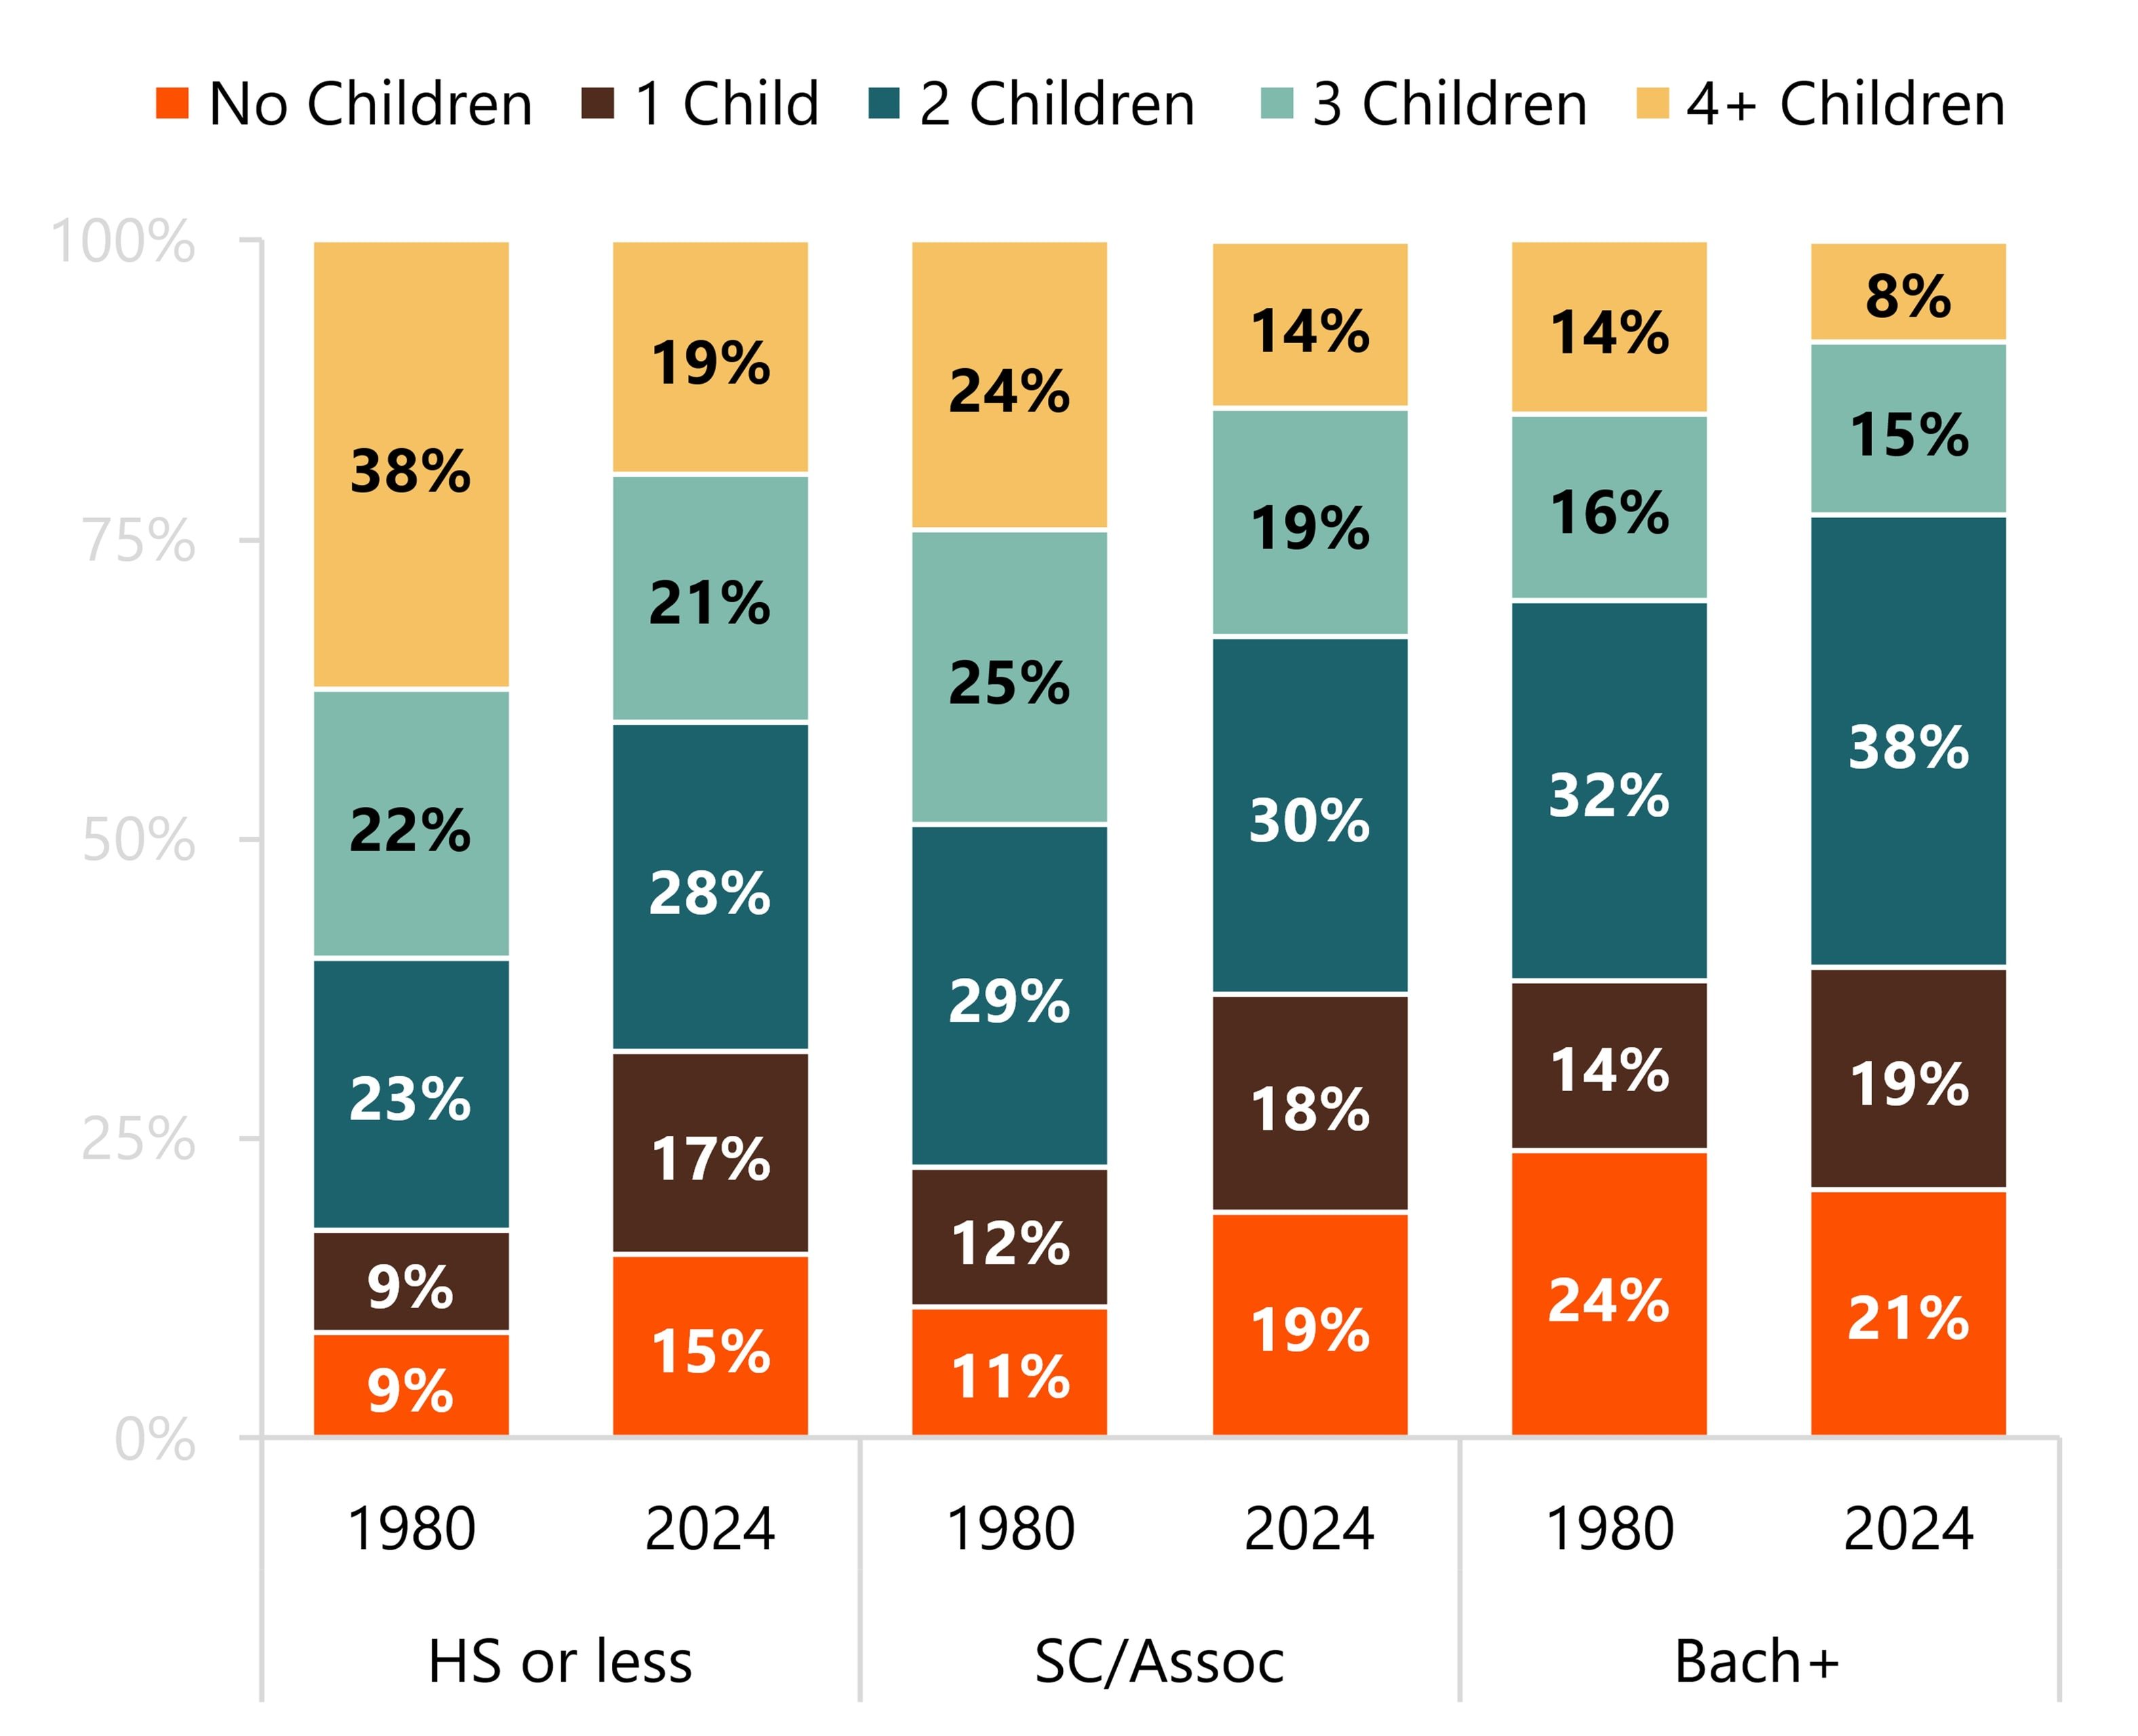
- Childlessness increased for every education group except females with a bachelor’s degree or higher. They experienced a decrease in childlessness from 1980 (24%) to 2024 (21%).
- The share with only one child among those with a high school diploma or less nearly doubled from 9% in 1980 to 17% in 2024. A much smaller increase was experienced among those with some college or an associate degree and those with at least a bachelor’s degree.
- In 2024, the modal number of children ever born was two across all educational attainment groups, and the share of females who had three children declined slightly across all groups.
- In 1980, females with a high school education or less most commonly had four or more children (38%), but this share was halved by 2024 (19%). While not as dramatic, the shares with four or more children among females with some college or an associate degree and those with at least a bachelor’s degree declined substantially (24% to 14% and 14% to 8%, respectively).
Figure 3. Number of Children Ever Born to Females Aged 40-44 by Education, 1980 & 2024
Source: NCFMR analyses of Current Population Survey, June Fertility and Marriage Supplement, 1980 & 2024
Note. Categories may not sum to 100% due to rounding. HS = high school; SC = some college; Assoc = associate degree; Bach+ = bachelor’s degree or higher.
This Family Profile is an update of: FP-23-29 & FP-20-04

Data Source:
Flood, S., King, M., Rodgers, R., Ruggles, S., Warren, J. R., Backman, D., Breton, E., Cooper, G., Rivera Drew, J. A., Richards, S., Van Riper, D., & Williams, K. C. W. (2025). IPUMS CPS: Version 13.0 [Data set]. IPUMS. https://doi.org/10.18128/D030.V13.0
References:
Guzzo, K. B., & Loo, J. (2023). Number of children ever born to women aged 40-44, 1980-2022. Family Profiles, FP-23-29. Bowling Green, OH: National Center for Family & Marriage Research. https://doi.org/10.25035/ncfmr/fp-23-29
Guzzo, K. B., & Schweizer, V. (2020). Number of children to women aged 40-44, 1980-2018. Family Profiles, FP-20-04. Bowling Green, OH: National Center for Family & Marriage Research. https://doi.org/10.25035/ncfmr/fp-20-04
Hays, J. (2026, June 17). Is U.S. fertility at an all-time low? It depends how you measure it. Pew Research Center. https://www.pewresearch.org/short-reads/2026/06/17/is-us-fertility-at-an-all-time-low-it-depends-how-you-measure-it/
Suggested Citation:
Westrick-Payne, K. K. (2026). Number of children ever born to females aged 40-44, 1980-2024. Family Profiles, FP-26-18. Bowling Green, OH: National Center for Family & Marriage Research. https://doi.org/10.25035/ncfmr/fp-26-18
Updated: 09/30/2026 06:26PM