
Demographic Variation by Kinless Status Among U.S. Adults Aged 56+, 2022
An Aging Family Portrait (AFP-26-04)
Gabrielle Juteau & Susan L. Brown

Introduction
In 2022, about 6.5% of U.S. older adults aged 56+ were considered kinless, meaning they were both single and childless (authors’ calculation). Due to ongoing declines in marriage and fertility as well as the high level of gray divorce, this proportion is projected to rise dramatically in the coming decades (Verdery & Margolis, 2017). Using data from the 2022 Health and Retirement Study(1), this Aging Family Portrait presents a sociodemographic profile of kinless older adults aged 56+, relative to non-kinless adults of the same age.
(1) The HRS (Health and Retirement Study) is sponsored by the National Institute on Aging (grant number NIA U01AG009740) and is conducted by the University of Michigan.
Age
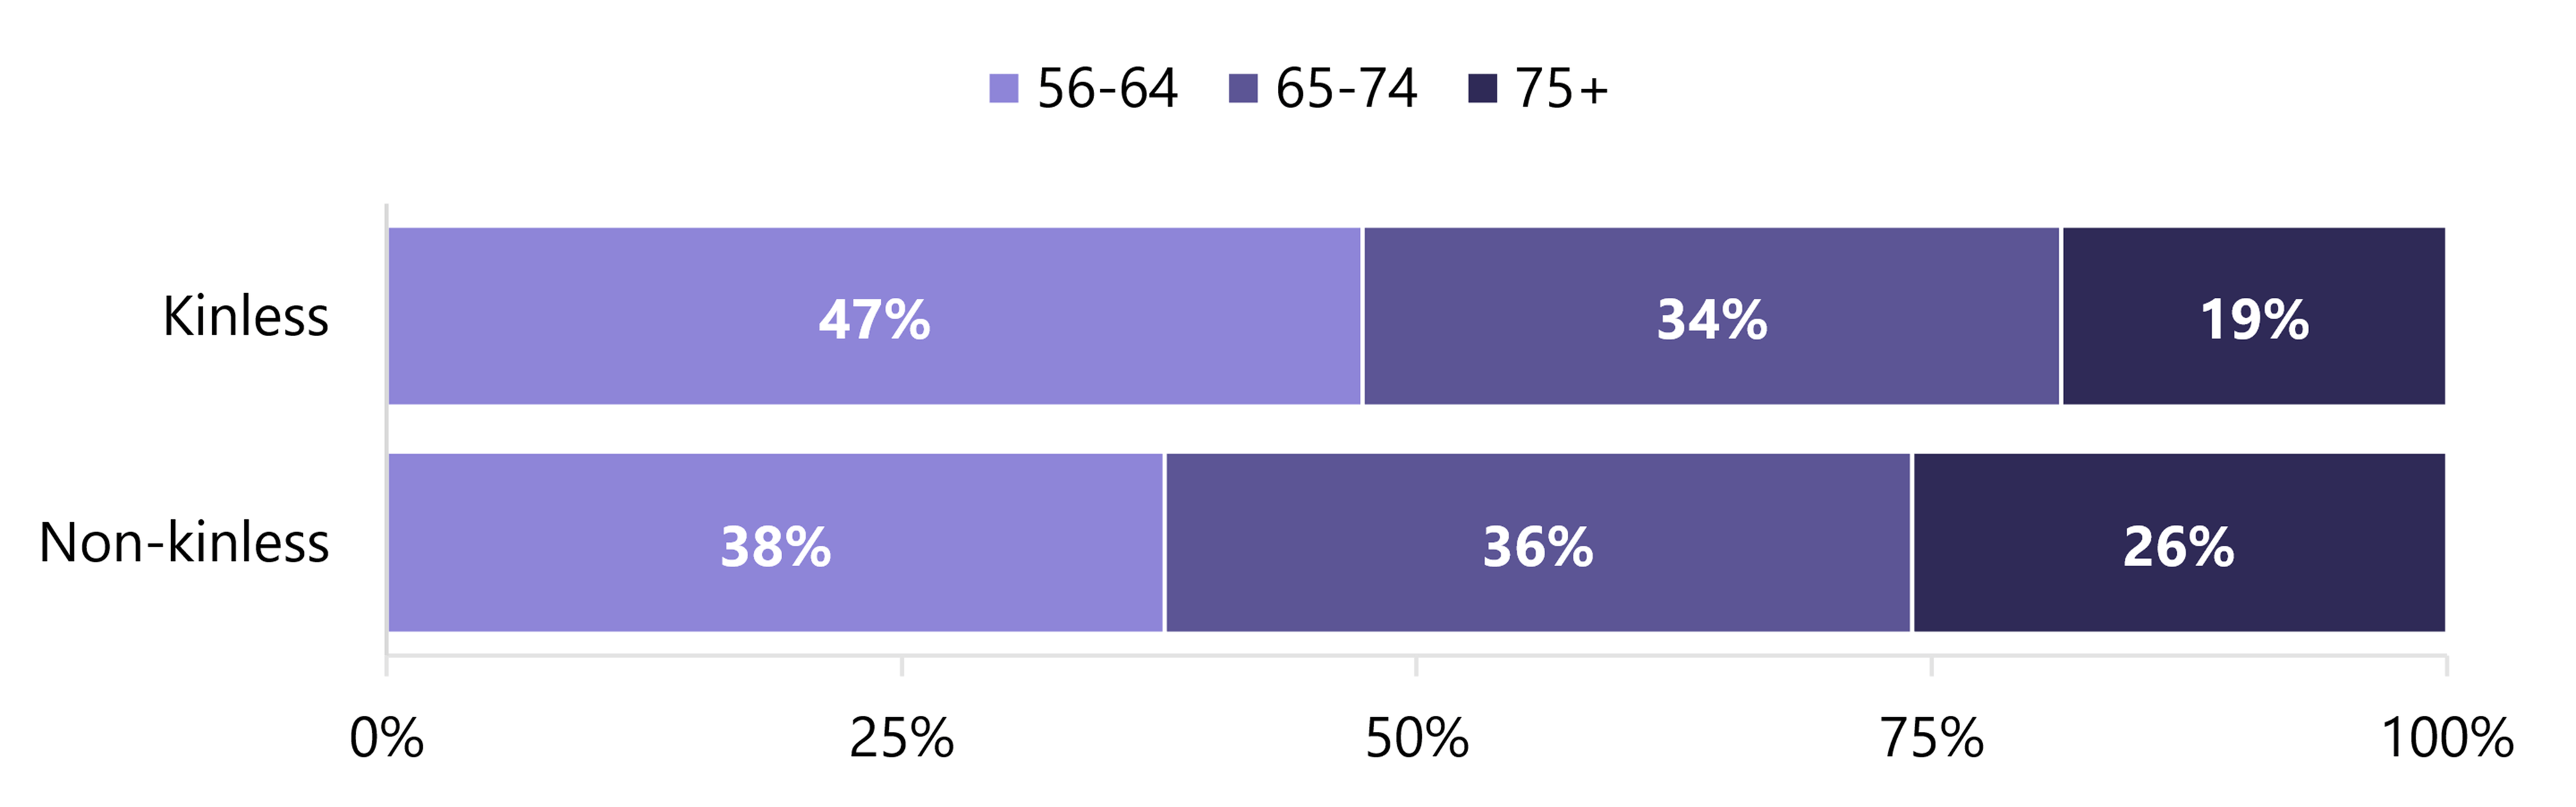
Kinless older adults were younger than their non-kinless peers.
In 2022, nearly half (47%) of kinless older adults were aged 56 to 64 years, compared with 38% of non-kinless older adults. Whereas fewer than one-fifth (19%) of kinless older adults were at least 75 years old, more than one-quarter (26%) of non-kinless older adults belonged to that age group.
Figure 1. Age Group by Kinless Status, U.S. Adults Aged 56+, 2022
Source: CAF analysis of Health Retirement Study, 2022 (RAND HRS)
Note. Categories may not sum to 100% due to rounding.
Education
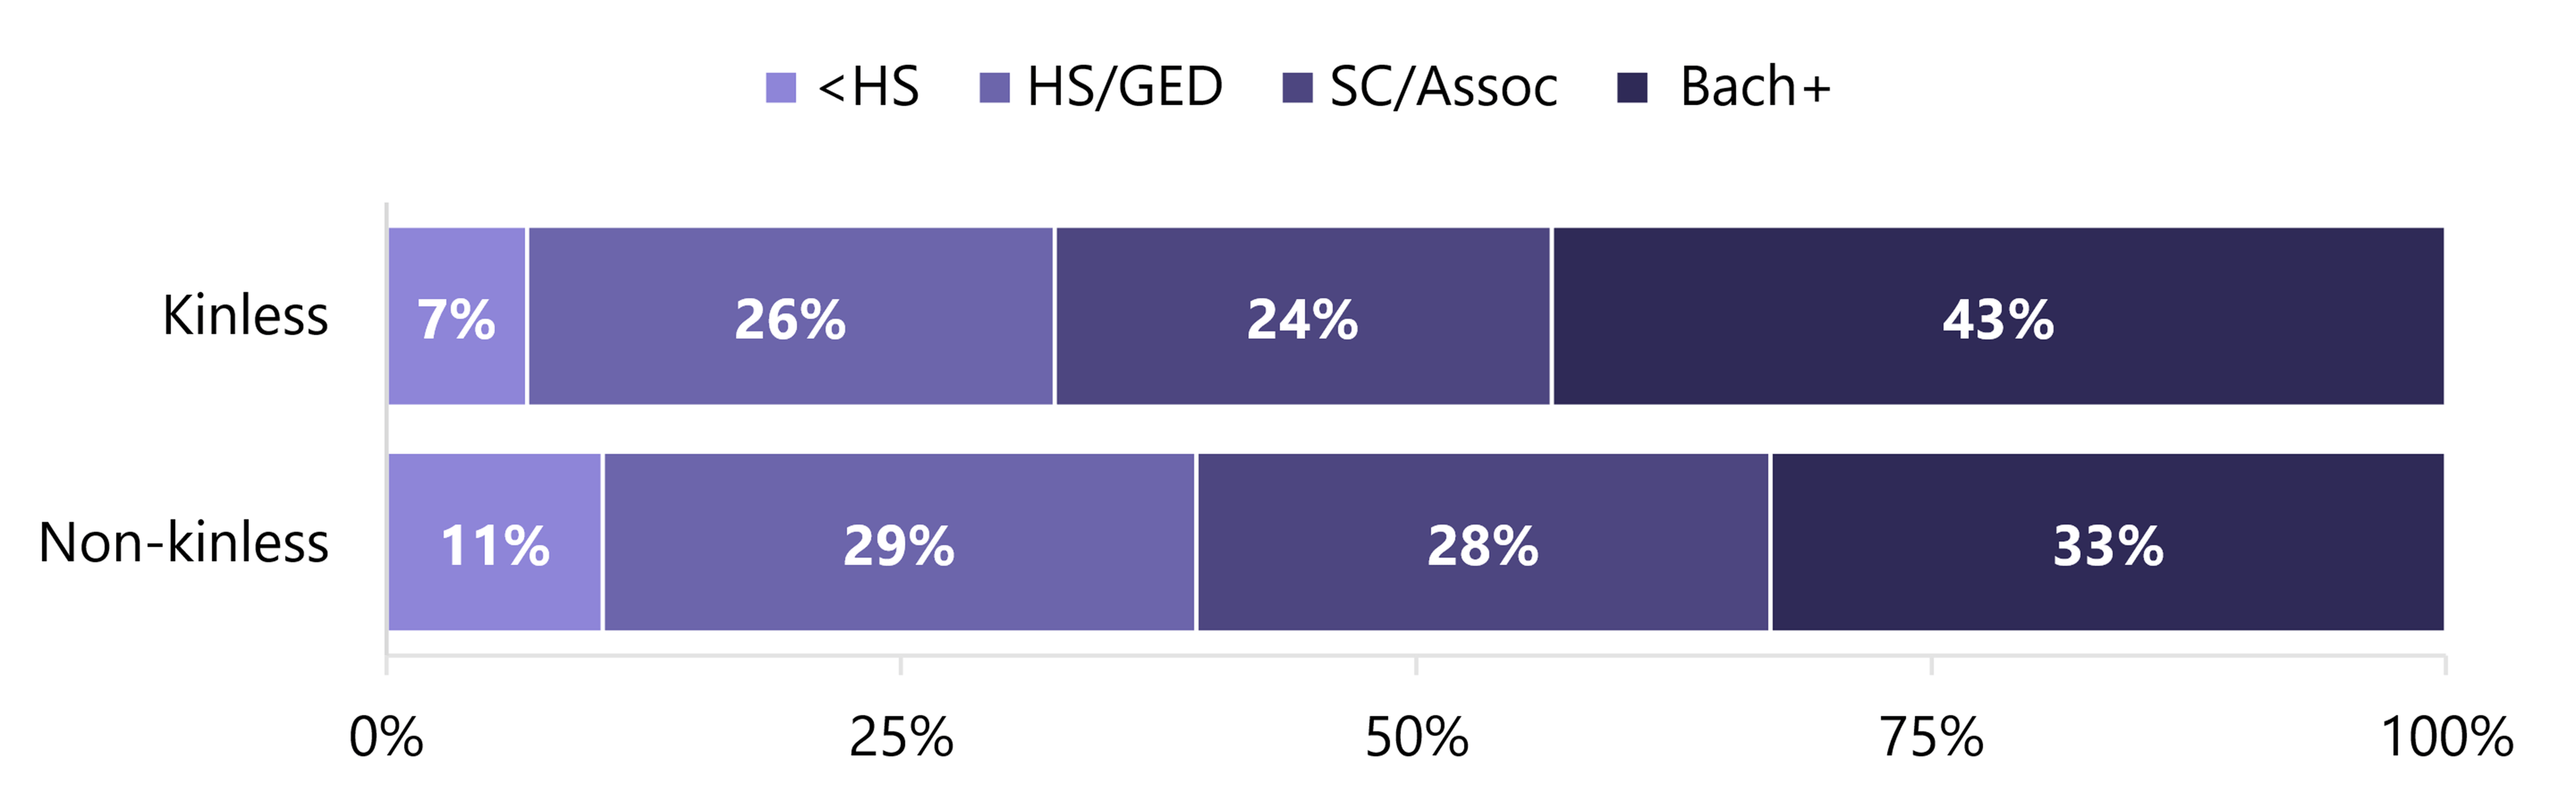
Nearly half of kinless older adults had a bachelor’s degree or more.
Among kinless older adults, 43% had a bachelor’s degree or higher compared with 33% of non-kinless older adults.
Figure 2. Educational Attainment by Kinless Status, U.S. Adults Aged 56+, 2022
Source: CAF analysis of Health Retirement Study, 2022 (RAND HRS)
Note. Categories may not sum to 100% due to rounding. HS = high school; GED = general education diploma; SC = some college; Assoc = associate degree; Bach+ = bachelor’s degree or higher.
Wealth
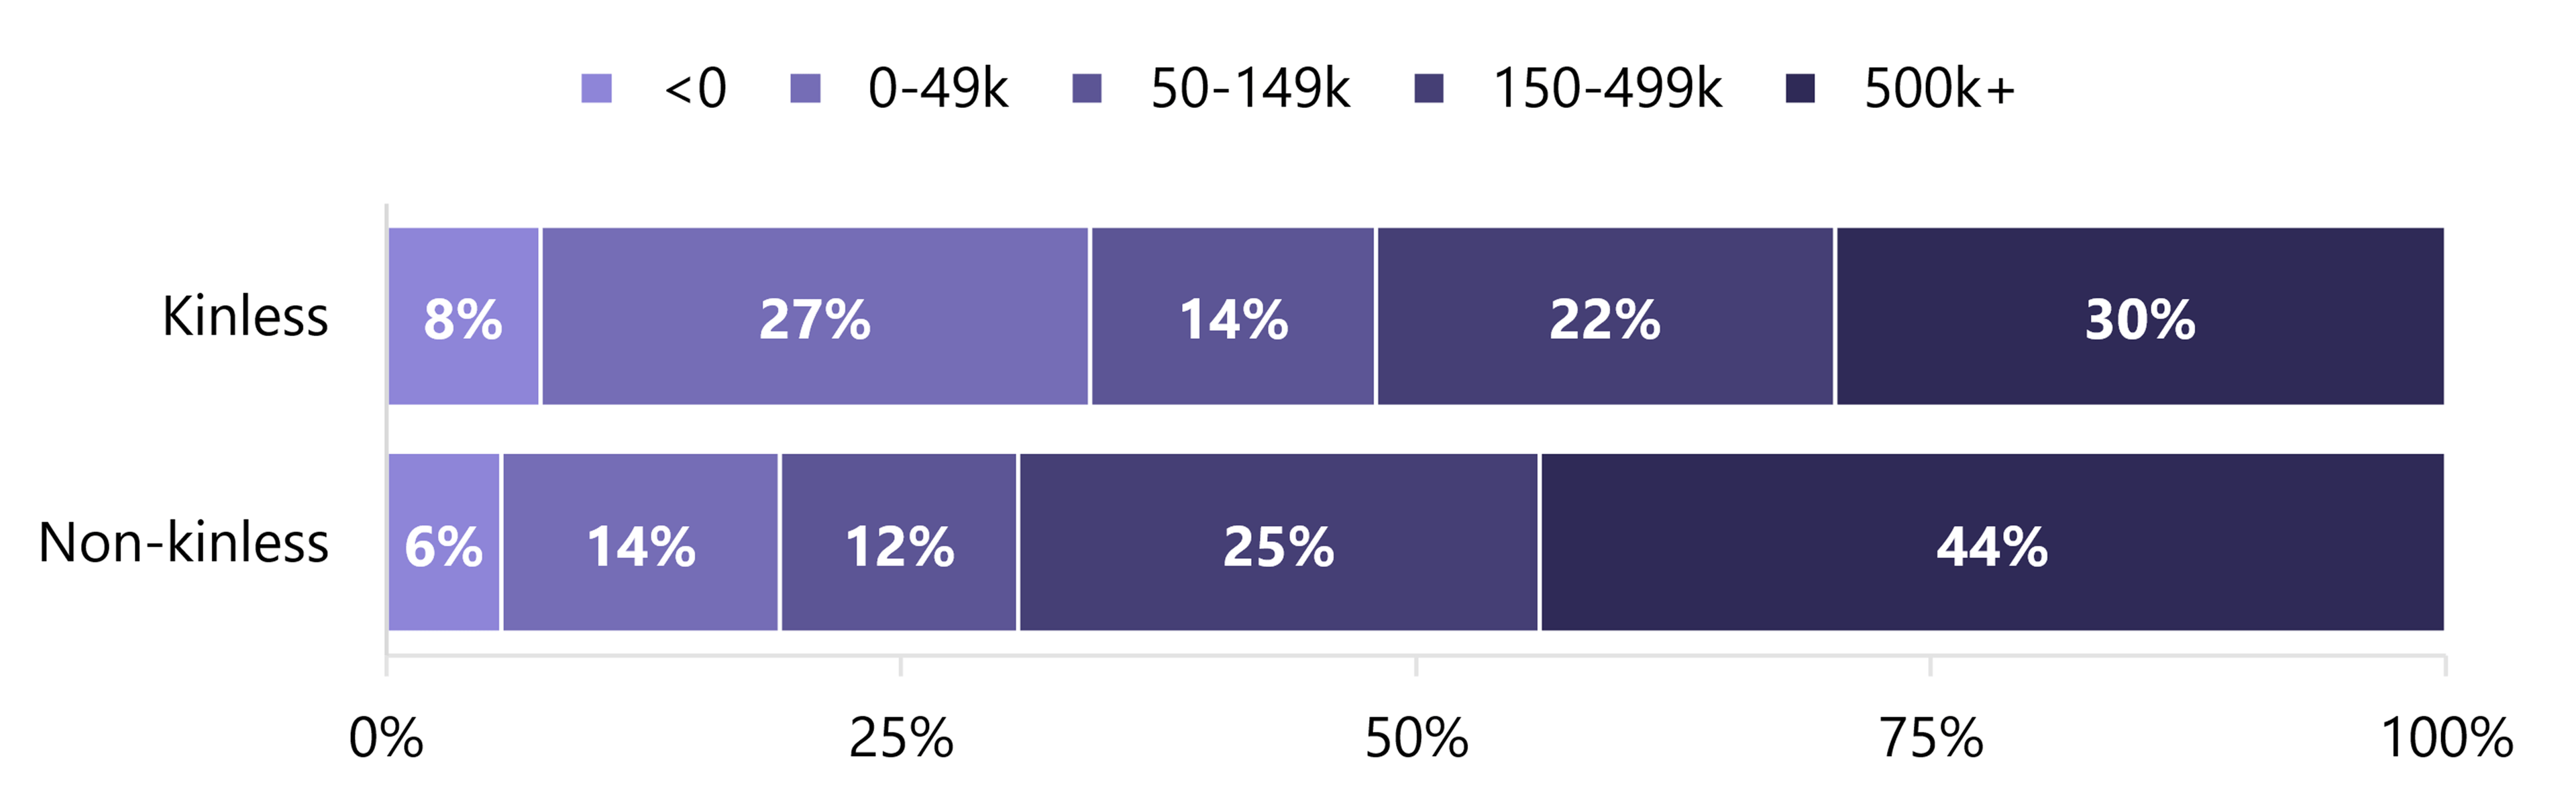
Non-kinless older adults amassed more wealth than kinless older adults.
Figure 3. Wealth by Kinless Status, U.S. Adults Aged 56+, 2022
Source: CAF analysis of Health Retirement Study, 2022 (RAND HRS)
Note. Categories may not sum to 100% due to rounding.
Union Status
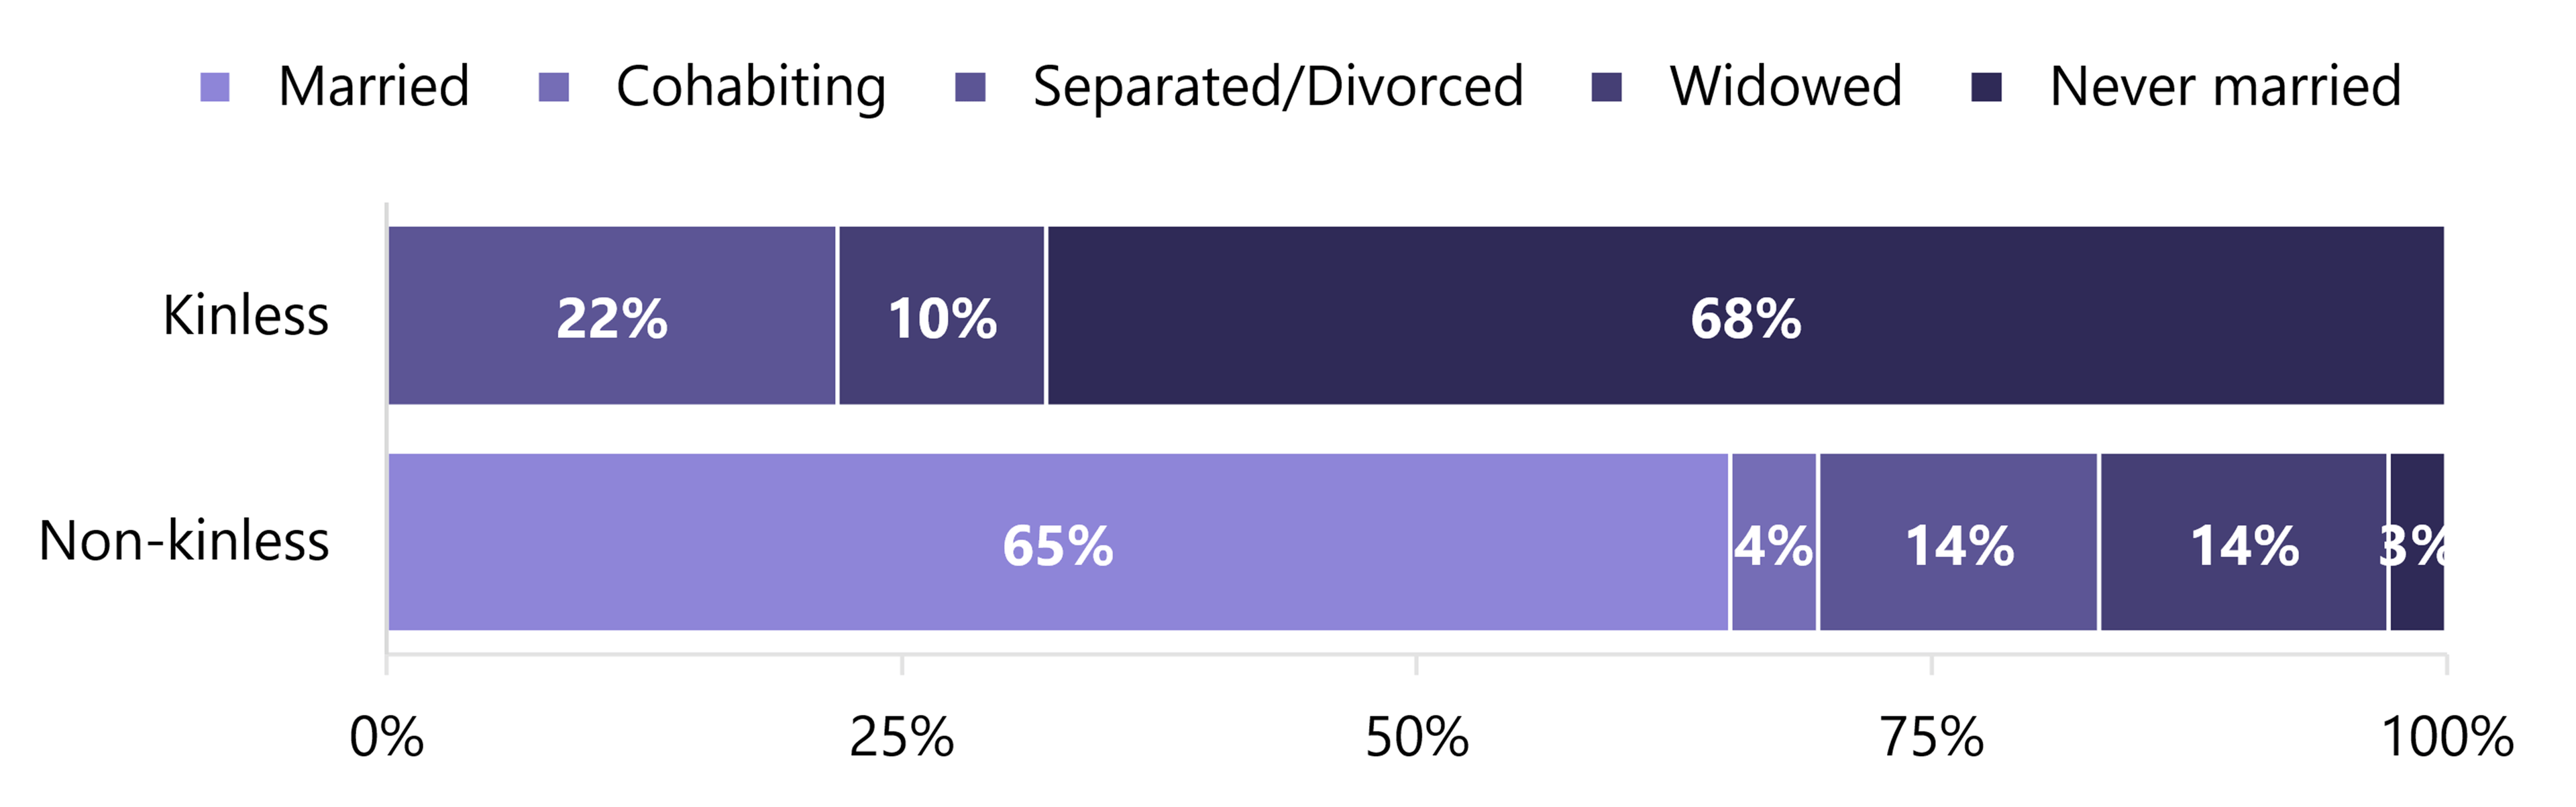
Most kinless older adults were never married.
Among kinless older adults, separation or divorce accounted for a larger share than among non-kinless older adults (22% vs. 14%).
Figure 4. Union Status by Kinless Status, U.S. Adults Aged 56+, 2022
Source: CAF analysis of Health Retirement Study, 2022 (RAND HRS)
Note. Categories may not sum to 100% due to rounding.
Living Arrangements
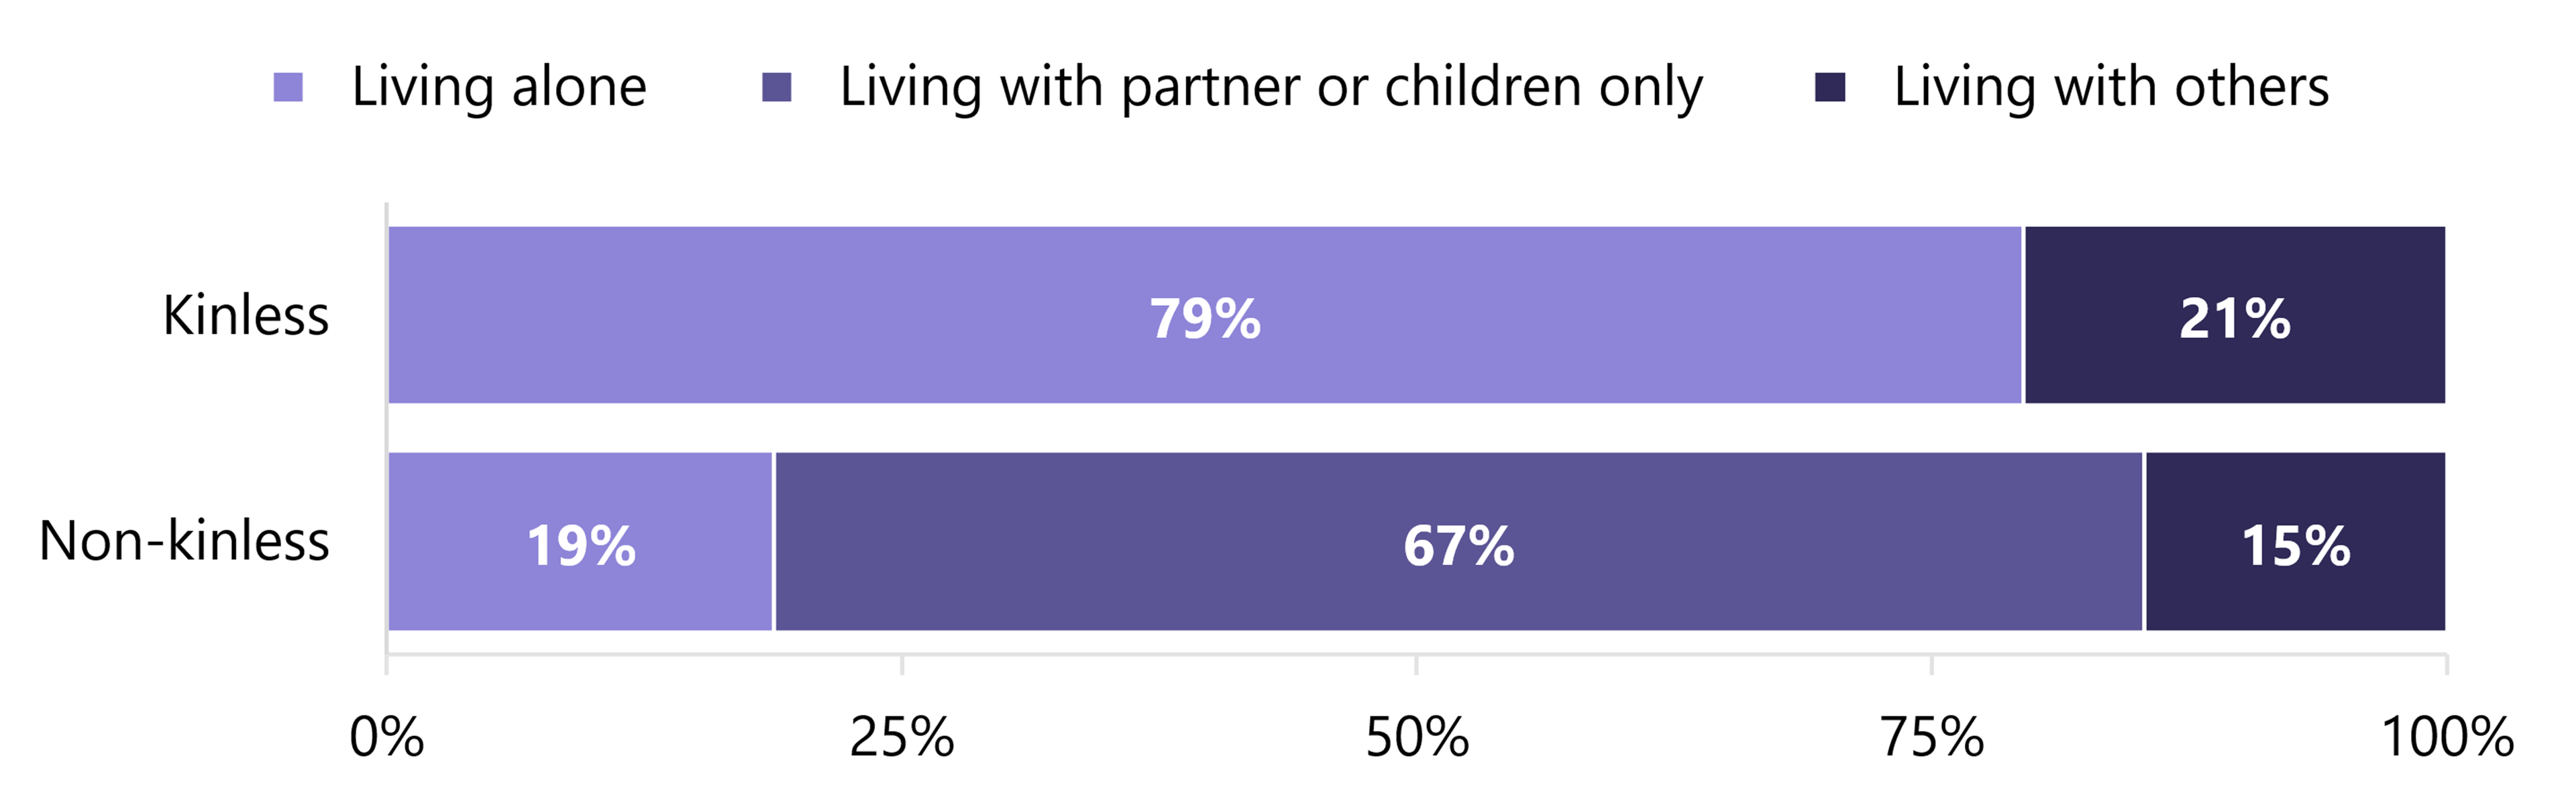
About four-fifths of kinless older adults lived alone.
Kinless older adults more often lived with others than did non-kinless older adults (21% vs. 15%, respectively).
Figure 5. Living Arrangements by Kinless Status, U.S. Adults Aged 56+, 2022
Source: CAF analysis of Health Retirement Study, 2022 (RAND HRS)
Note. Categories may not sum to 100% due to rounding.
Data Source
Health and Retirement Study, (RAND HRS Longitudinal File 2022 (V1)) public use dataset. Produced and distributed by the University of Michigan with funding from the National Institute on Aging (grant numbers NIA U01AG009740 and NIA R01AG073289). Ann Arbor, MI, (May 2025).
RAND HRS Longitudinal File 2022 (V1). Produced by the RAND Center for the Study of Aging, with funding from the National Institute on Aging and the Social Security Administration. Santa Monica, CA (May 2025).
References
Verdery, A. M., & Margolis, R. (2017). Projections of white and black older adults without living kin in the United States, 2015 to 2060. Proceedings of the national academy of Sciences, 114(42), 11109-11114. https://doi.org/10.1073/pnas.1710341114
Suggested Citation
Juteau, G., & Brown, S. L. (2026). Demographic variation by kinless status among U.S. adults aged 56+, 2022. An Aging Family Portrait, AFP-26-04. Bowling Green, OH: Center for Aging Families. https://doi.org/10.25035/caf/afp-26-04
Research reported in this publication was supported by the National Institute on Aging of the National Institutes of Health under award number P30AG096979. The content is solely the responsibility of the authors and does not necessarily represent the official views of the National Institutes of Health.
Updated: 07/15/2026 06:59PM