
Economic Well-being by Age and Relationship Status Among U.S. Adults Aged 50+, 2024
An Aging Family Portrait (AFP-26-05)
Krista K. Westrick-Payne & Susan L. Brown

Introduction
Although adults typically achieve their peak earnings in midlife, during older adulthood, most people are no longer working or work reduced hours. Despite this shift away from full-time employment, financial security tends to be higher for married than unmarried middle-aged and older adults (Carr et al., 2025). Using data from the 2015-2025 Current Population Survey, Annual Social and Economic Supplement, this portrait examines the financial well-being of U.S. adults aged 50-64 and 65+ with a focus on variation by relationship status.
Median Household Income
Between 2015 and 2025, median household income increased by about $16,000 among adults aged 50–64 and about $9,000 among those aged 65+.
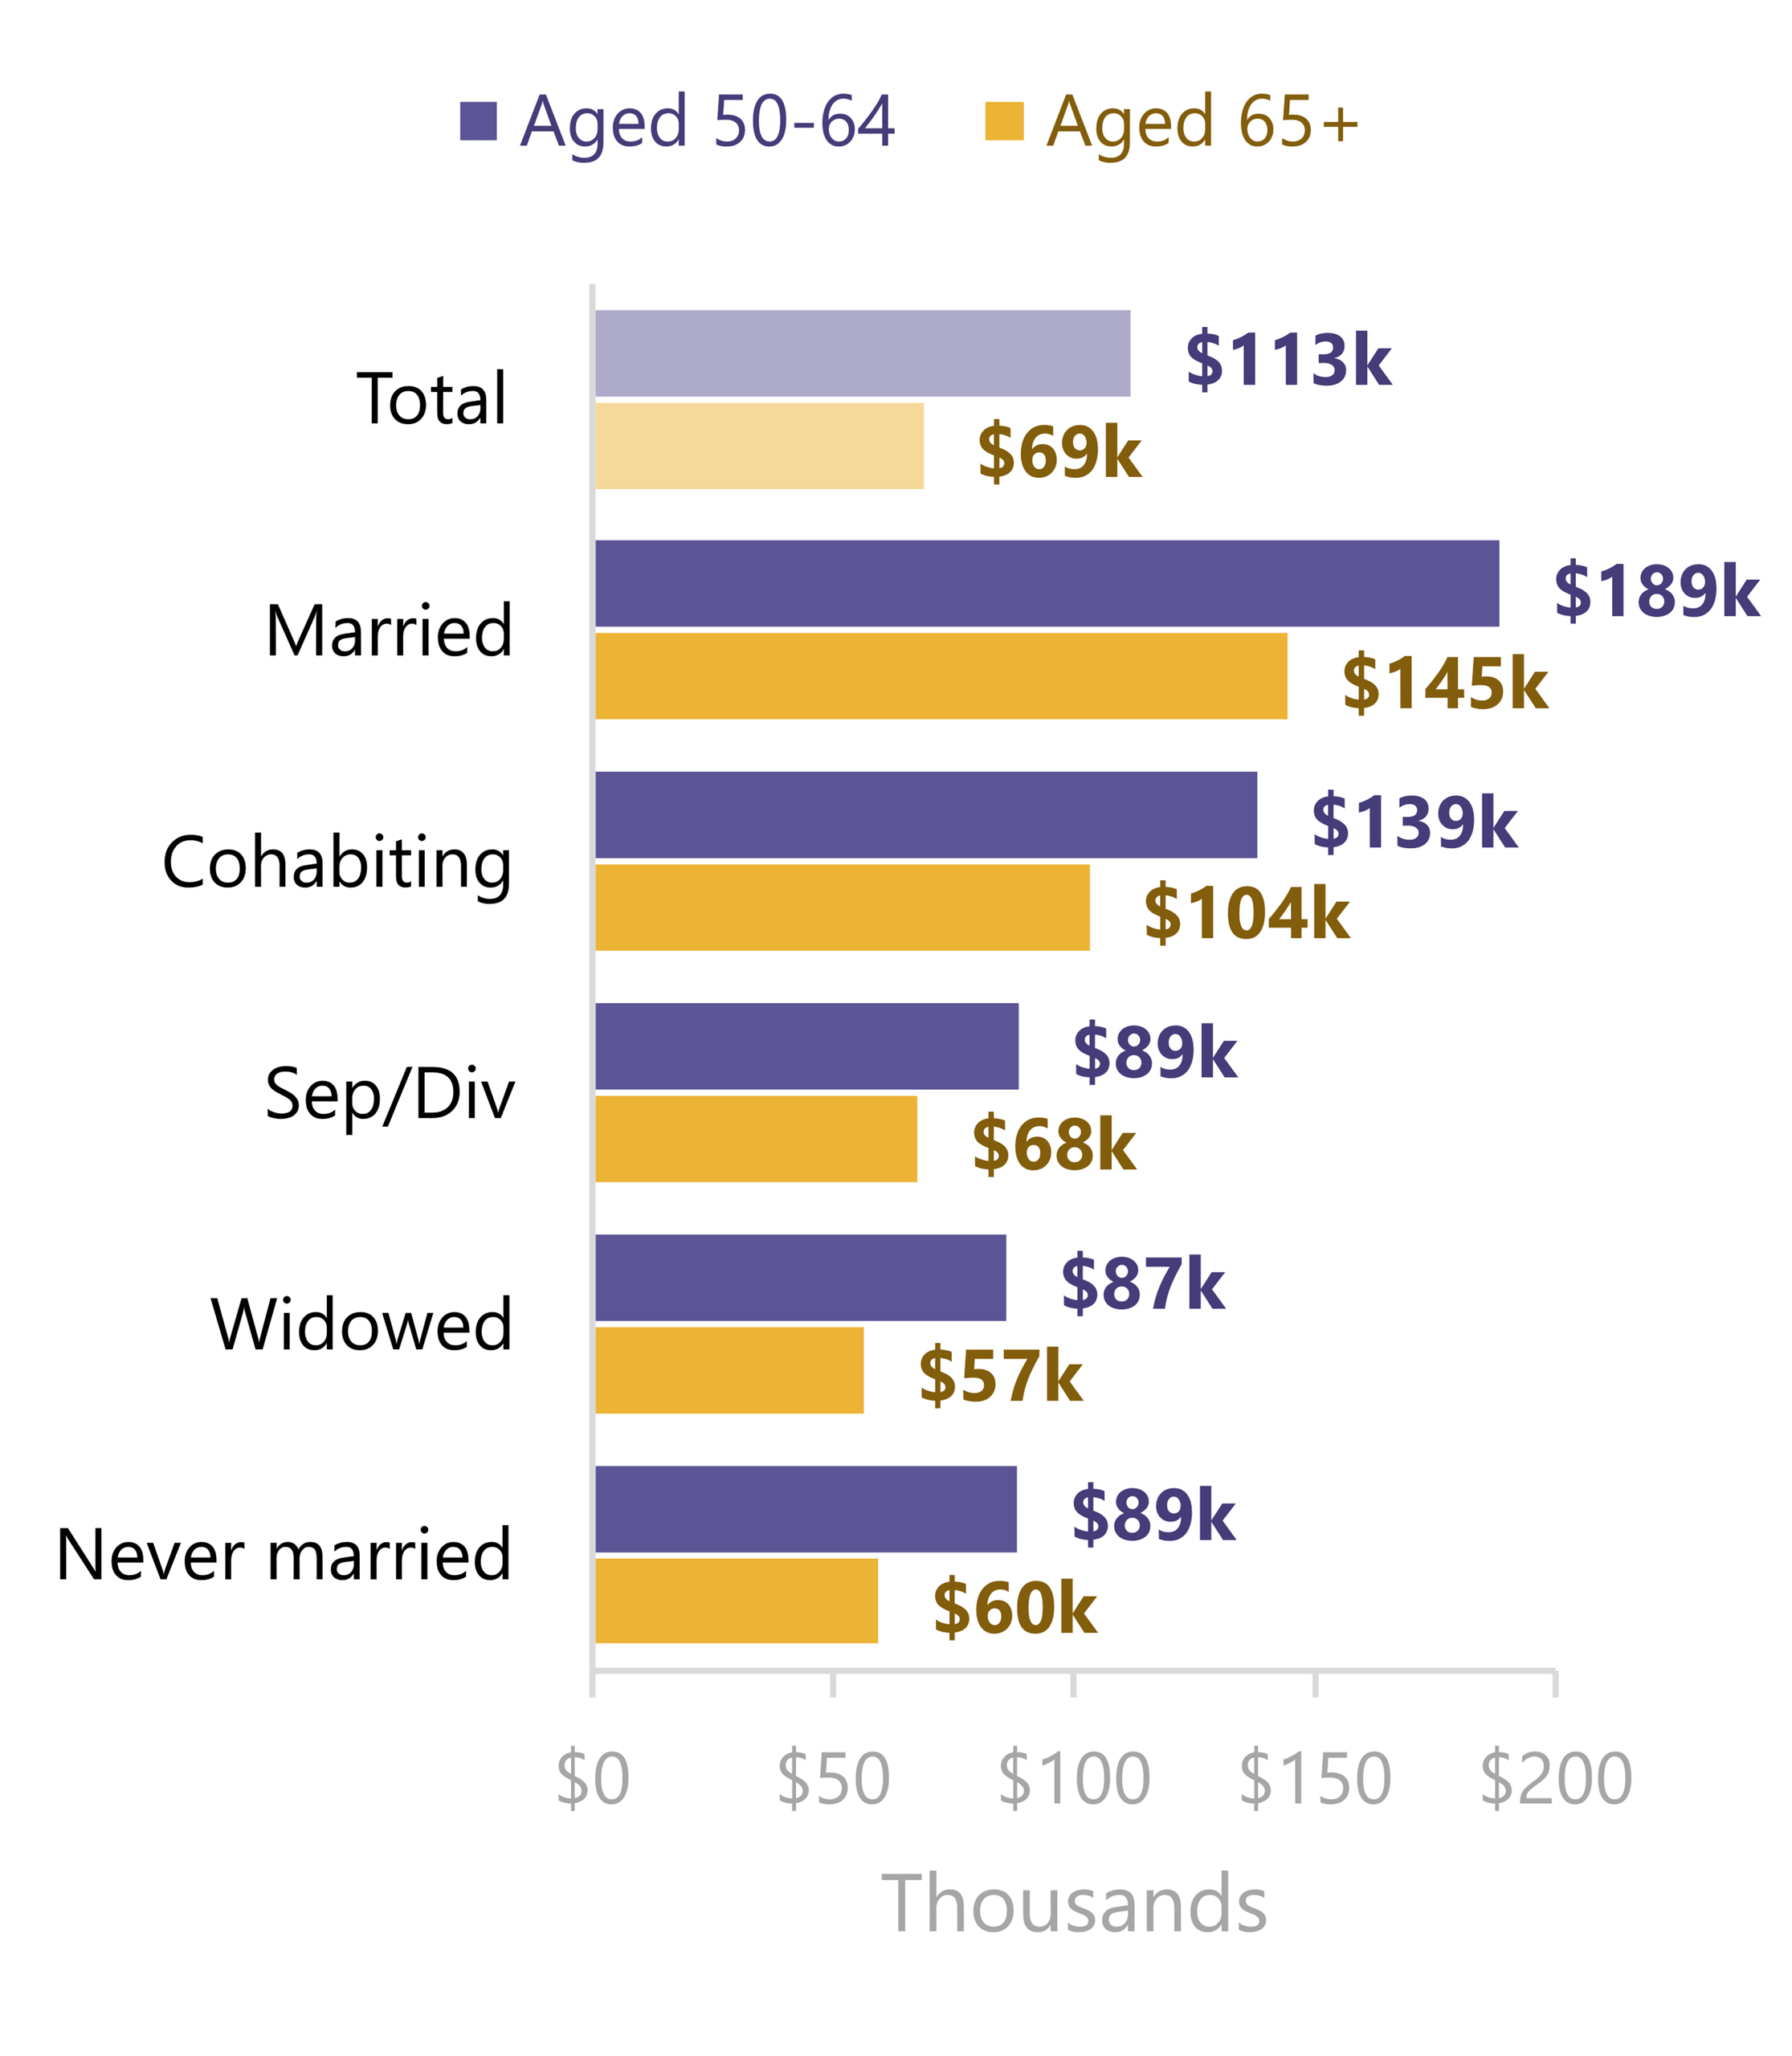
In 2025, median household income was highest among married adults in both age groups. Income differences across relationship status were larger among adults aged 50–64 than among those aged 65+.
Figure 1a. Trend in Median Household Income by Age Group Status, U.S. Adults Aged 50+, 2015-2025
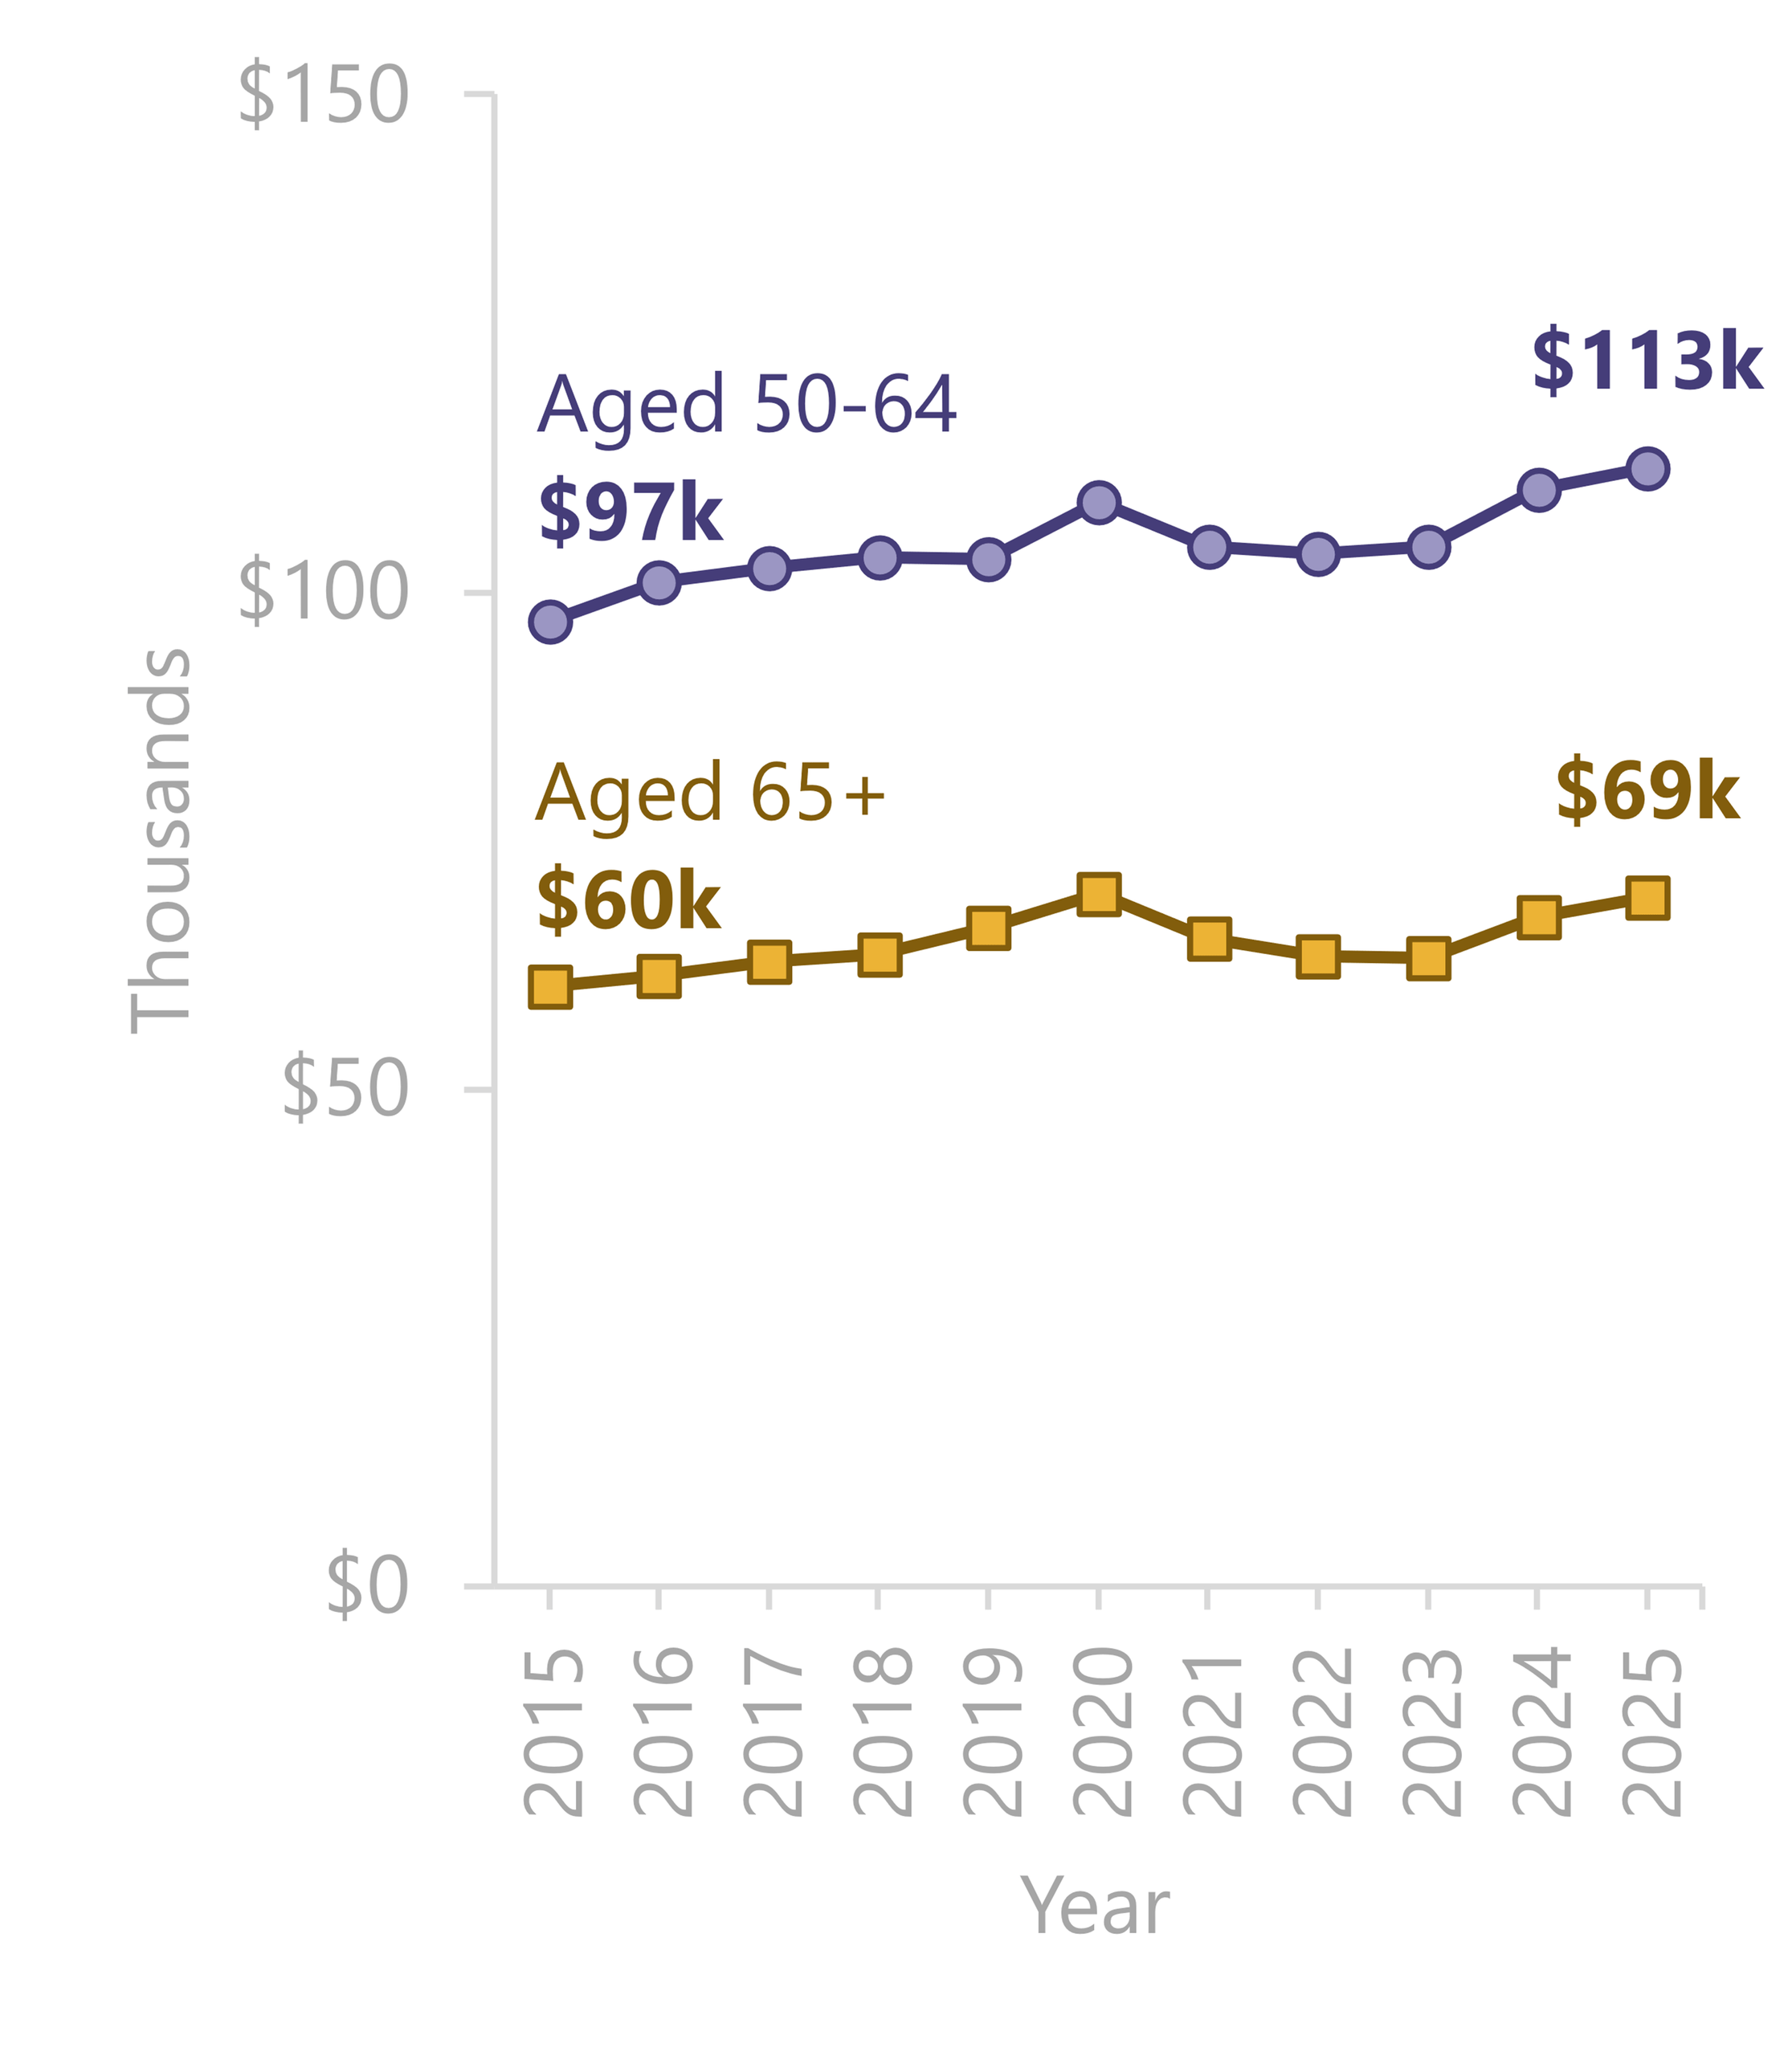
Figure 1b. Median Household Income by Age Group and Relationship Status, U.S. Adults Aged 50+, 2025
Source: CAF analysis of U.S. Census Bureau, Current Population Survey, Annual Social and Economic Supplement, 2015-2025 (IPUMS CPS)
Employment
Employment increased modestly among adults aged 50–64 between 2015 and 2025, whereas employment among adults aged 65+ remained about the same.
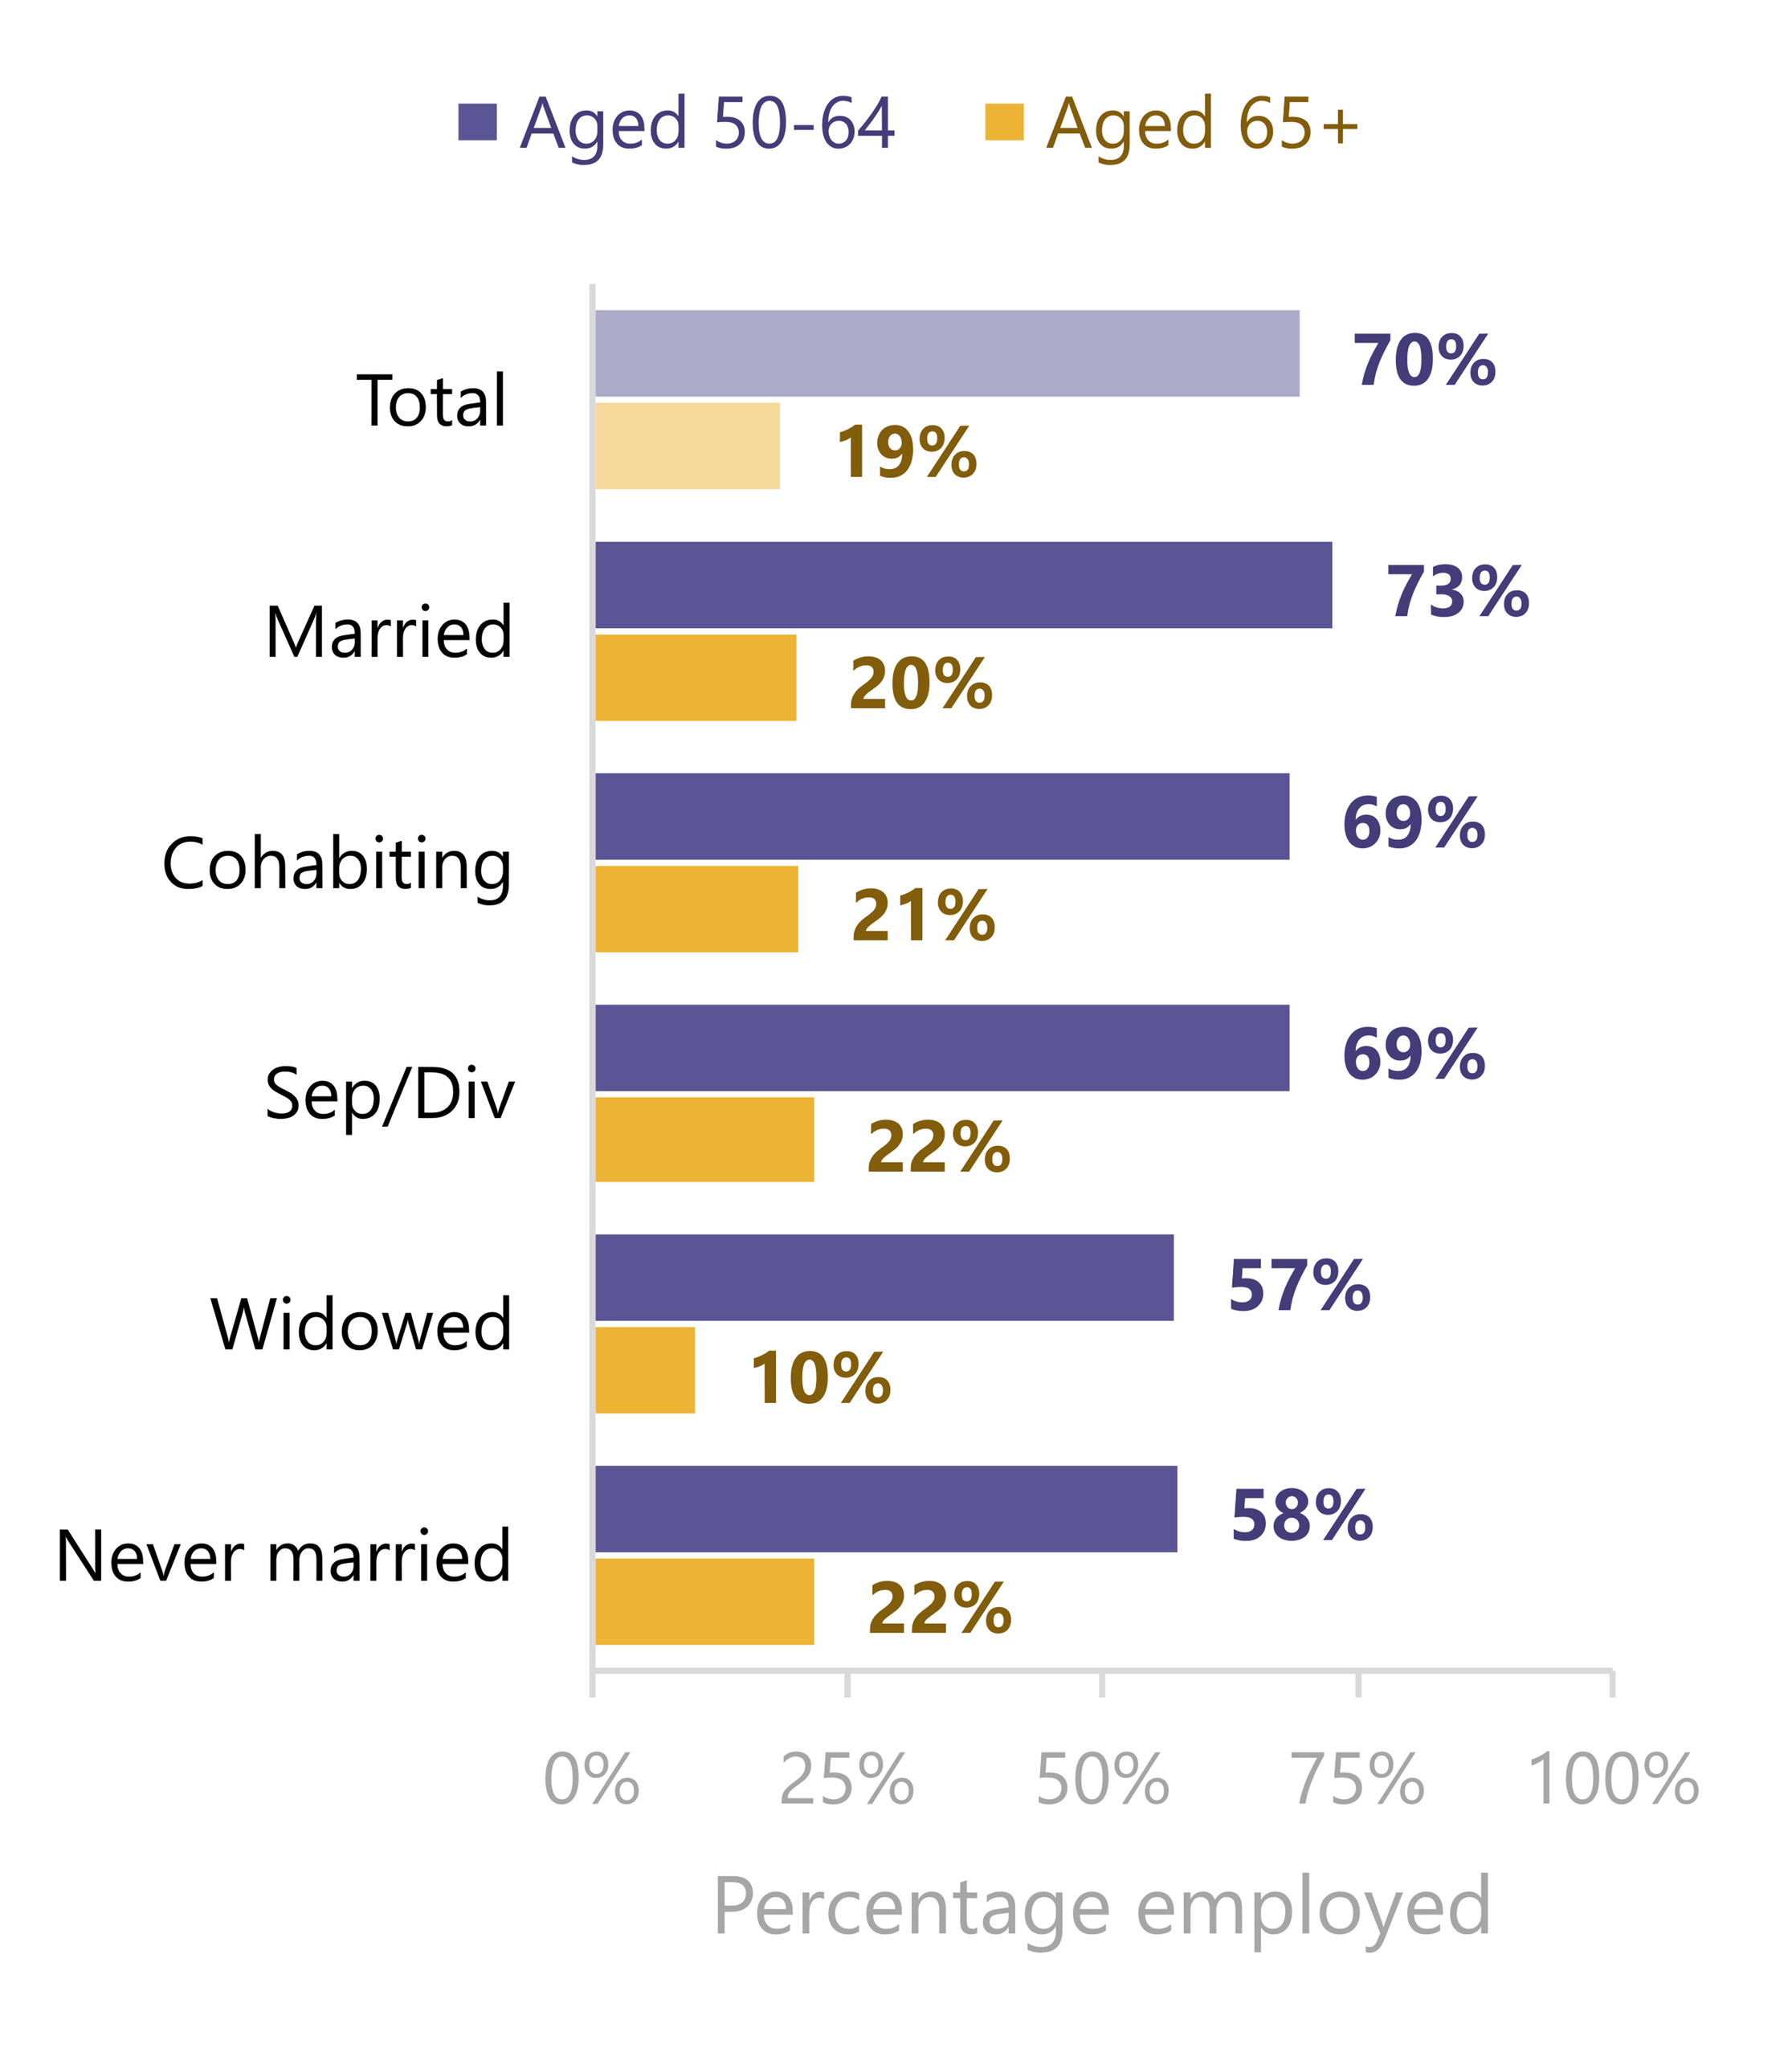
In 2025, employment among adults aged 65+ was similar across most relationship statuses (hovering around 20%), except for widowed adults, who had the lowest employment rate (10%).
Figure 2a. Trend in Employment by Age Group Status, U.S. Adults Aged 50+, 2015-2025
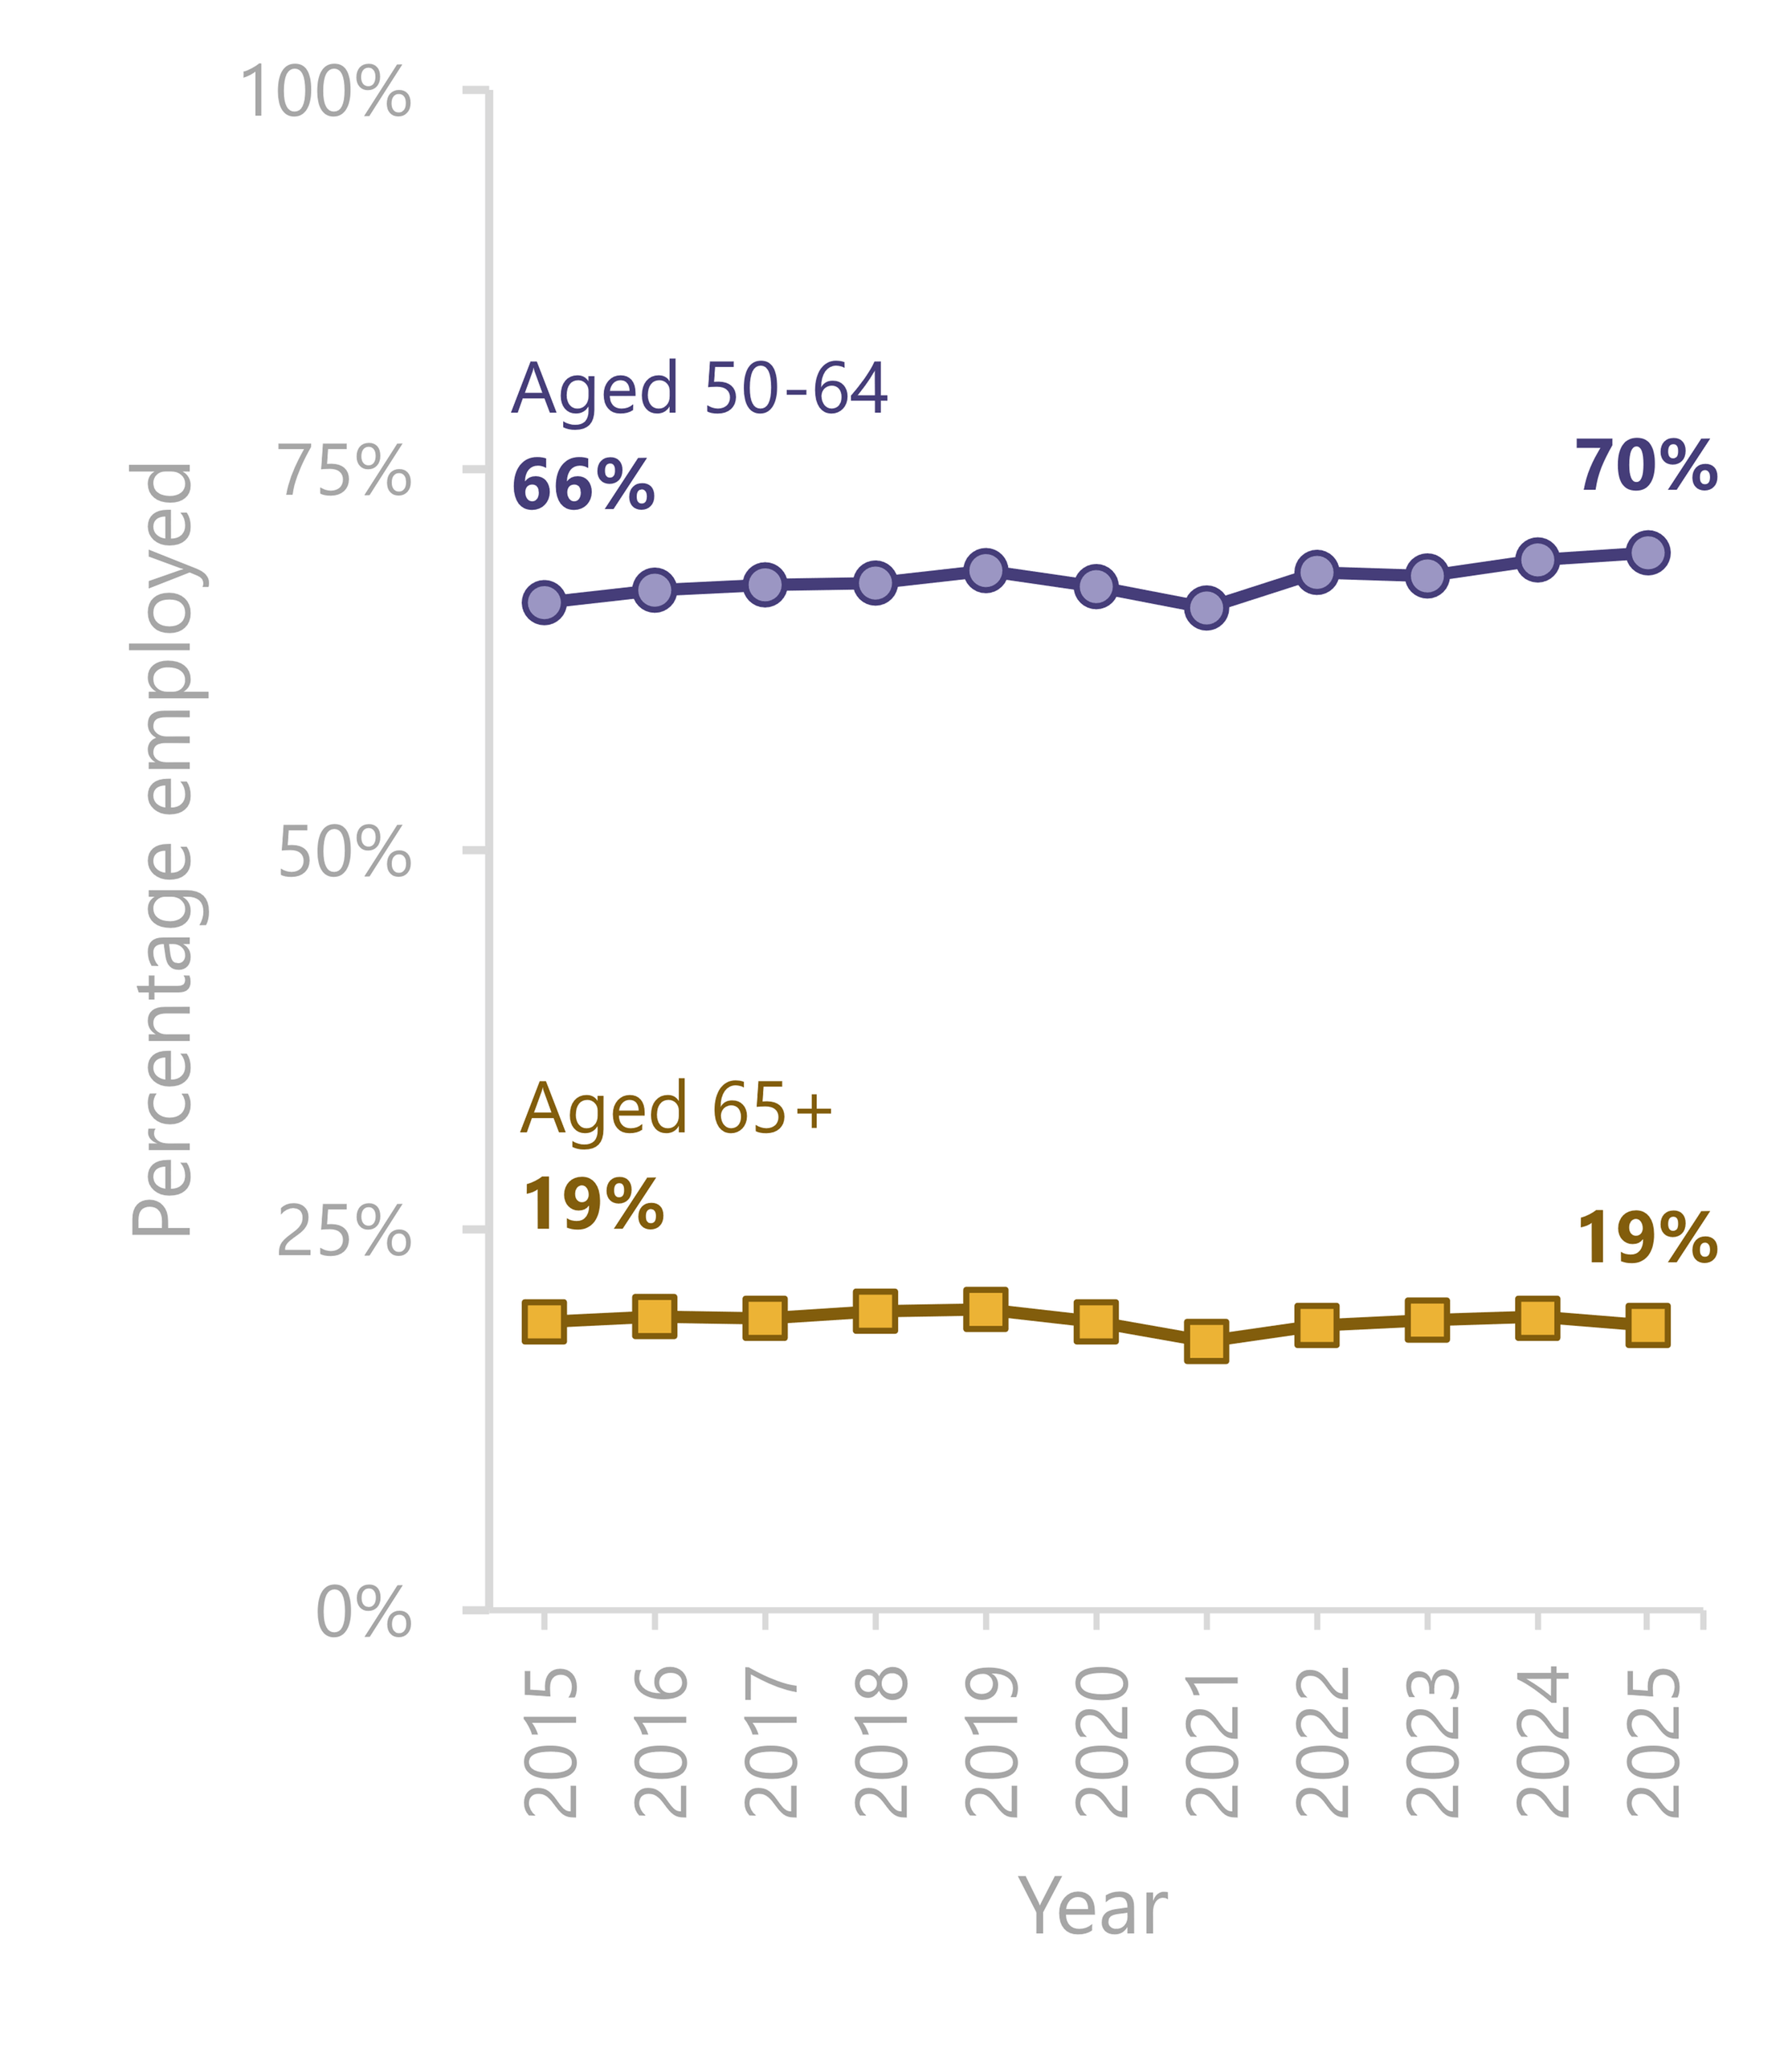
Figure 2b. Employment by Age Group and Relationship Status, U.S. Adults Aged 50+, 2025
Source: CAF analysis of U.S. Census Bureau, Current Population Survey, Annual Social and Economic Supplement, 2015-2025 (IPUMS CPS)
Homeownership Among Householders
Homeownership remained stable between 2015 and 2025, with more than three-fourths of adults aged 50–64 and about four-fifths of those aged 65+ owning their homes.
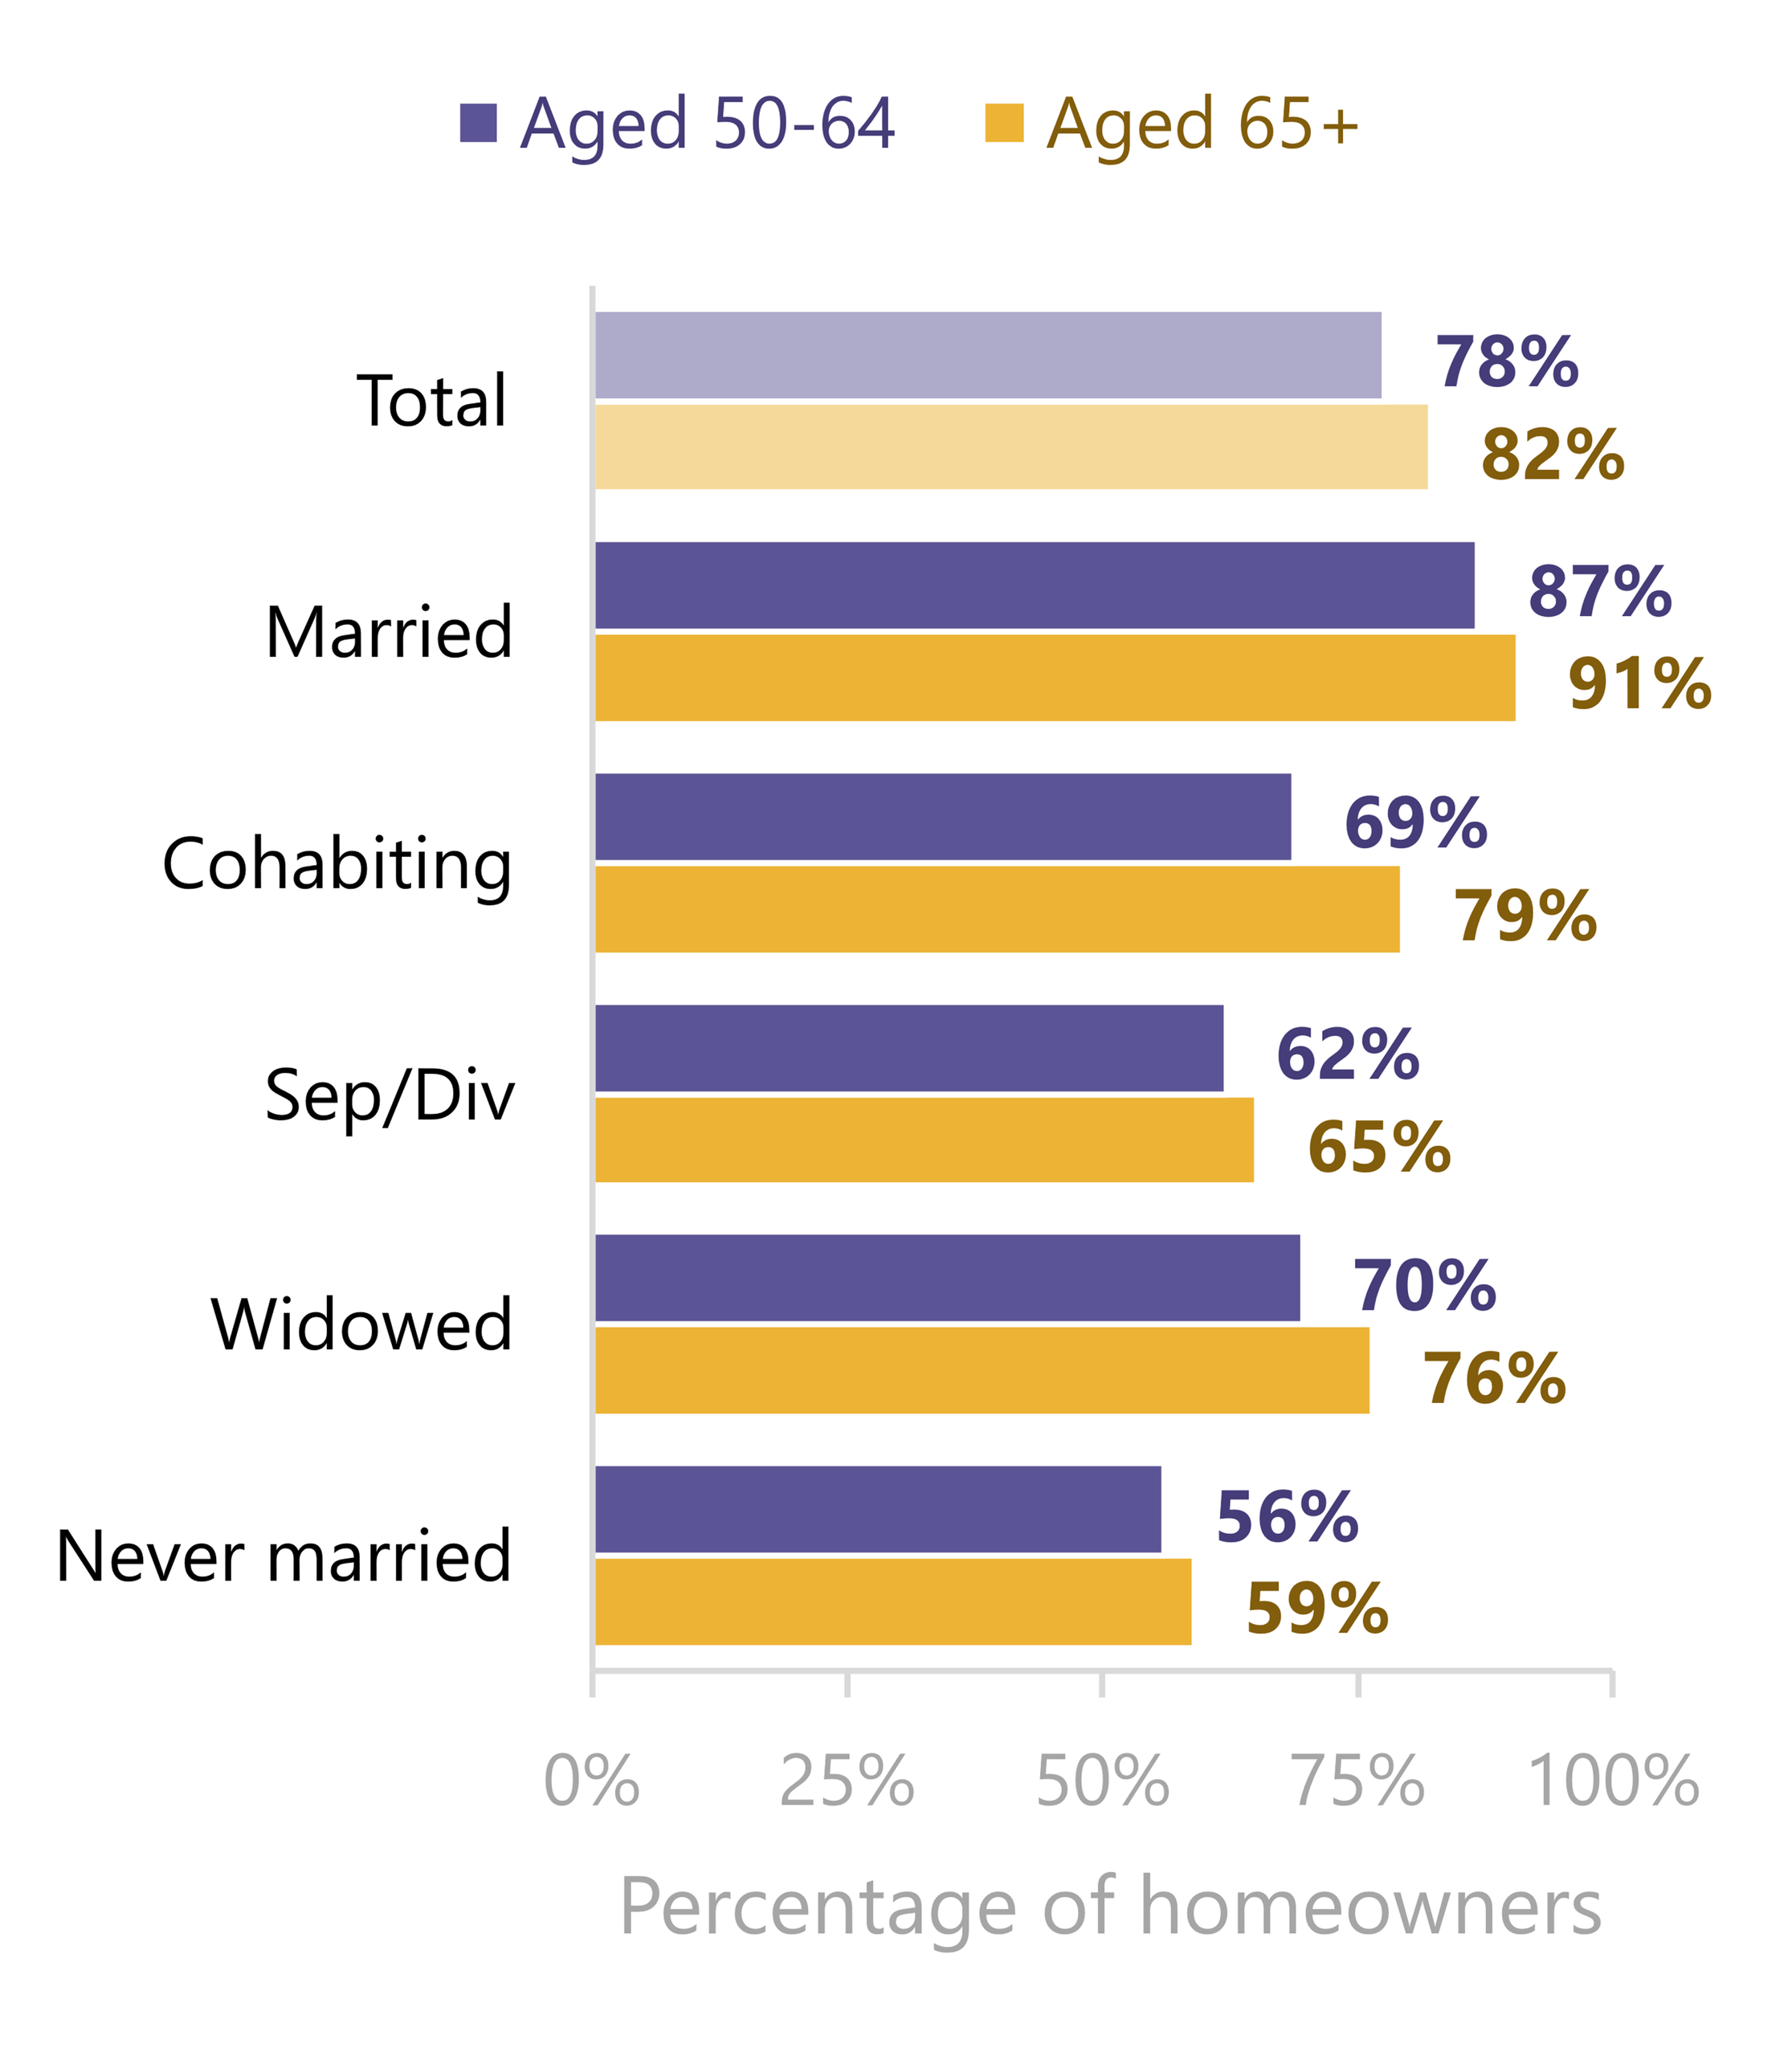
In 2025, homeownership was higher among adults aged 65+ than among those aged 50–64 across every relationship status. The largest age difference occurred among cohabitors (79% versus 69%).
Figure 3a. Trend in Homeownership by Age Group Status, U.S. Adults Aged 50+, 2015-2025
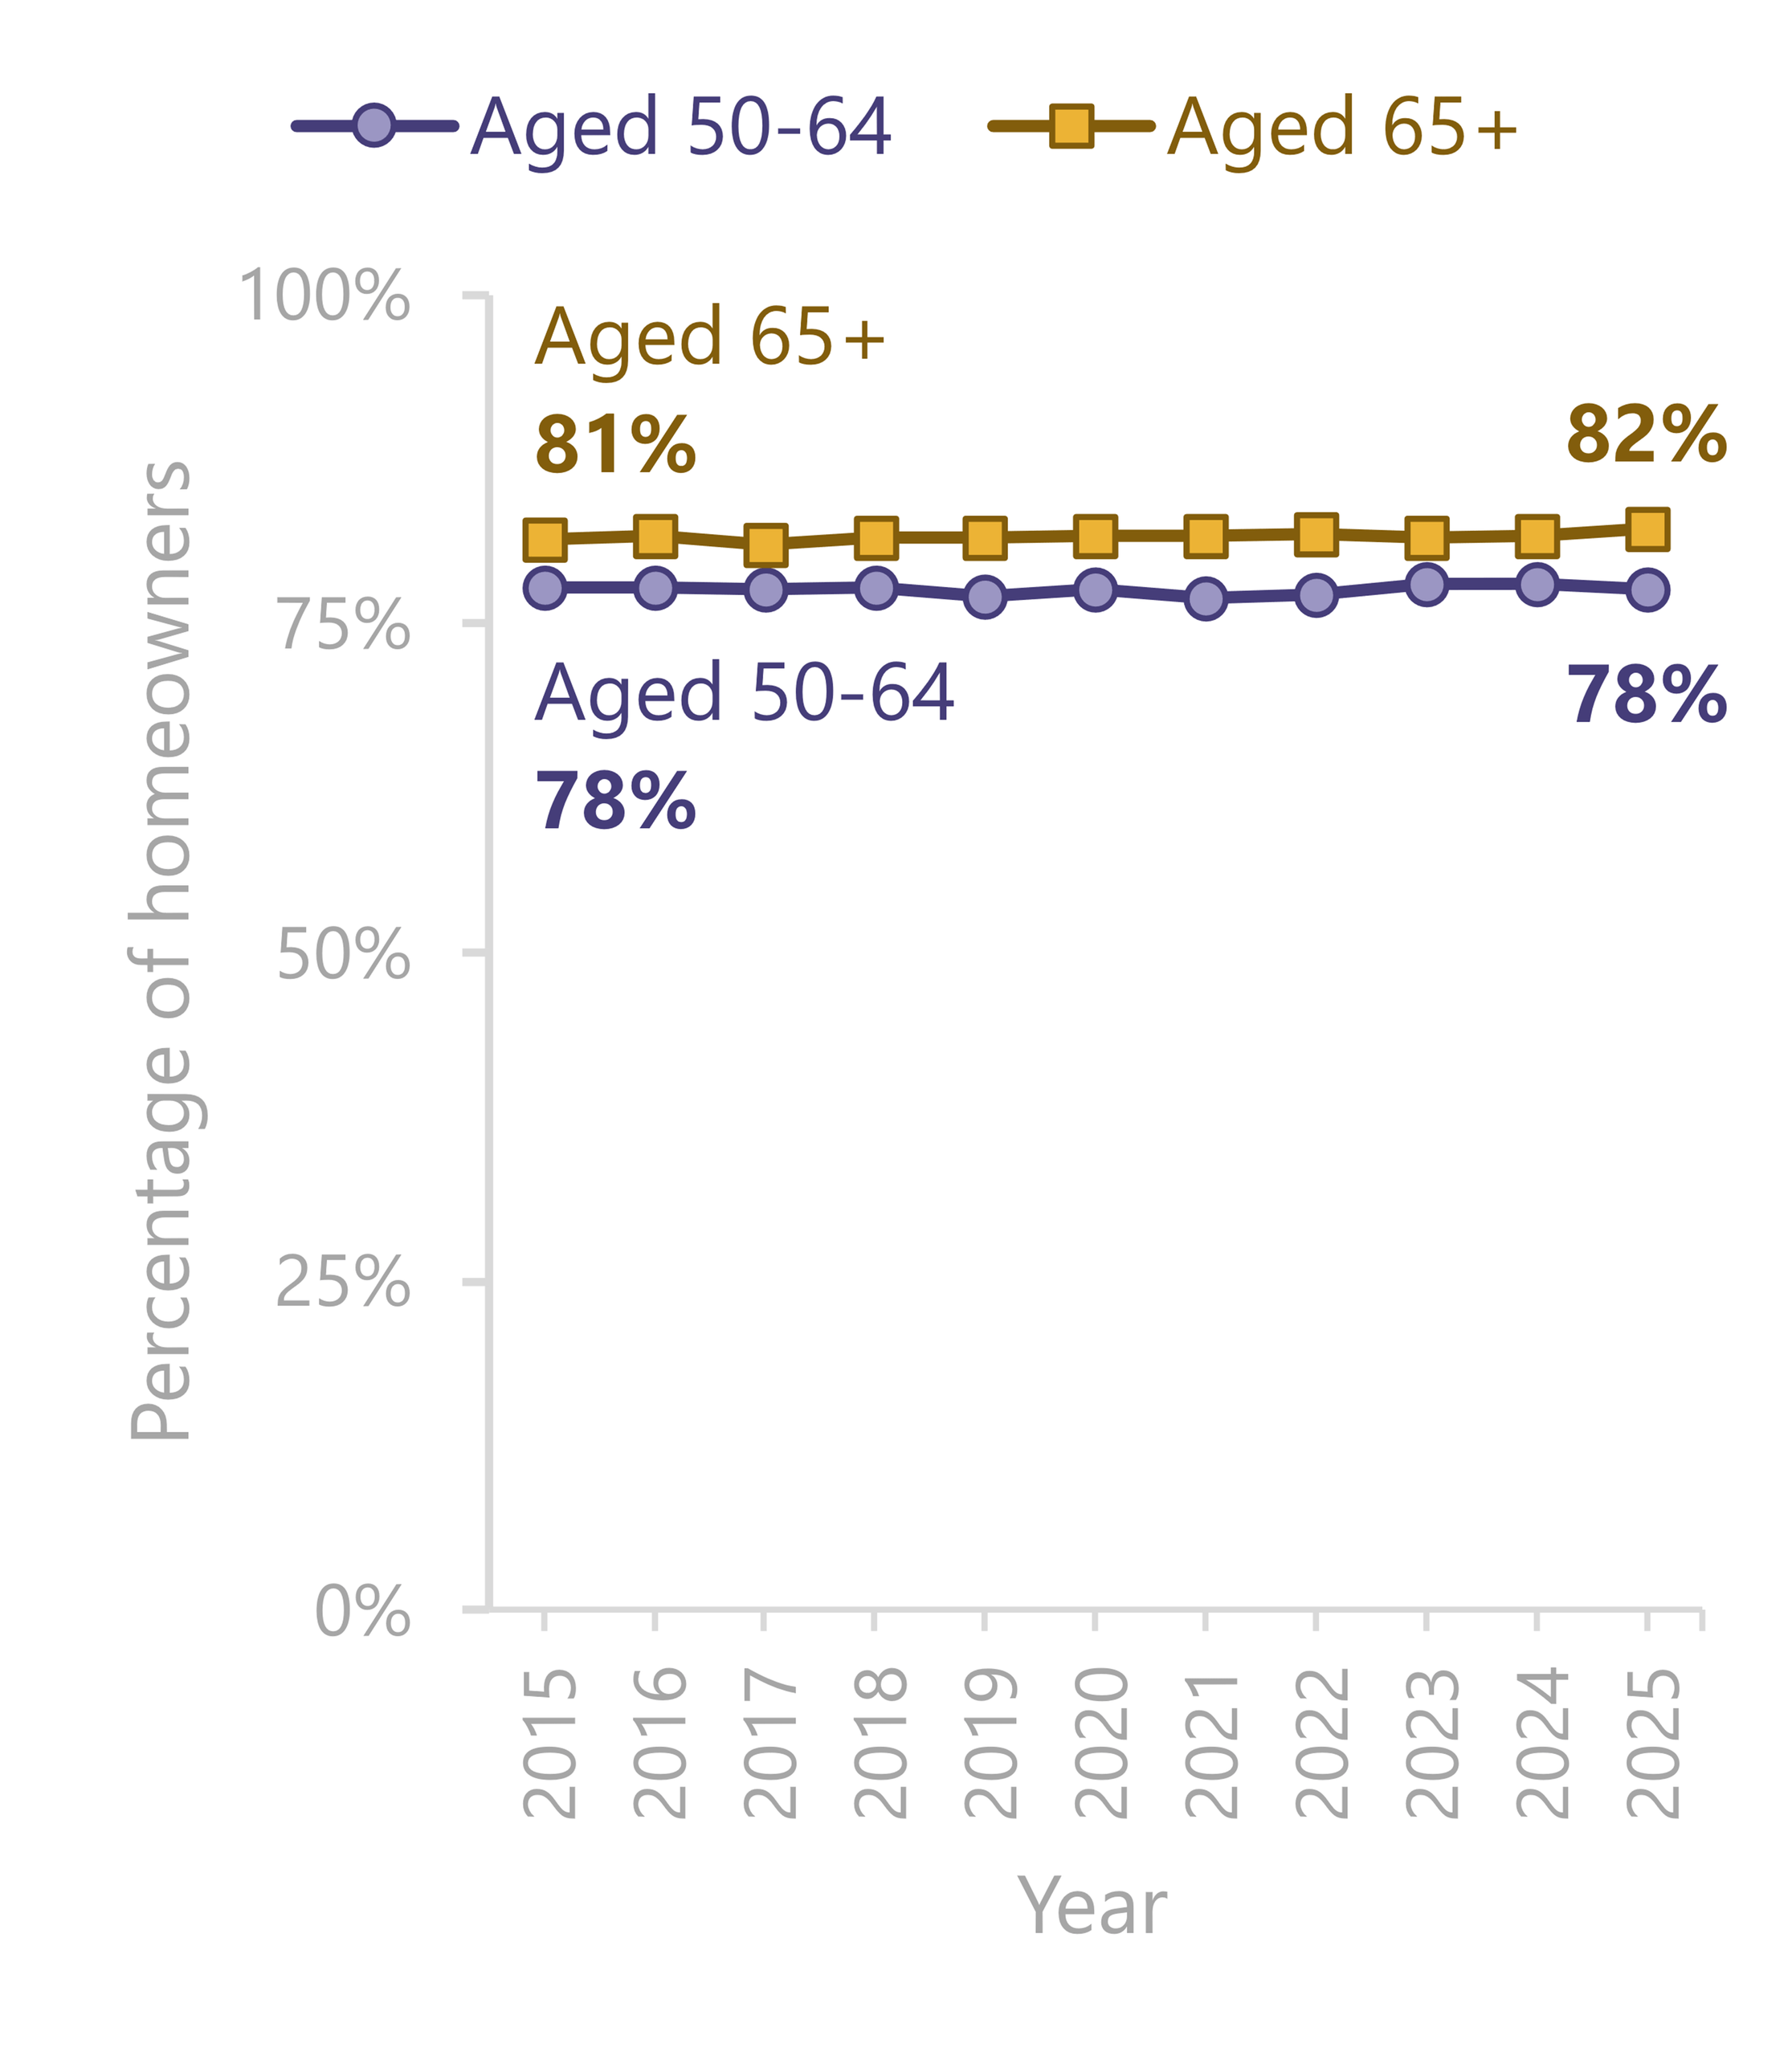
Figure 3b. Homeownership by Age Group and Relationship Status, U.S. Adults Aged 50+, 2025
Source: CAF analysis of U.S. Census Bureau, Current Population Survey, Annual Social and Economic Supplement, 2015-2025 (IPUMS CPS)
SNAP Receipt
SNAP receipt converged between adults aged 50–64 and those aged 65+ between 2015 and 2025.
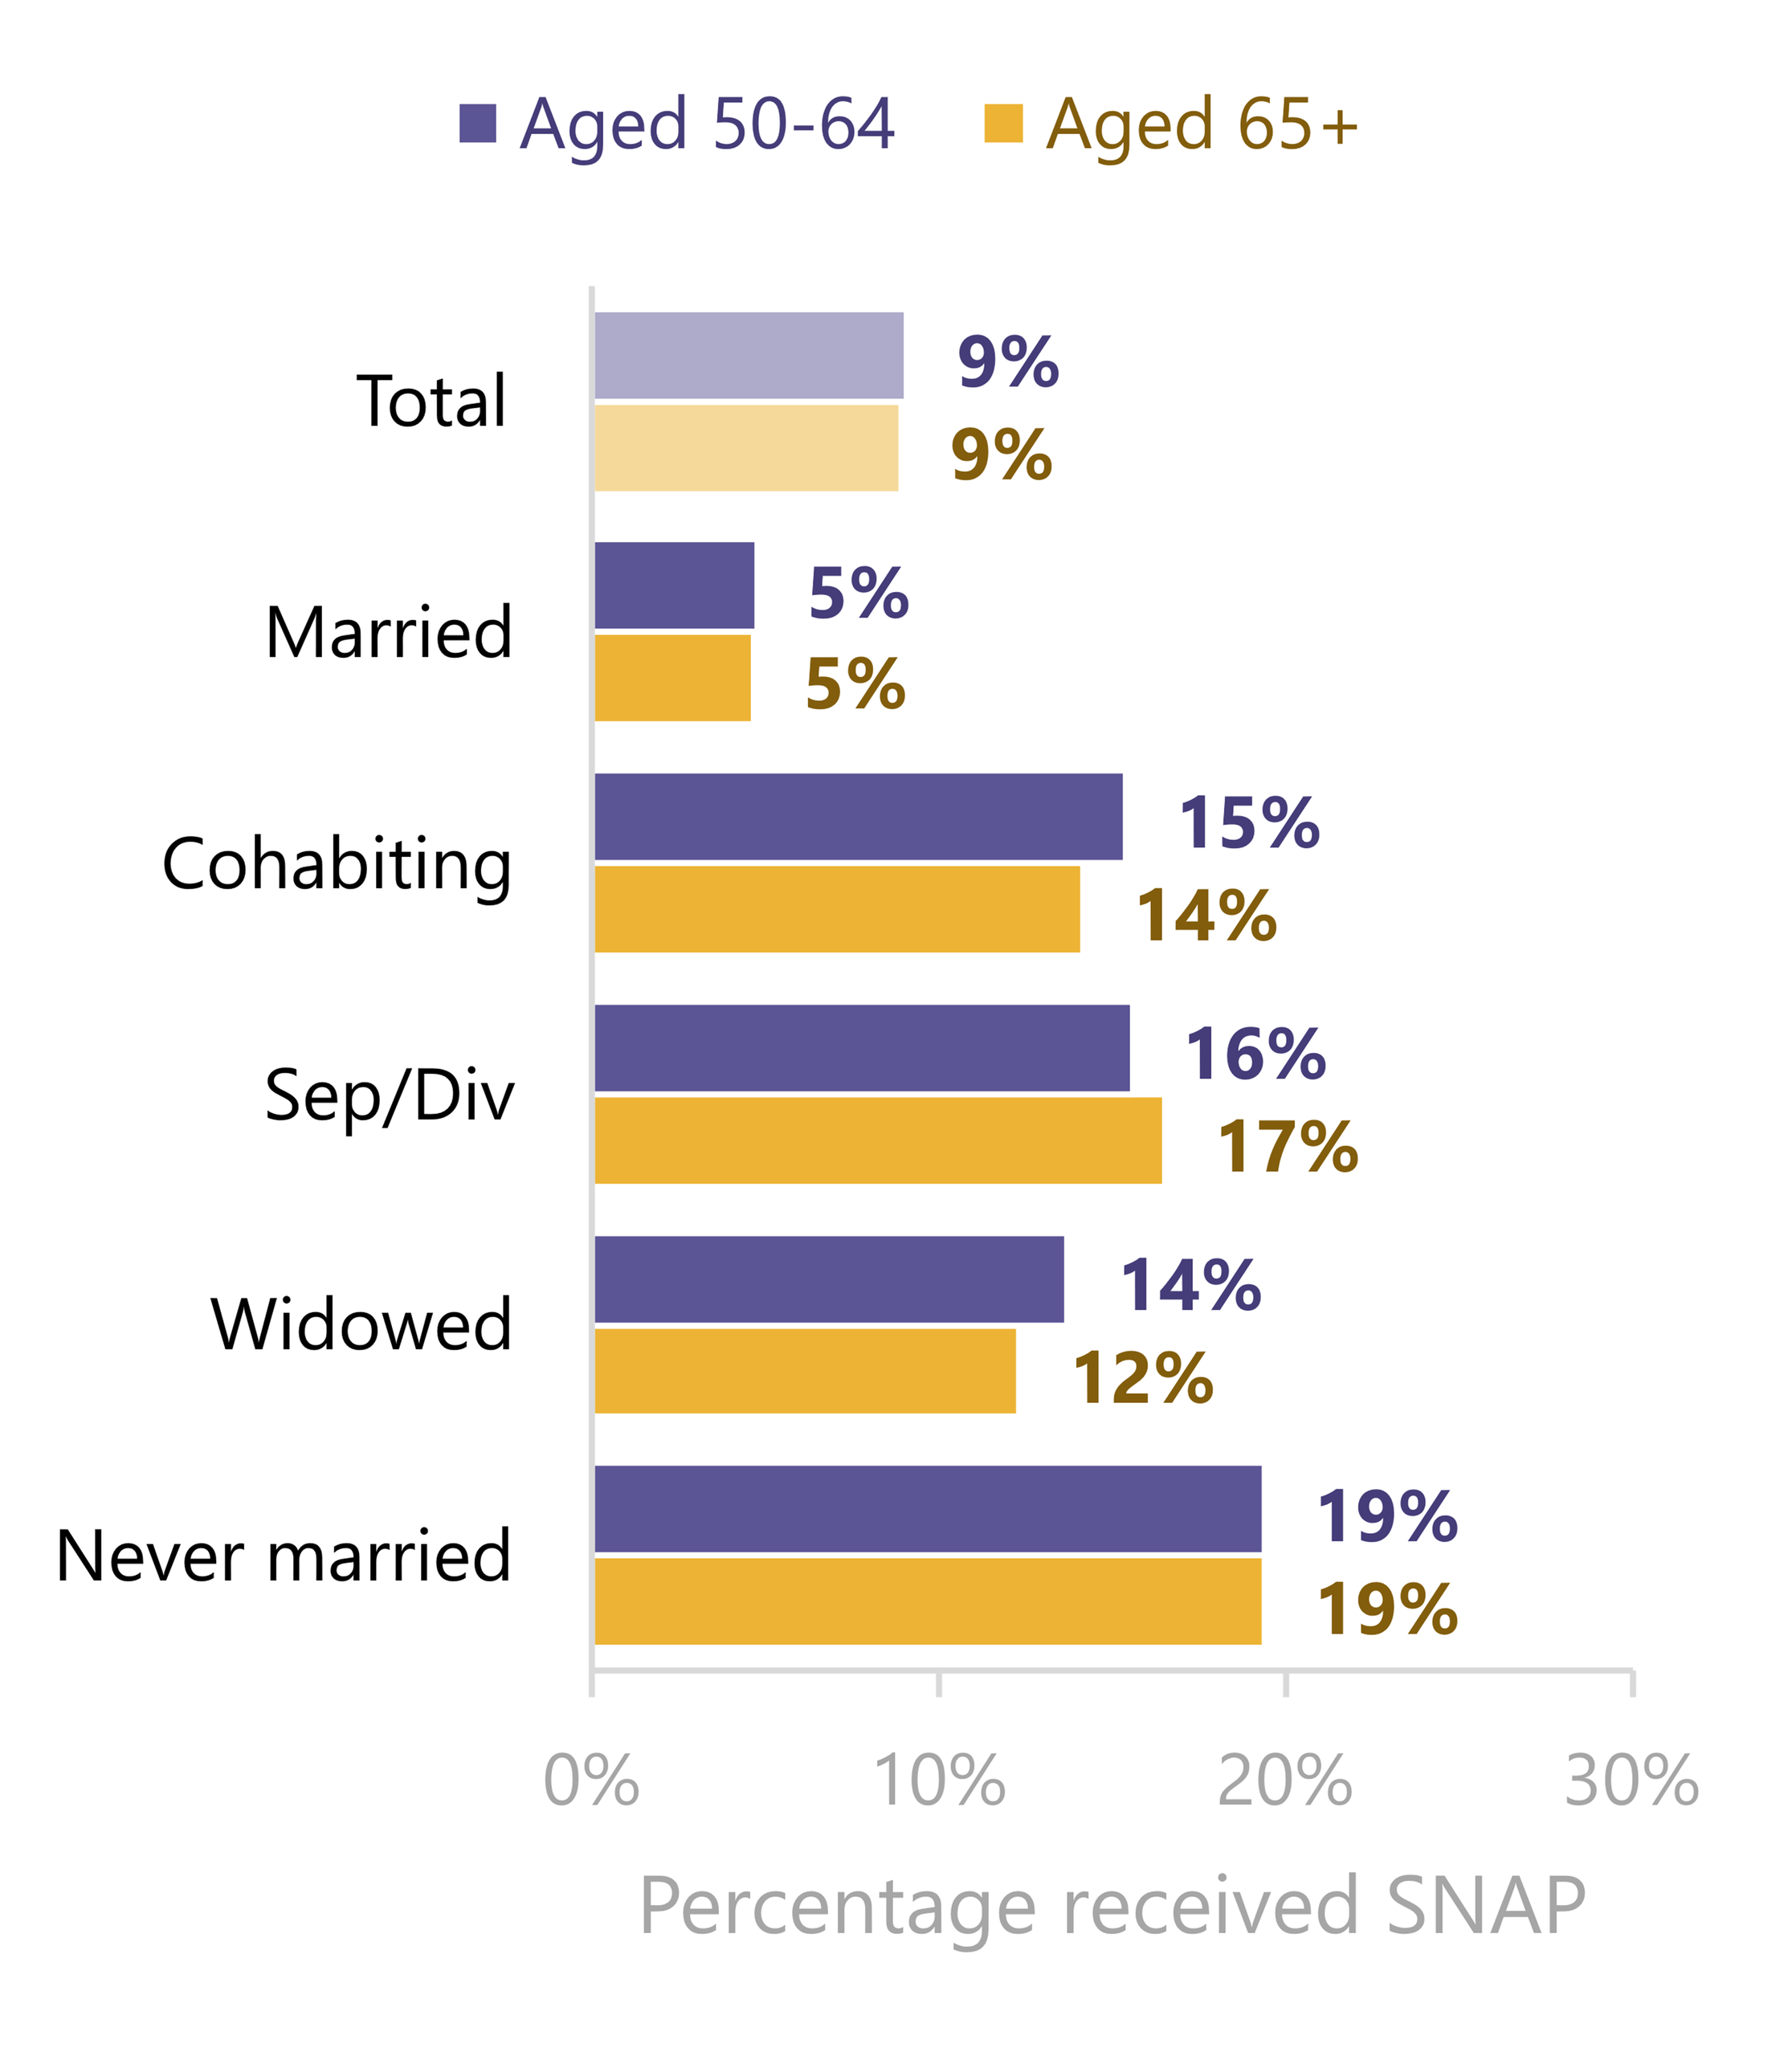
In 2025, SNAP receipt varied more by relationship status than by age. Receipt ranged from 5% among married adults to 19% among never married adults in both age groups.
Figure 4a. Trend in SNAP Receipt by Age Group Status, U.S. Adults Aged 50+, 2015-2025
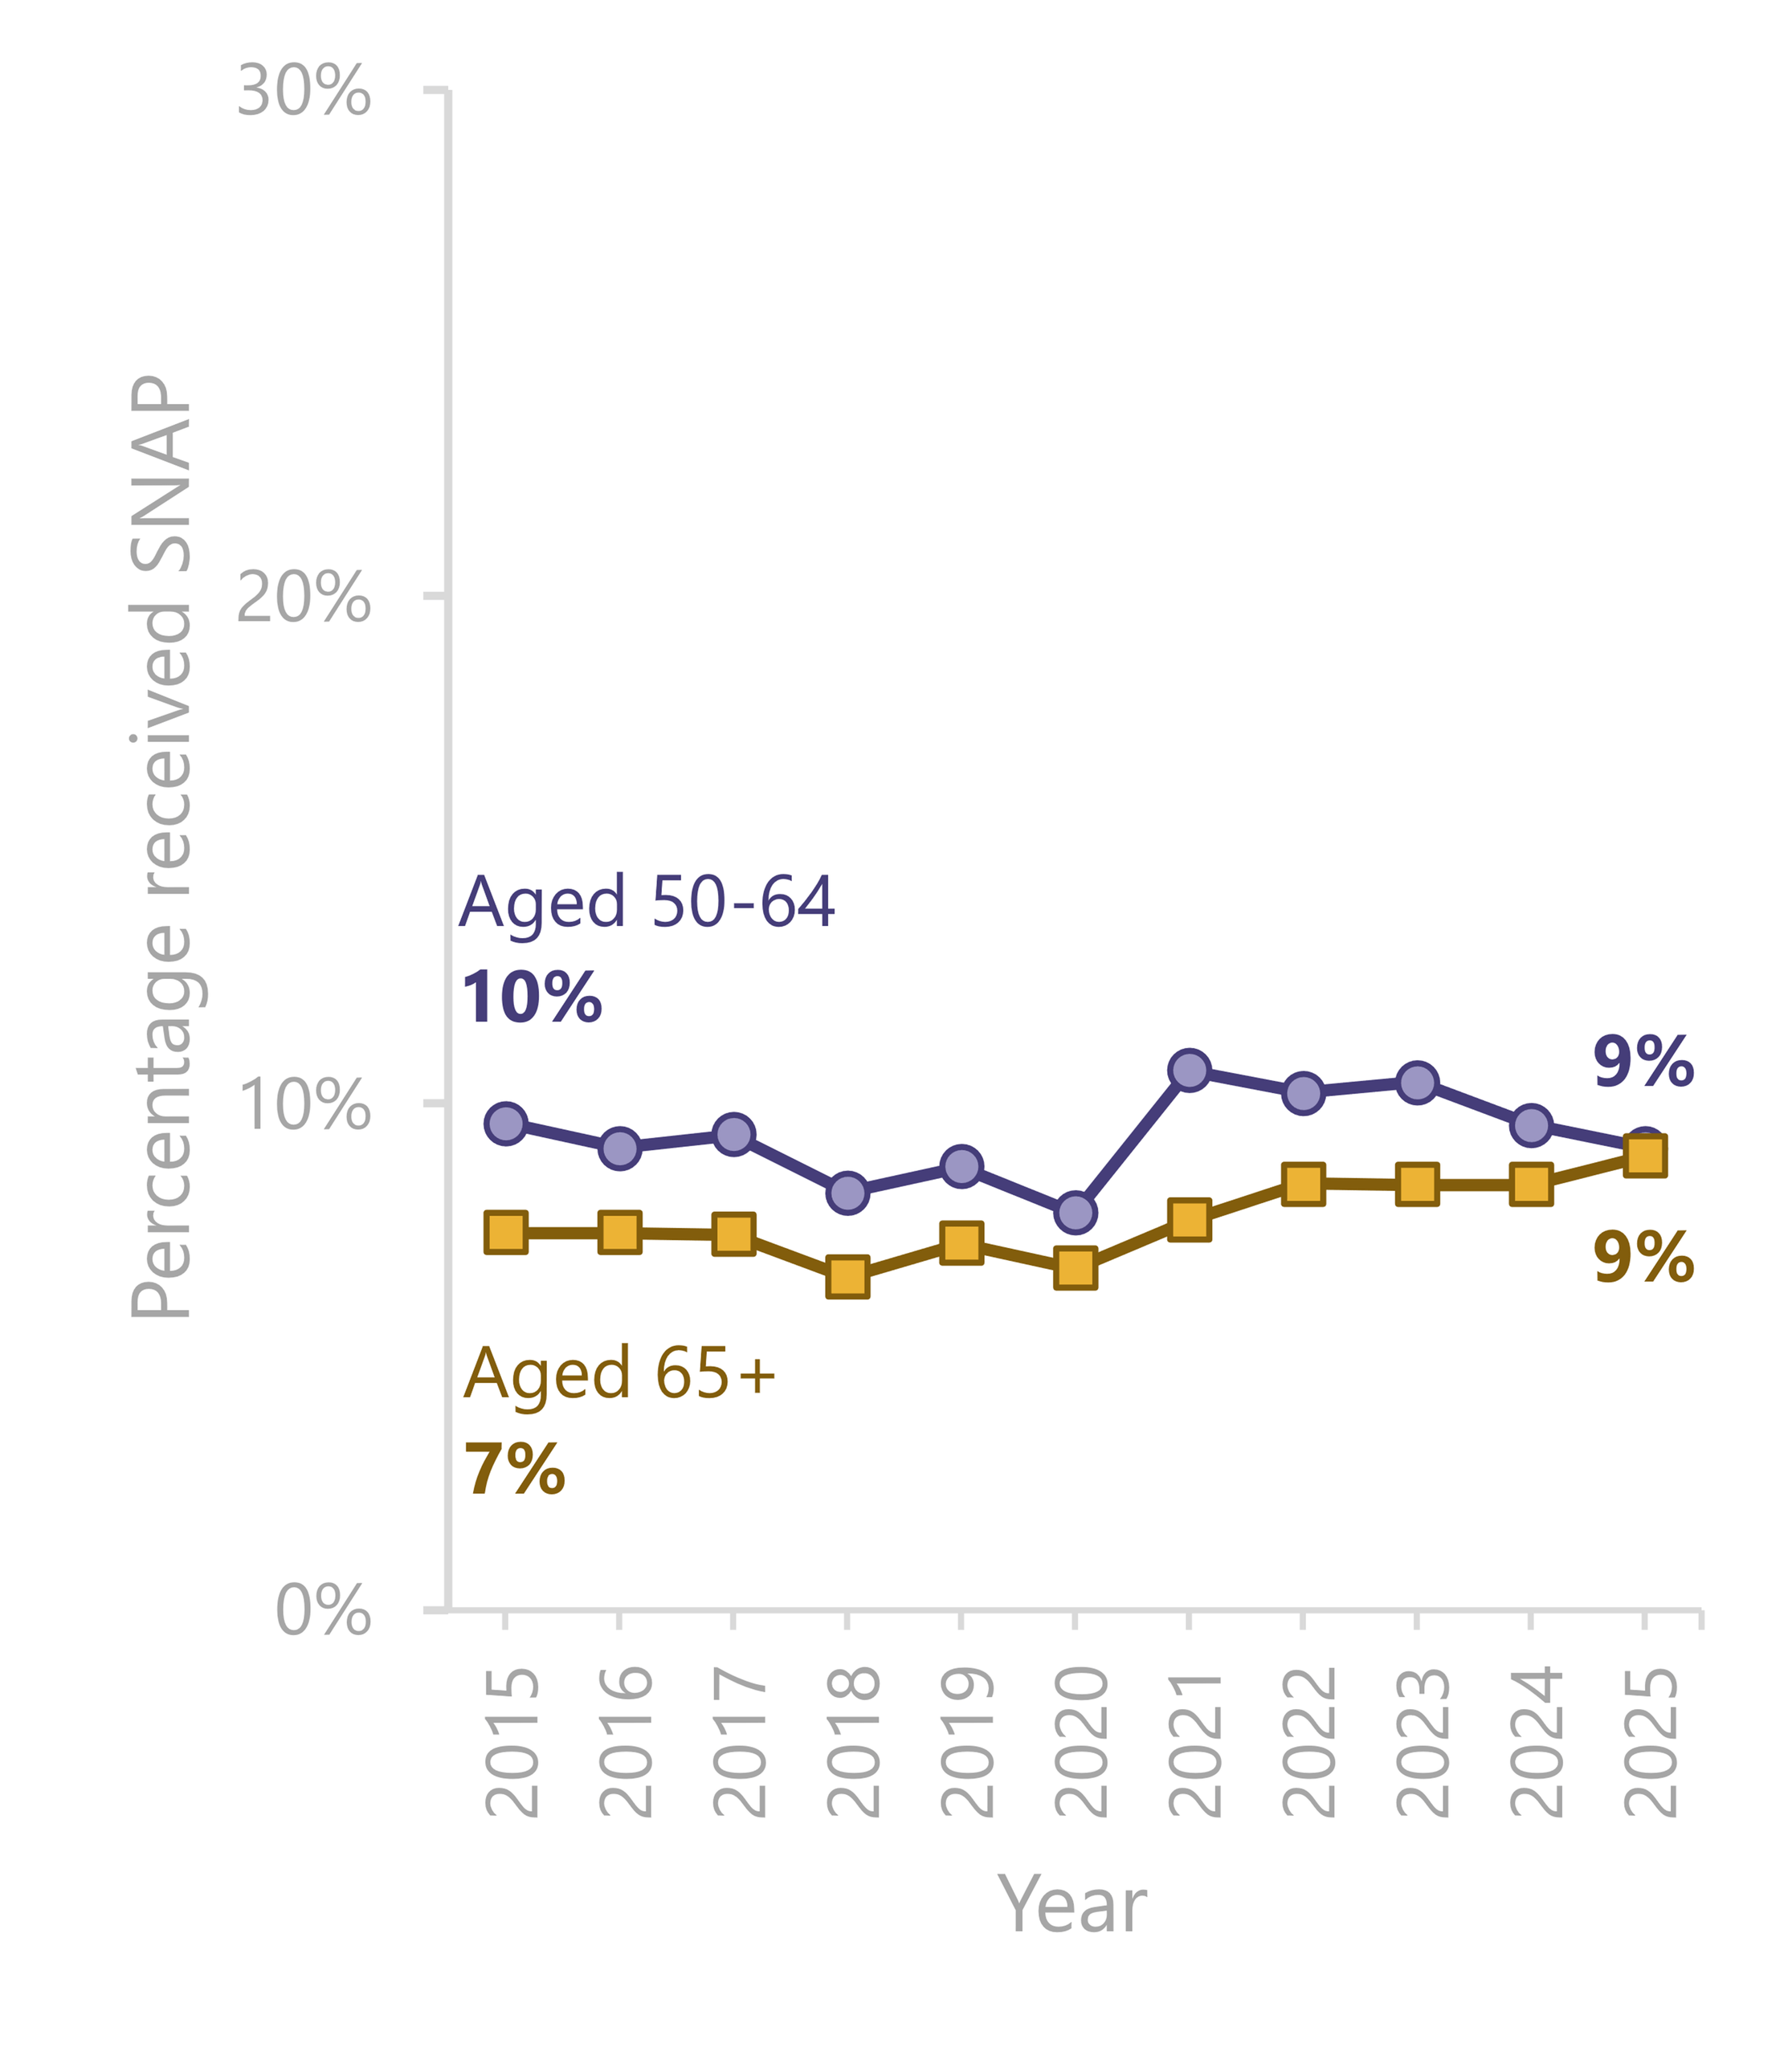
Figure 4b. SNAP Receipt by Age Group and Relationship Status, U.S. Adults Aged 50+, 2025
Source: CAF analysis of U.S. Census Bureau, Current Population Survey, Annual Social and Economic Supplement, 2015-2025 (IPUMS CPS)
Supplemental Poverty
Supplemental poverty[1] declined through 2021 before increasing among adults aged 65+, while remaining lower among adults aged 50–64 in 2025 than in 2015.
In 2025, supplemental poverty varied more by relationship status than by age. Poverty ranged from 8% among married adults aged 50–64 to 25% among never married adults aged 65+.
Figure 5a. Trend in Supplemental Poverty by Age Group Status, U.S. Adults Aged 50+, 2015-2025
Figure 5b. Supplemental Poverty by Age Group and Relationship Status, U.S. Adults Aged 50+, 2025
Source: CAF analysis of U.S. Census Bureau, Current Population Survey, Annual Social and Economic Supplement, 2015-2025 (IPUMS CPS)
[1] The Supplemental Poverty Measure (SPM) has been published by the Census Bureau since 2011 and provides a more comprehensive measure of economic hardship than the official poverty measure by accounting for taxes, government assistance, necessary expenses (such as work and medical costs), and differences in the cost of living when determining poverty status. It is released annually by the Census Bureau along with the official poverty rate. An infographic on how the Census Bureau measures poverty can be found here (U.S. Census Bureau, 2022). The latest Census Bureau report on Poverty in the United States (Shrider & Bijou, 2025) can be found here.
Data Source
Flood, S., King, M., Rodgers, R., Ruggles, S., Warren, J. R., Backman, D., Breton, E., Cooper, G., Rivera Drew, J. A., Richards, S., Van Riper, D., & Williams, K. C. W. (2025). IPUMS CPS: Version 13.0 [Data set]. IPUMS. https://doi.org/10.18128/D030.V13.0
References
Carr, D., Wang, L., & Smock, P. J. (2025). Do Social Security benefits rules perpetuate marital status and gender inequalities?. The Gerontologist, 65(9), gnaf158. https://doi.org/10.1093/geront/gnaf158
Shrider, E. A., & Bijou, C. (2025, September). Poverty in the United States: 2024 (Current Population Reports, P60-287). U.S. Census Bureau. U.S. Government Publishing Office. https://www2.census.gov/library/publications/2025/demo/p60-287.pdf
U.S. Census Bureau. (2022). How the Census Bureau measures poverty [Infographic]. https://www.census.gov/library/visualizations/2021/demo/poverty_measure-how.html
Suggested Citation
Westrick-Payne, K. K., & Brown, S. L. (2026). Economic well-being by age and relationship status among U.S. adults aged 50+, 2024. An Aging Family Portrait, AFP-26-05. Bowling Green, OH: Center for Aging Families. https://doi.org/10.25035/caf/afp-26-05
Research reported in this publication was supported by the National Institute on Aging of the National Institutes of Health under award number P30AG096979. The content is solely the responsibility of the authors and does not necessarily represent the official views of the National Institutes of Health.
Updated: 08/10/2026 03:47PM