County-Level Marriage & Divorce Data, 2010
Project Description
The National Center for Family & Marriage Research with the Center for Family & Demographic Research present county-level marriage and divorce counts for over 3,000 counties in the United States for the year 2010.
Suggested Data Citation:
BGSU Marriage and Divorce Data Compass (2016). "County-level marriage and divorce, 2010 [Data File]." Retrieved from http://www.bgsu.edu/ncfmr/resources/data/original-data/county-level-marriage-divorce-data-2010.html
Funding
These data are from work supported by the National Institutes of Health under Grant No. 5R03HD078653 to Wendy D. Manning at Bowling Green State University. This research was also supported in part by the Center for Family and Demographic Research, Bowling Green State University, which has core funding from the Eunice Kennedy Shriver National Institute of Child Health and Human Development (P2CHD050959).
Data and Documentation
Machine Readable Files
GIS Boundary Files
The county-level marriage and divorce counts along with GIS compatible boundary files and associated data notes are provided via the National Historical Geographic Information System (NHGIS).
Marriage and Divorce Data Sources & Notes
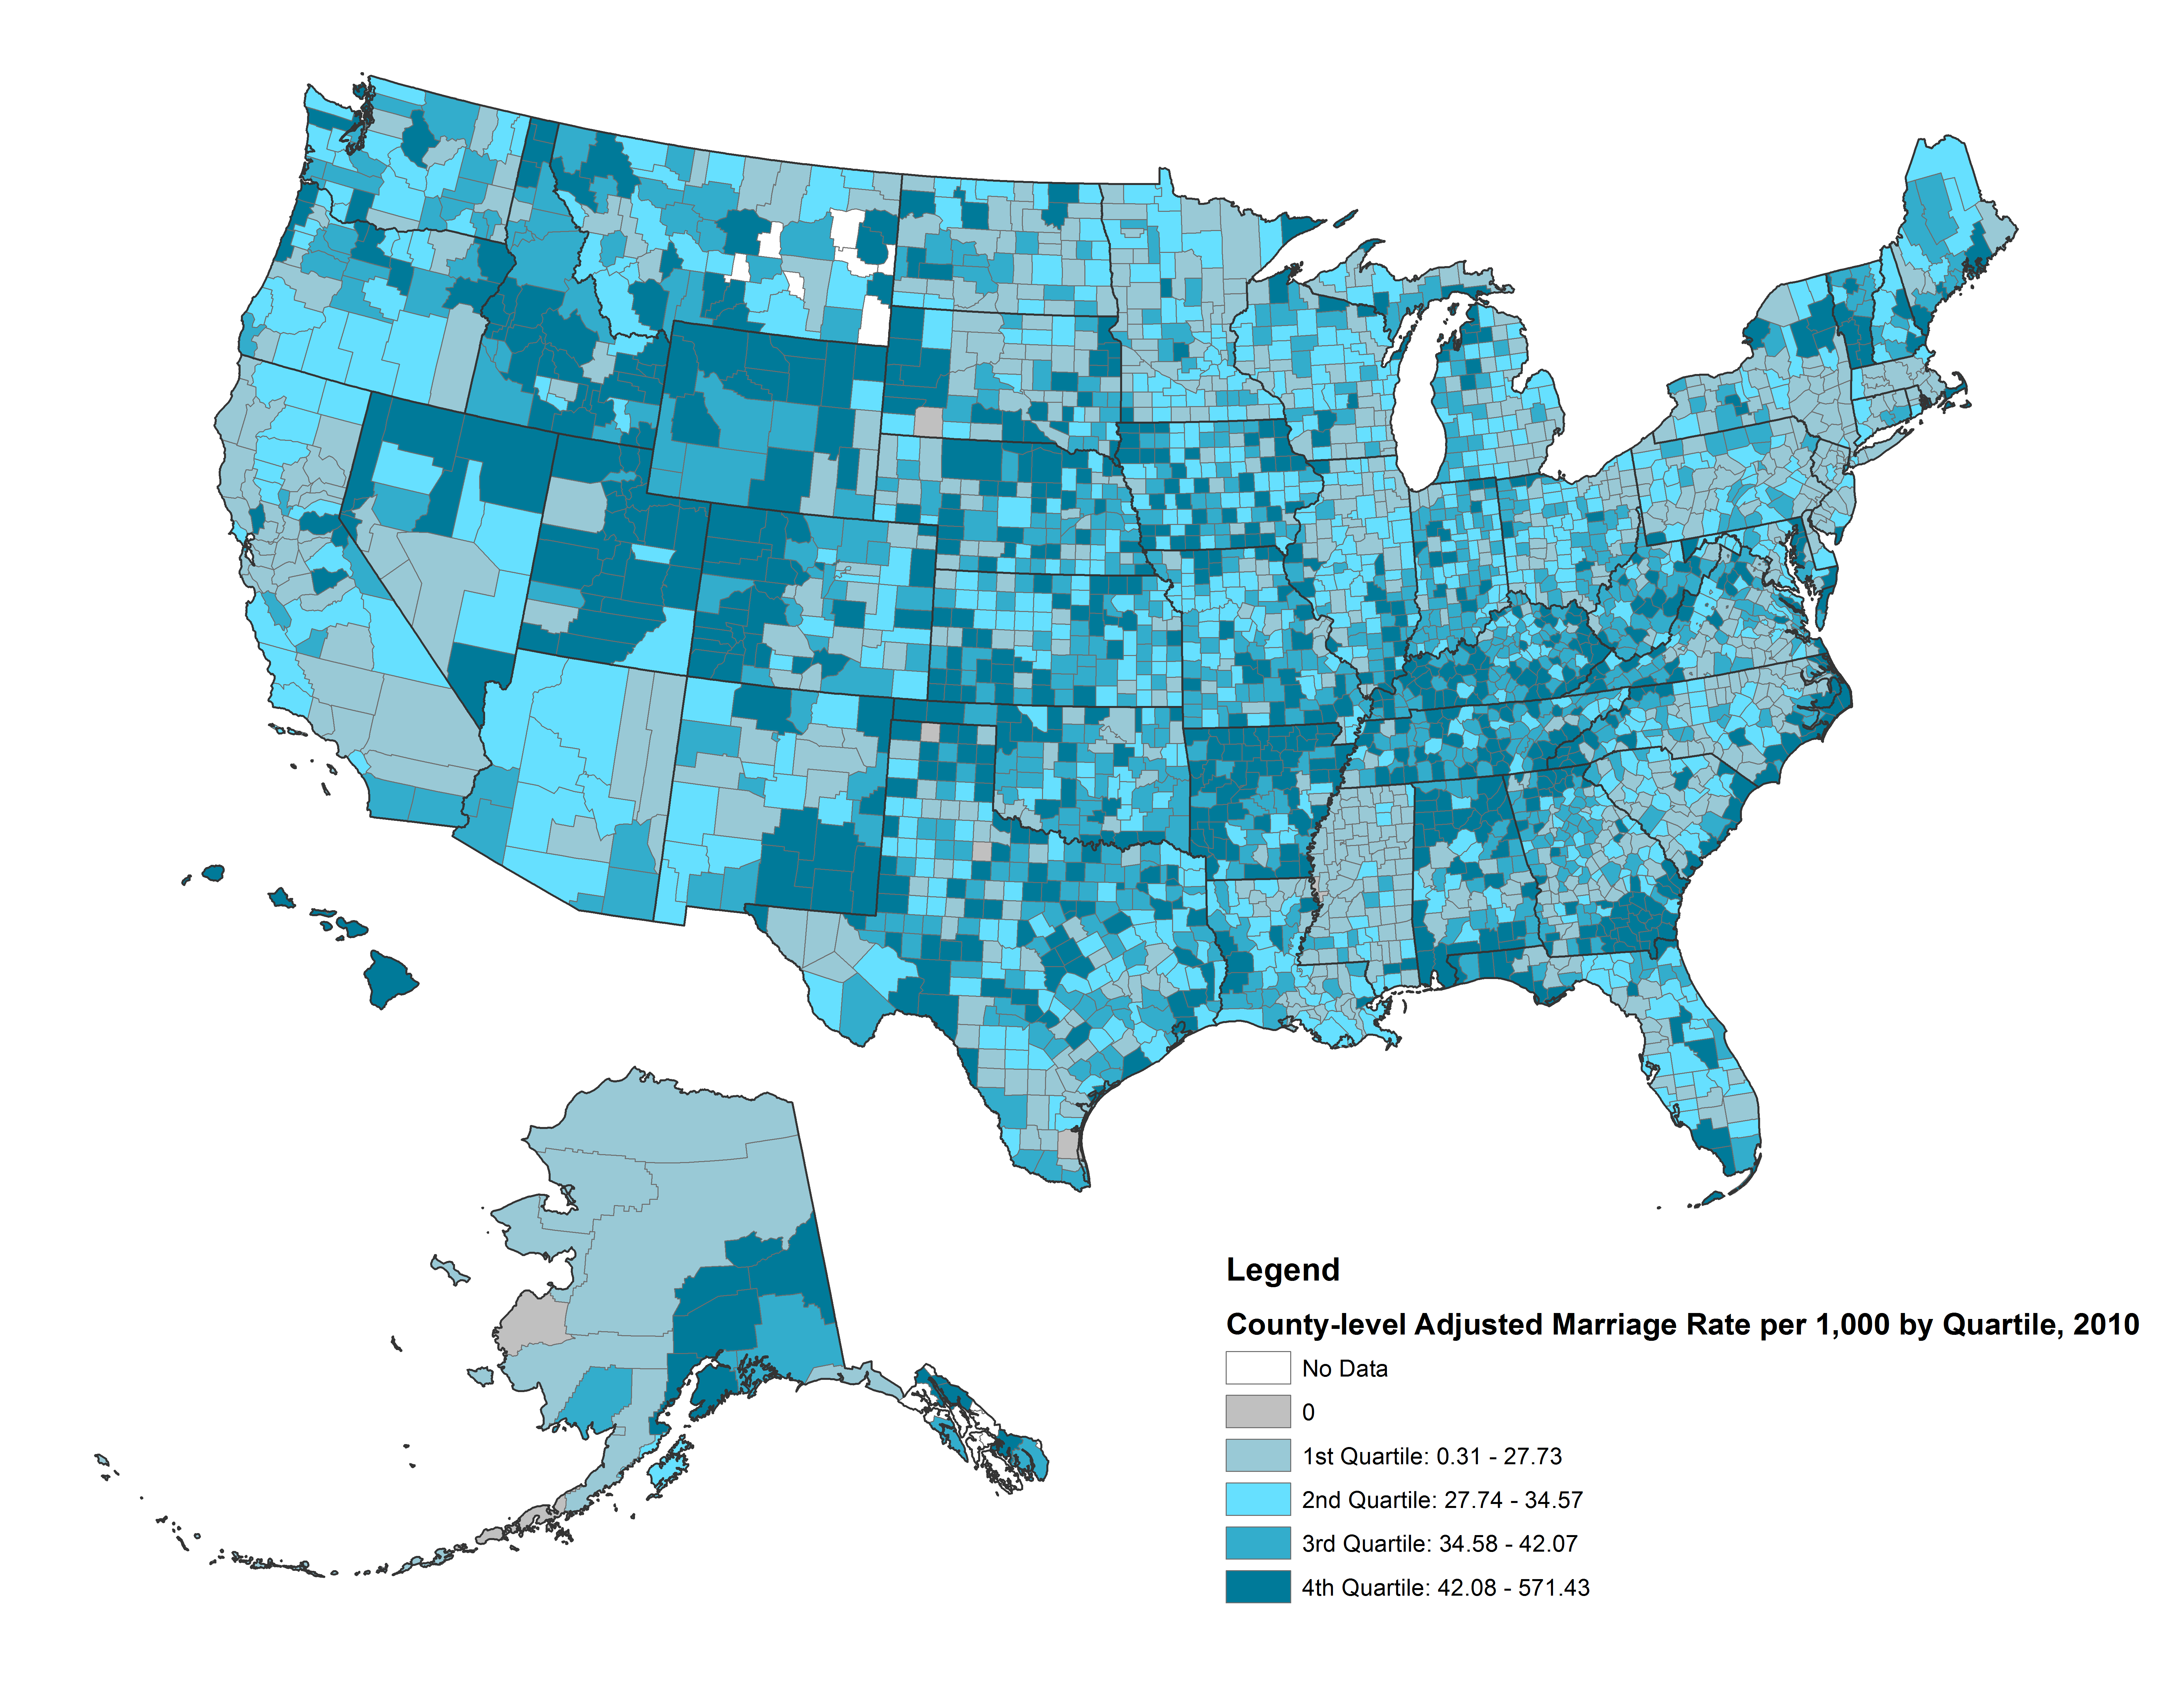
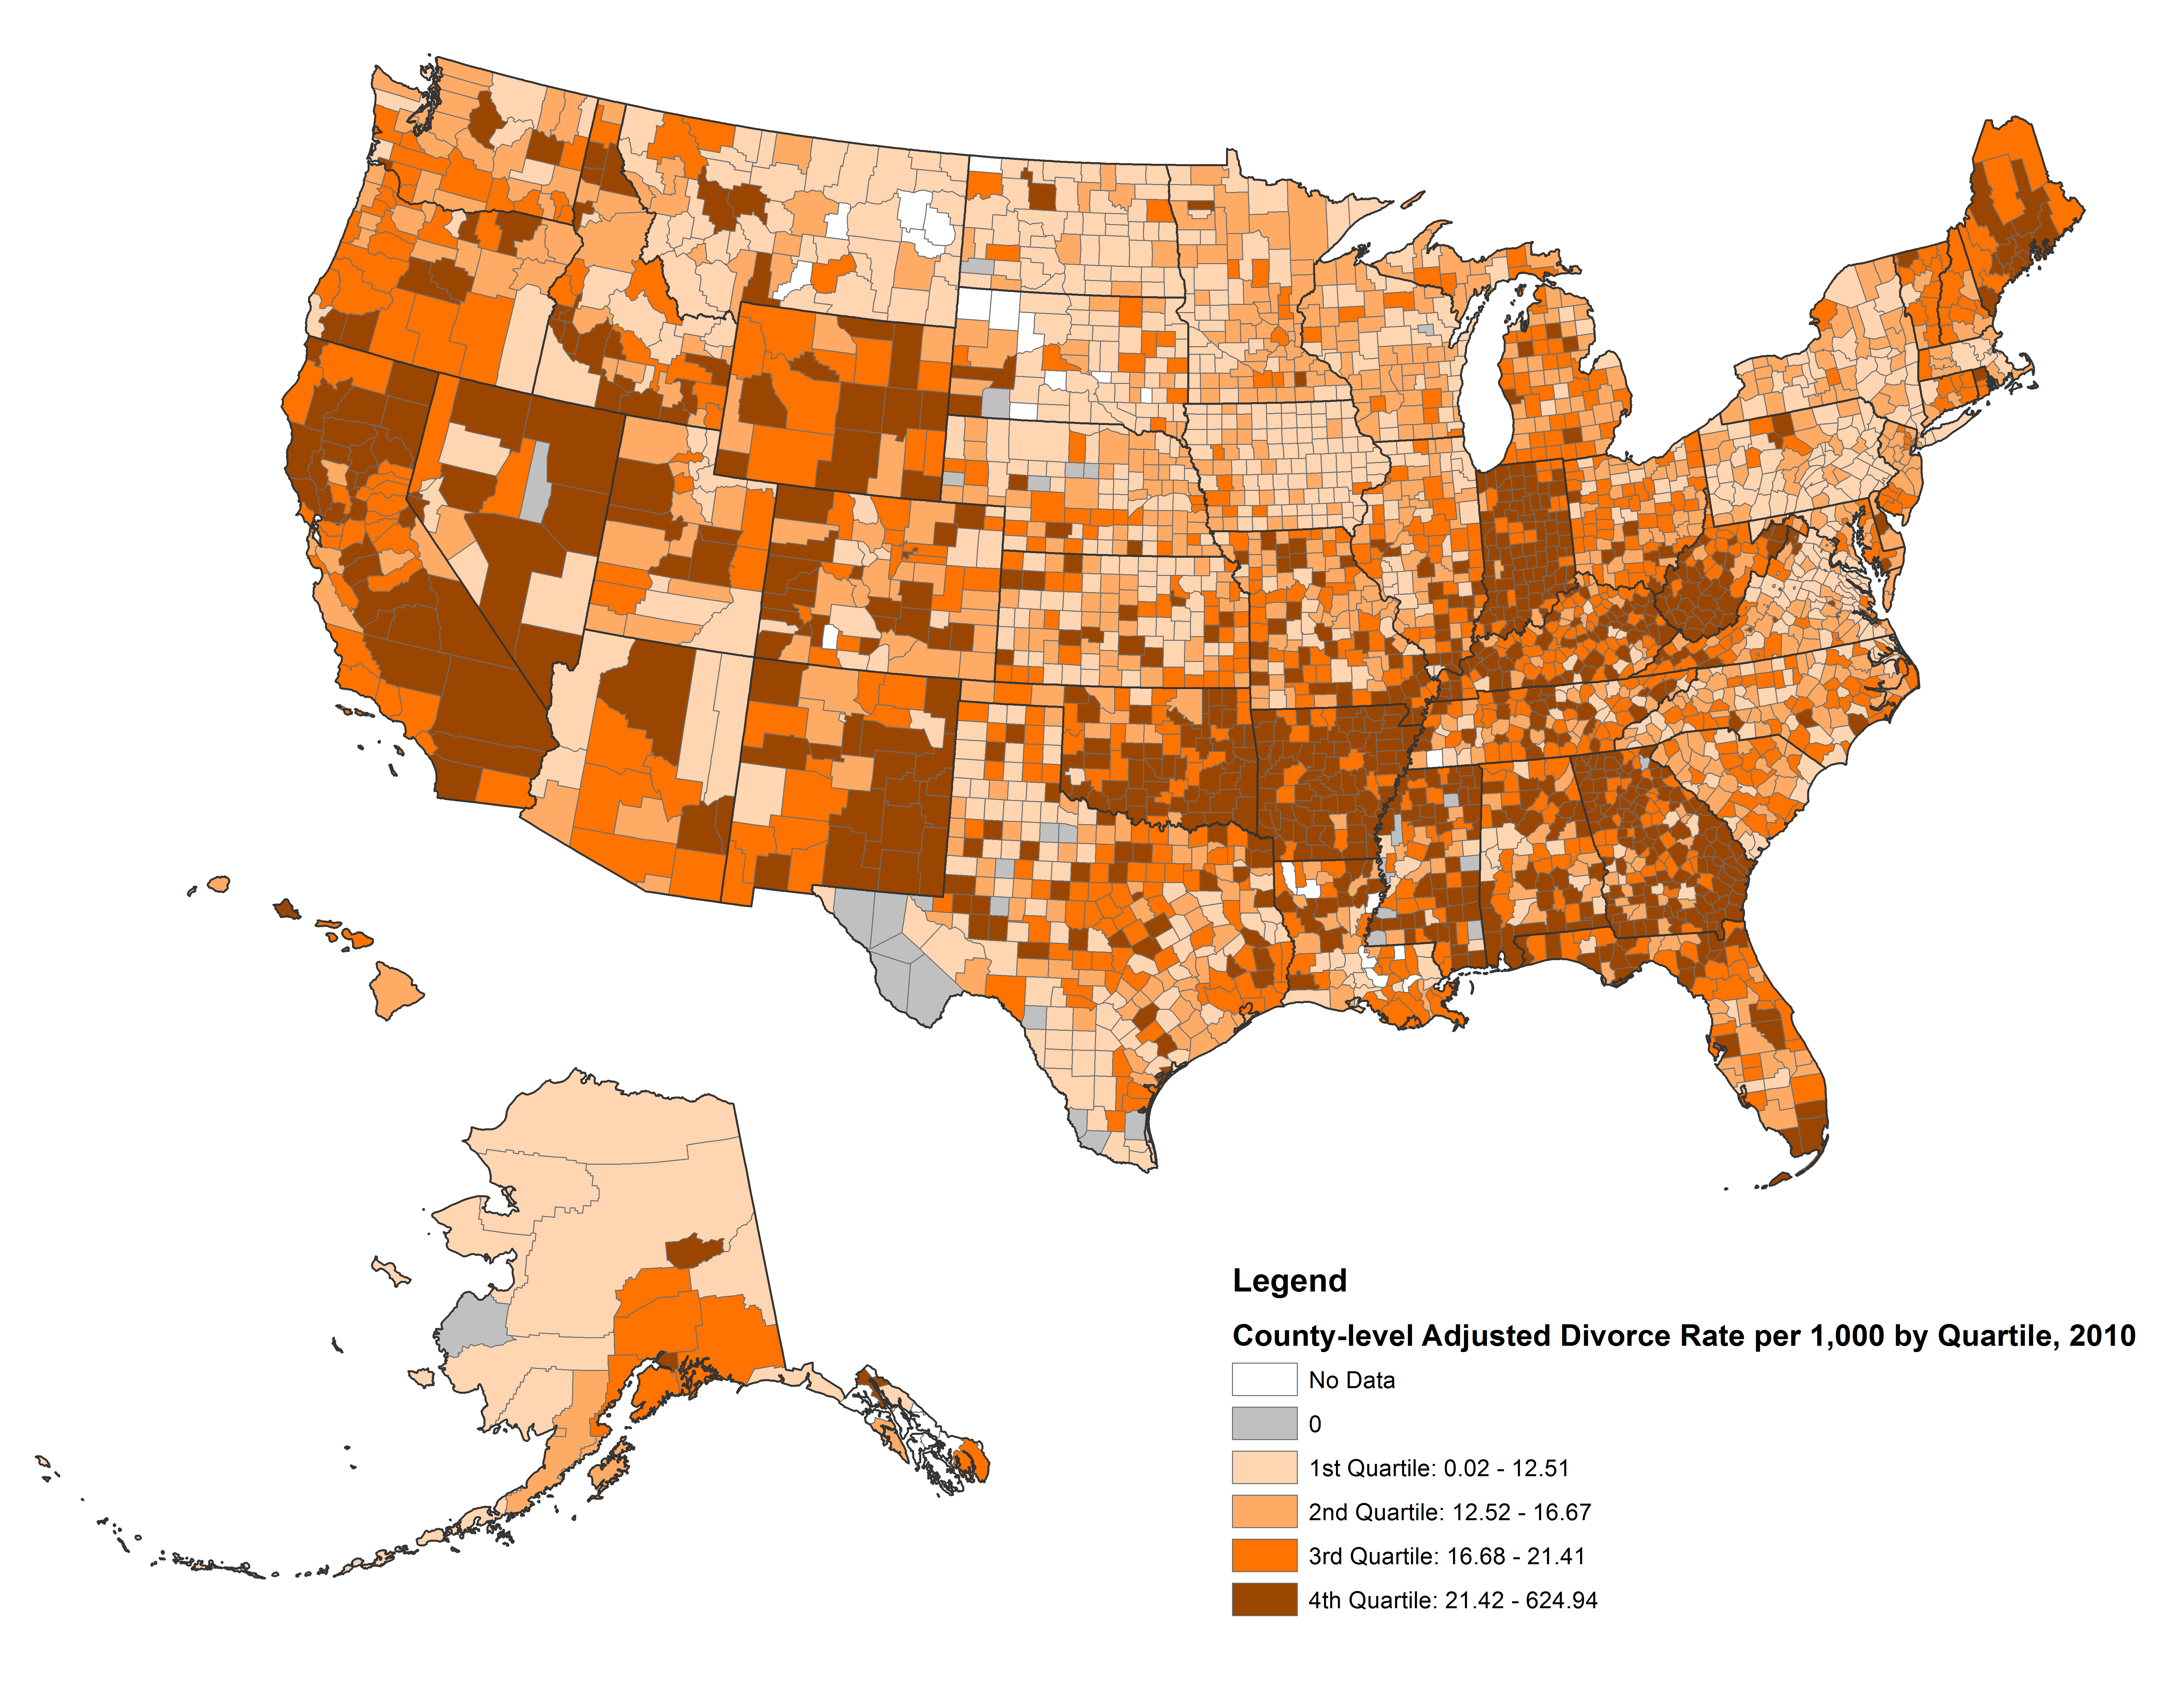
The maps (below) present geographic variation in the adjusted marriage and divorce rates for counties in the United States by quartile. The estimates are from county court record data of numbers of marriages and divorces and U.S. American Community Survey 1-yr, 3-yr, and 5-yr estimates for 2010. The adjusted marriage rates represent the number of people who married per 1,000 single people. Hotspots for marriage include counties that are destination locales such as Gatlinburg, Tennessee (Sevier County), Las Vegas, Nevada (Clark County), and Maui County, Hawaii. The adjusted divorce rates represent the number of people who divorced per 1,000 married. Some of the counties with the highest adjusted divorce rates appear to be those that facilitate divorce via online (e.g., Lincoln County, Washington) or offer relatively low court costs (e.g., Cameron County, Pennsylvania).
Associated Working Papers and Publications
Conference Presentations and Posters
Payne, K. K. & Manning, W. D. (2018). “The Geography of Marriage & Divorce in the U.S.: Correlates & Spatial Variation” Population Association of America (Poster Presentation, Award Recipient ), Denver, CO.
Manning, W. D., Payne, K. K., Zugarek, G., & Stykes, B. (2016). The Shifting Geography of Divorce Rates Across Counties and States, 2000-2010” Population Association of America (Poster Presentation, Award Recipient ), Washington, DC. Manning, W. D.,
Payne, K. K., & Stykes, B. (2015). “Counting Marriages: Comparisons of 2010 Marriage Rates Across Counties and States.” Population Association of America, San Diego, CA.
Other NCFMR County-level Marriage and Divorce Data
Updated: 10/26/2023 03:20PM


