Recent (2019) Marriages to Same-Sex and Different-Sex Couples: Marital History and Age at Marriage
Family Profile No. 19, 2021
Authors: Krista K. Payne & Wendy D. Manning
Six years ago, the US Supreme Court ruled that marriages to same-sex couples were legal in all states, prompting the US Census Bureau to revise their household rosters to directly count same-sex and different-sex married and cohabiting couples. Using data from the ACS 1-year PUMS files from 2019 (the first time the revised roster was implemented), we present the most recent American Community Survey (ACS) estimates of individuals entering into a same-sex marriage. We compare same-sex newlyweds to different-sex newlyweds based on their marital history, average age at most recent marriage, and couple’s age gap (including 95% confidence intervals). First marriage refers to a first marriage for both members of the couple and remarriage refers to a remarriage for at least one member of the couple. Analyses are limited to householders and spouses of householders. Note, while the terms “sex” and “gender” are not interchangeable, because the ACS survey questionnaire uses the term “sex,” we have opted to do so as well.
Marriages in the Last Year
- According to the ACS, there were about 64,000 marriages to same-sex couples and nearly 1.7 million marriages to different-sex couples in 2019.
- About 3.7% of marriages in 2019 were among same-sex couples.
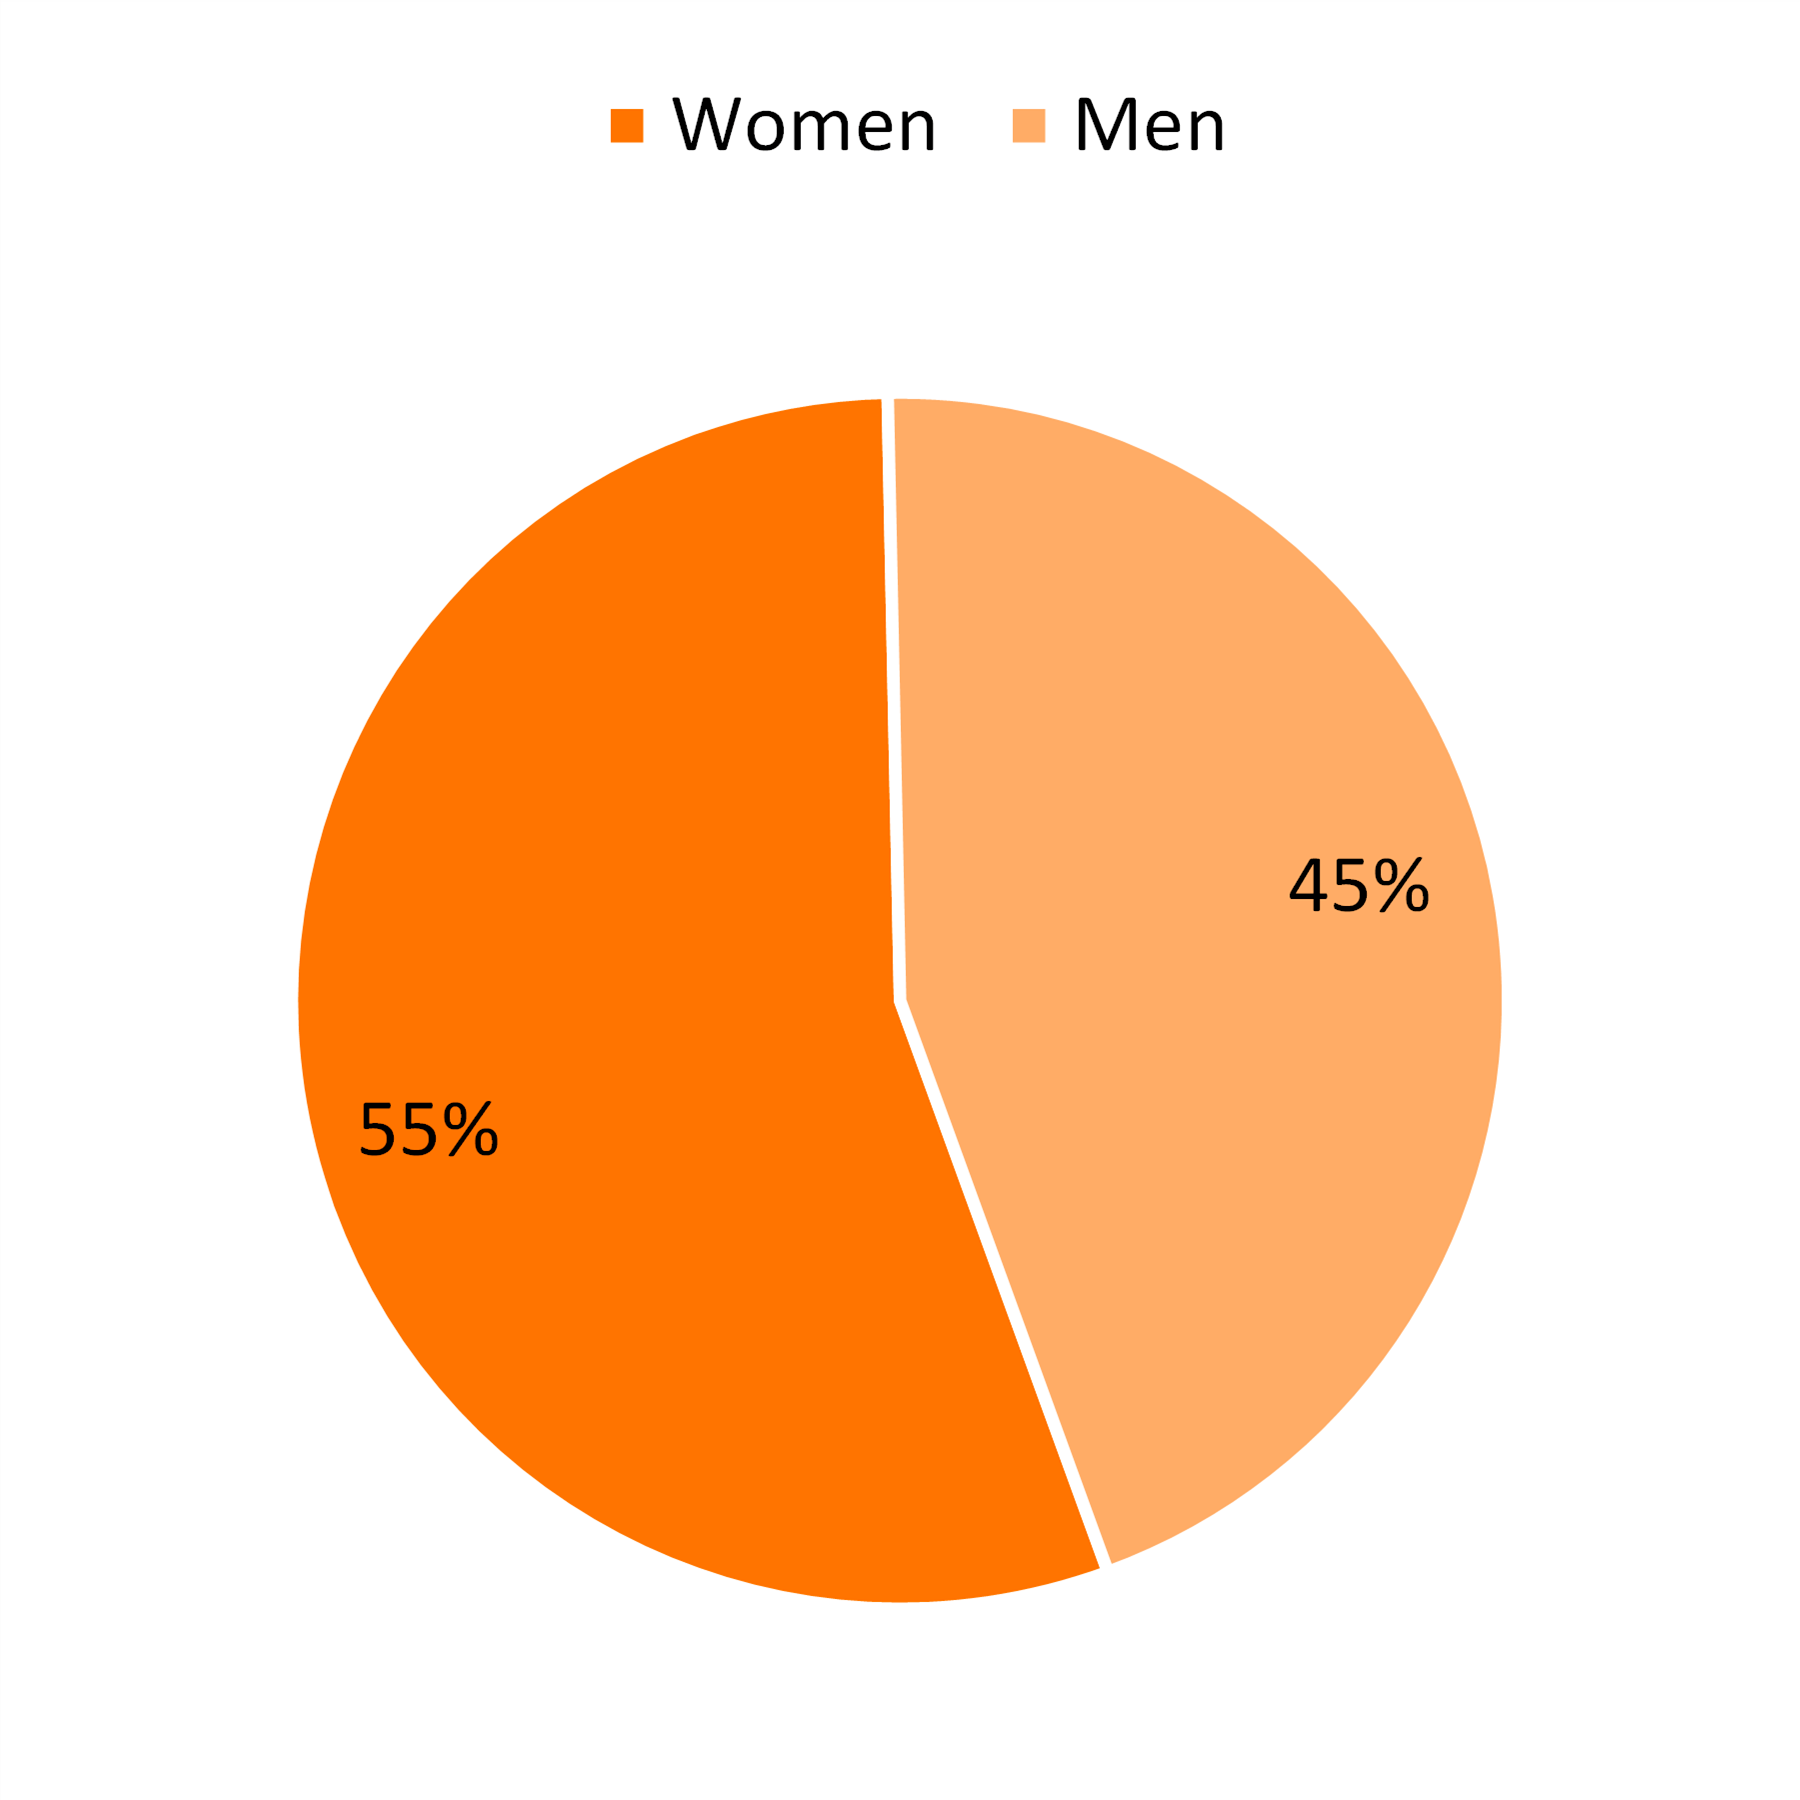
- Marriages to same-sex couples in the last year were nearly evenly split by gender, 55% were to women and 45% were to men.
Figure 1. Gender Composition of Recently Married (2019) Same-Sex Couples
Marriages in the Last Year for Same-Sex and Different-Sex Couples| First Marriages and Remarriages
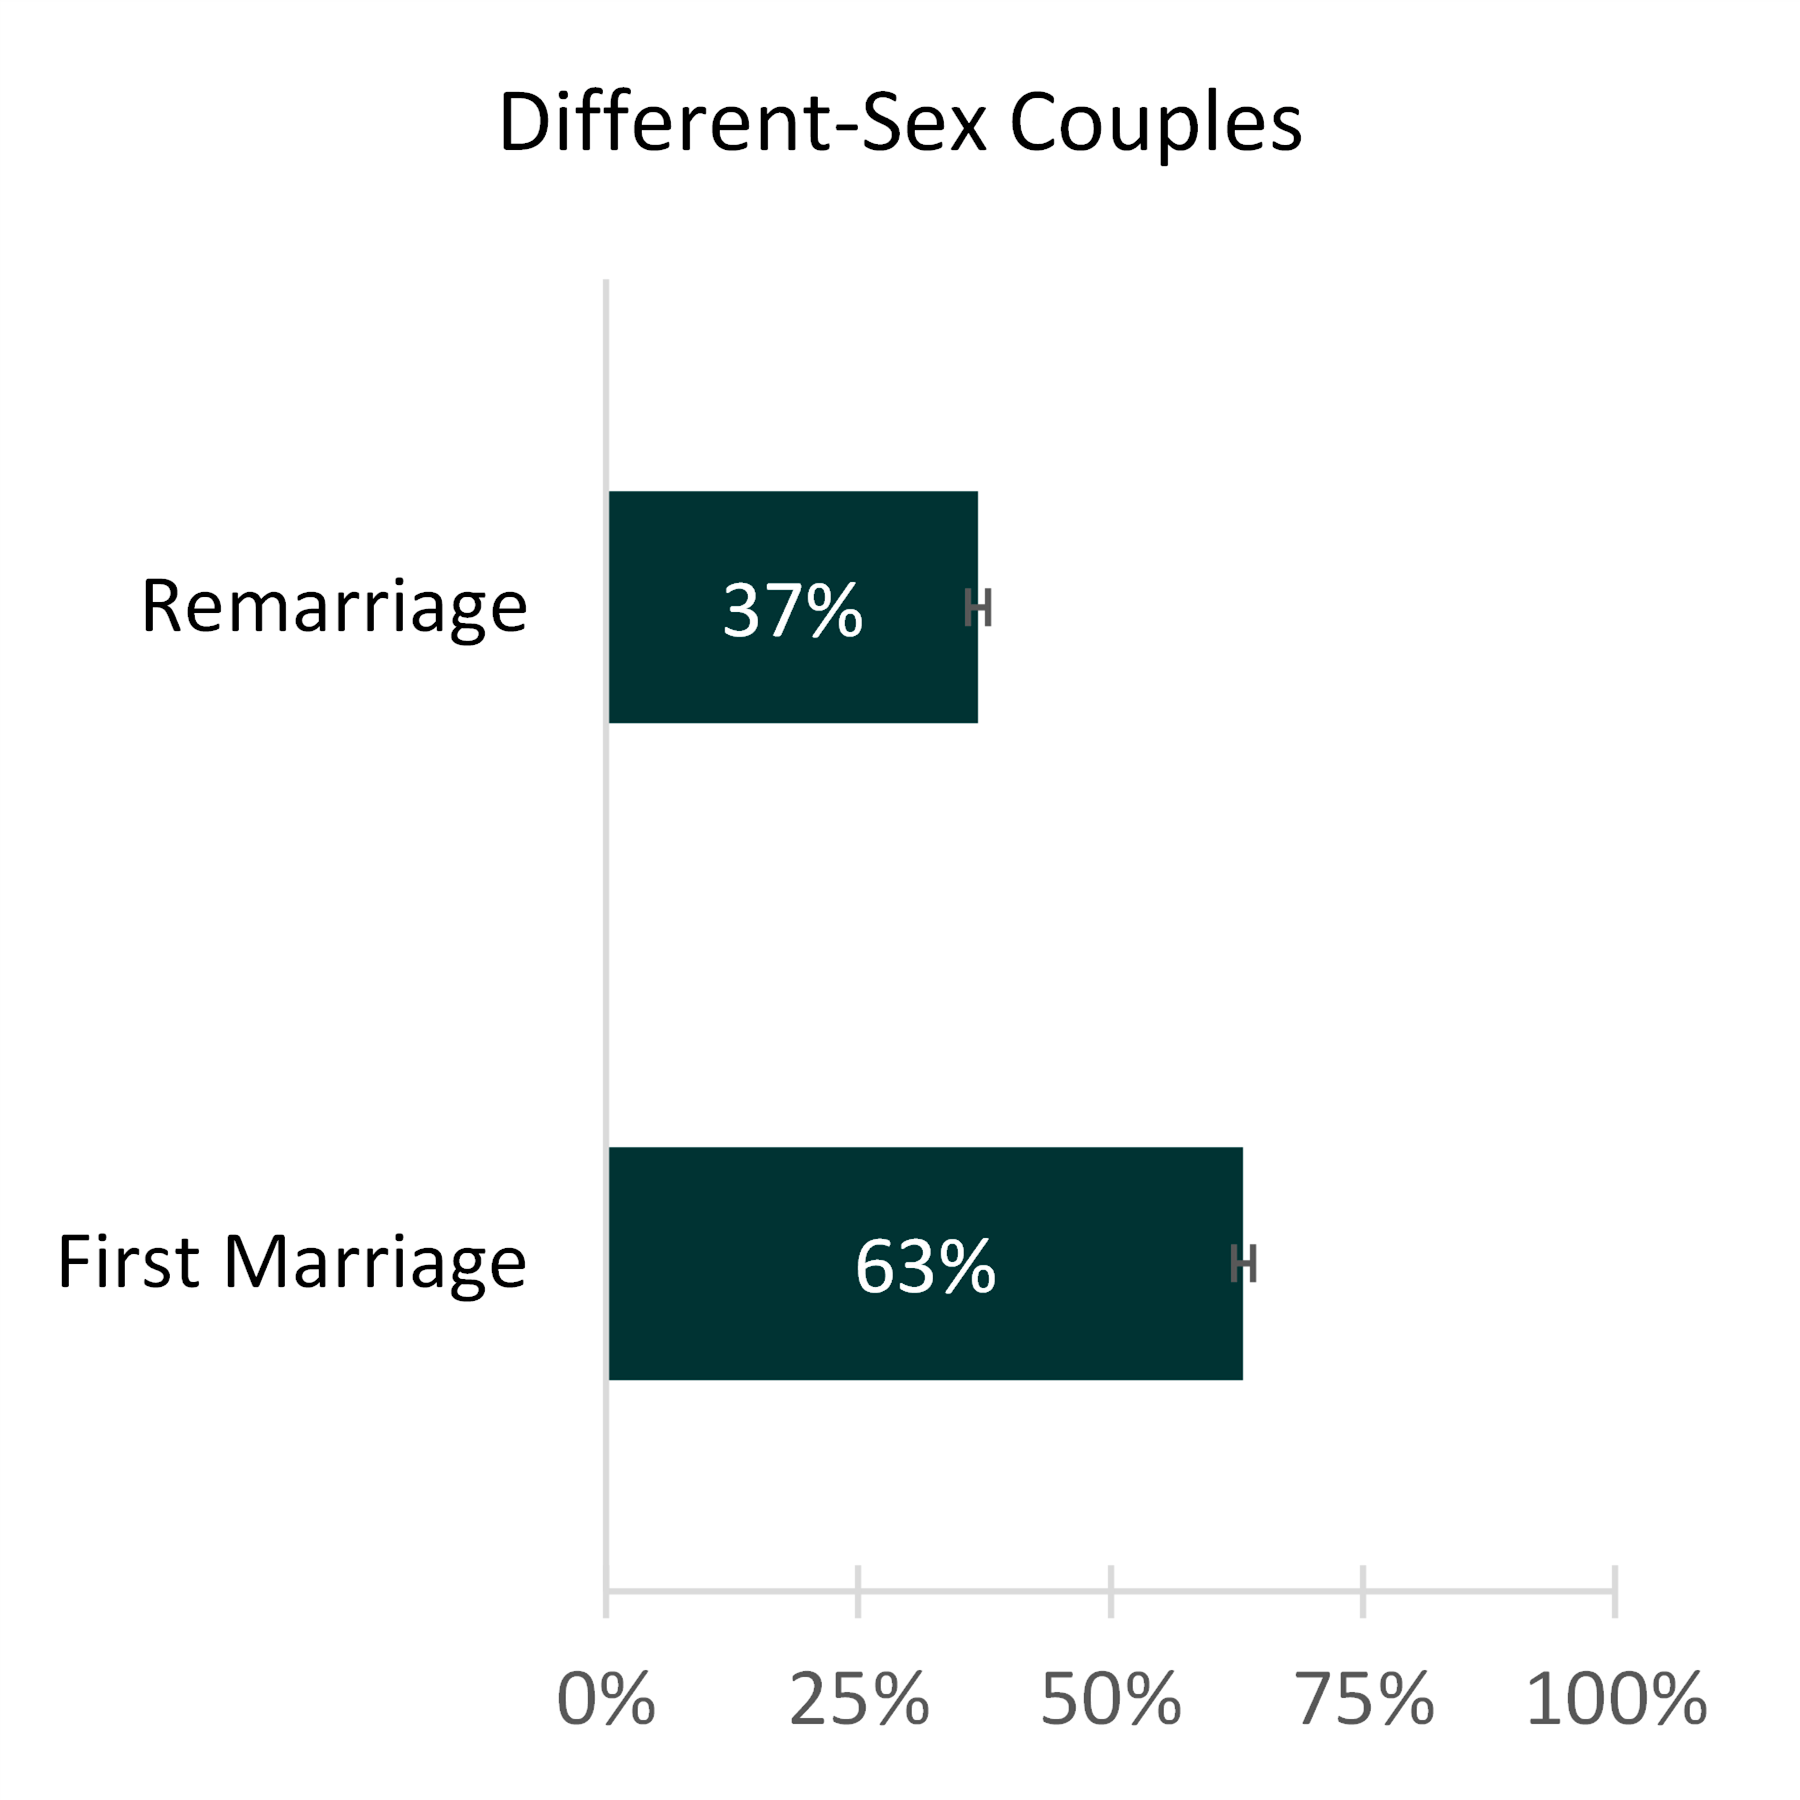
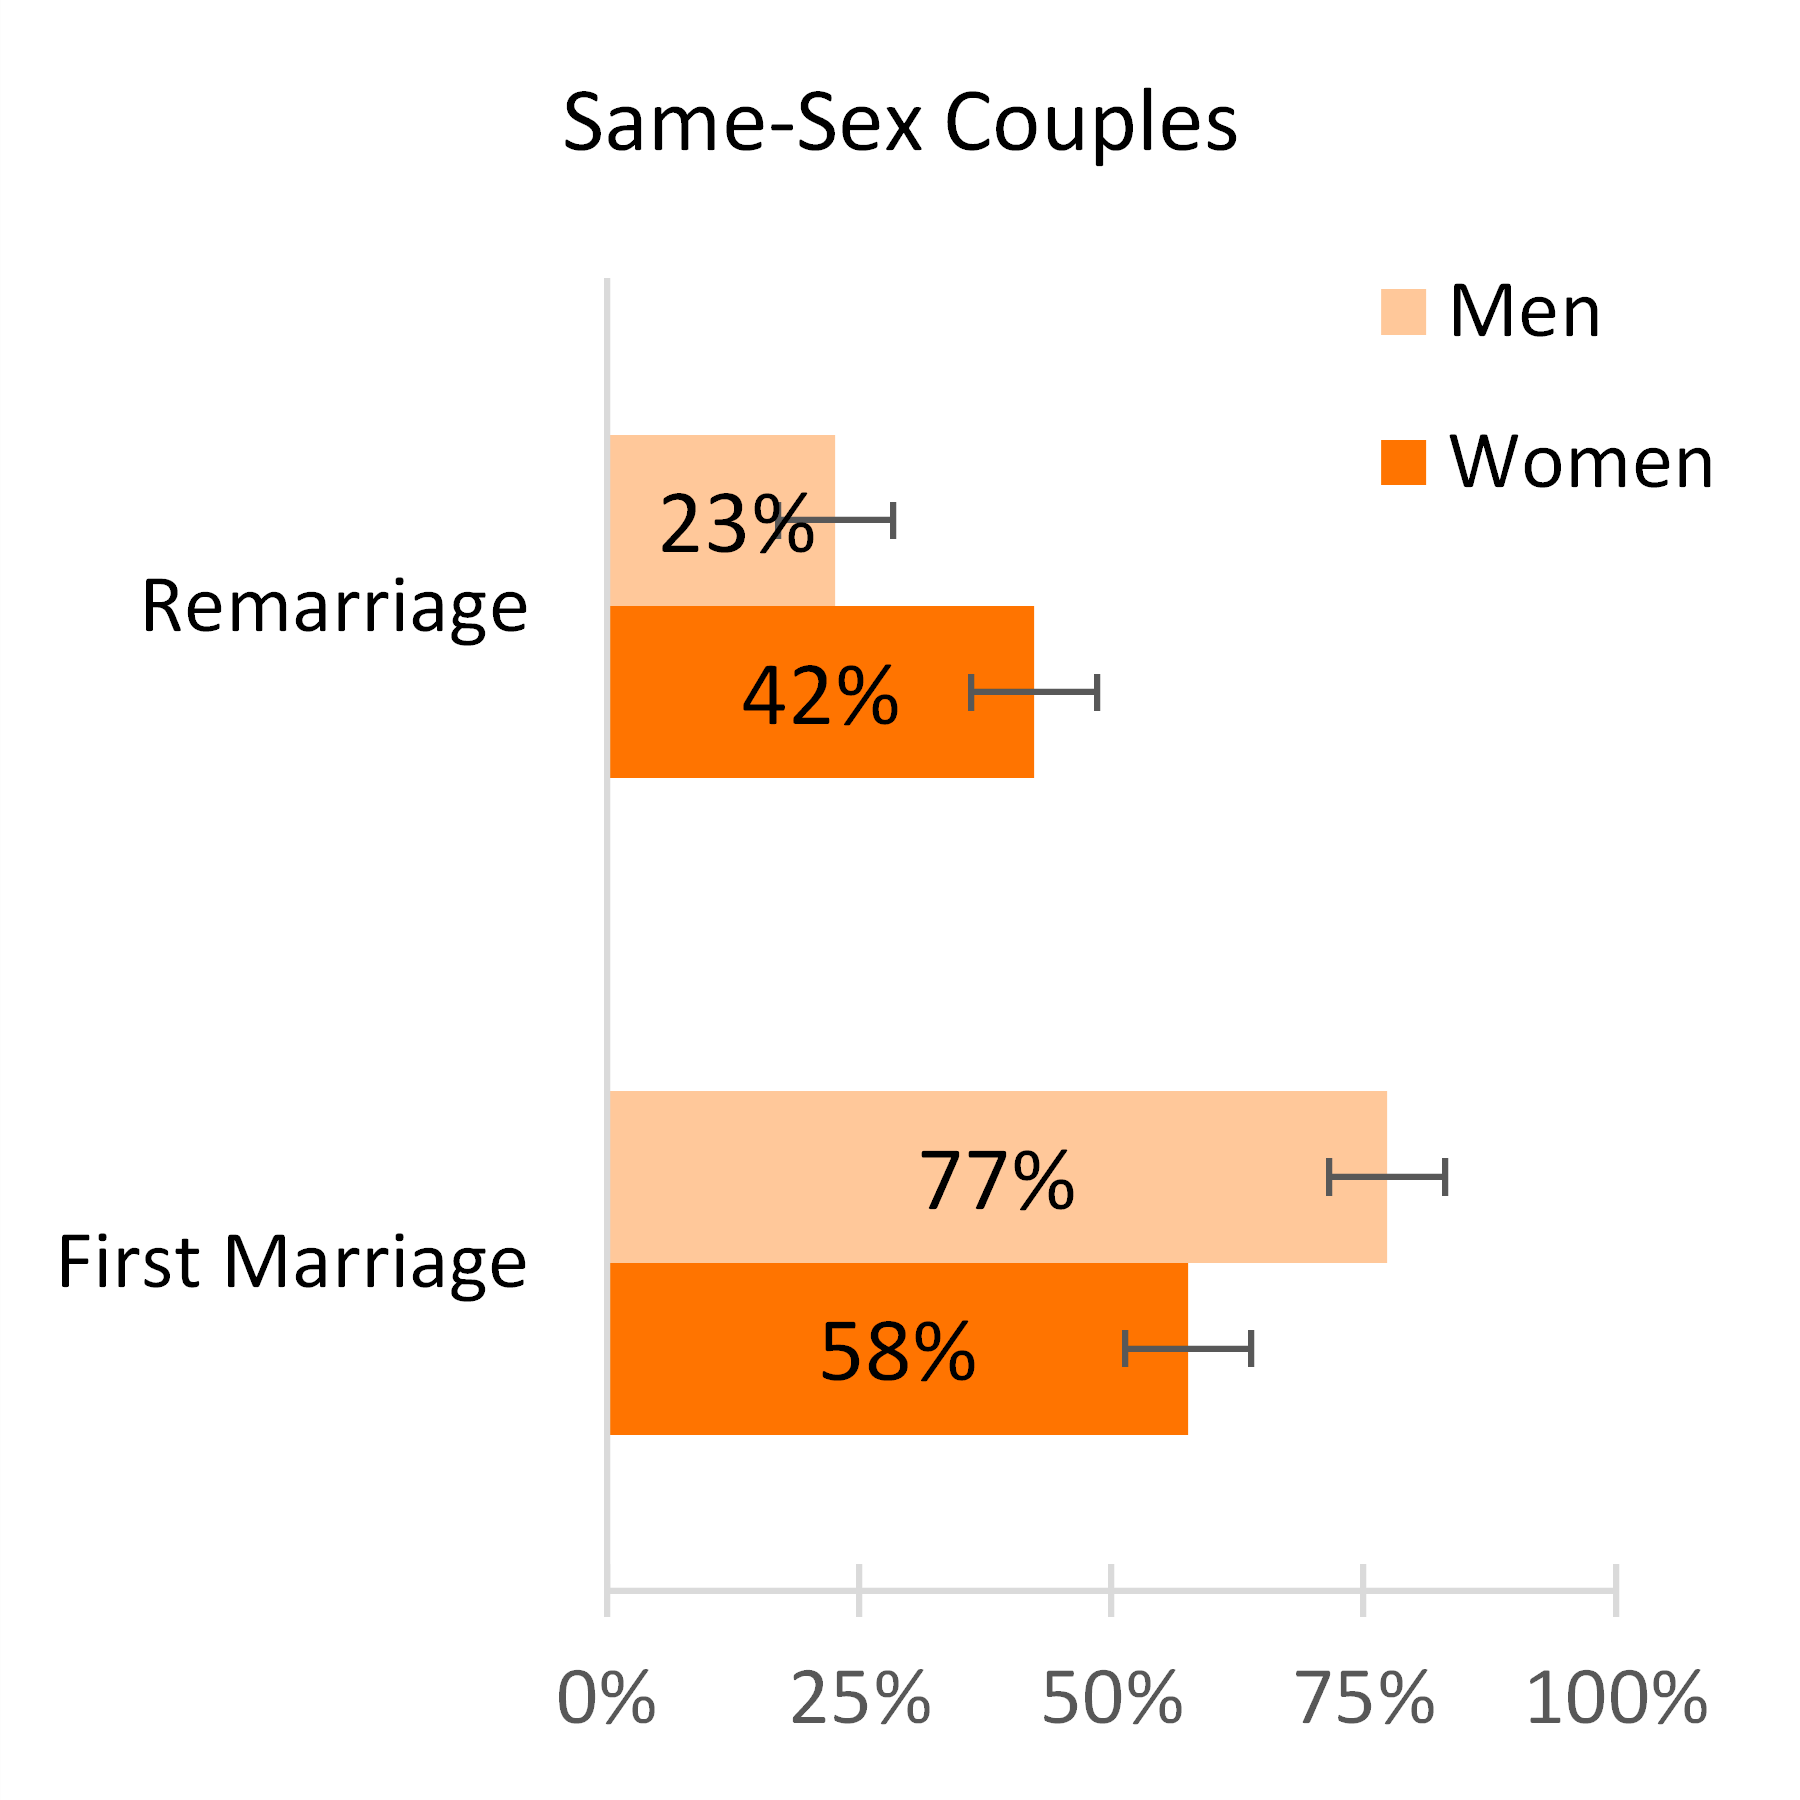
- The majority of recent marriages were first marriages for both members of the couple regardless of gender composition of the couple.
- Over one-third of recent marriages to different-sex couples were remarriages. Higher shares of women entering into a marriage with a same-sex partner were entering a remarriage (42%). In contrast, 23% of recently married men in same-sex couples had been previously married.
Figure 2. First Marriage and Remarriage for Same-Sex and Different-Sex Couples, 2019
Source: NCFMR calculations of the American Community Survey 1-year estimates, 2019
Mean Age at First Marriage Among Newlyweds: First Marriages and Remarriages
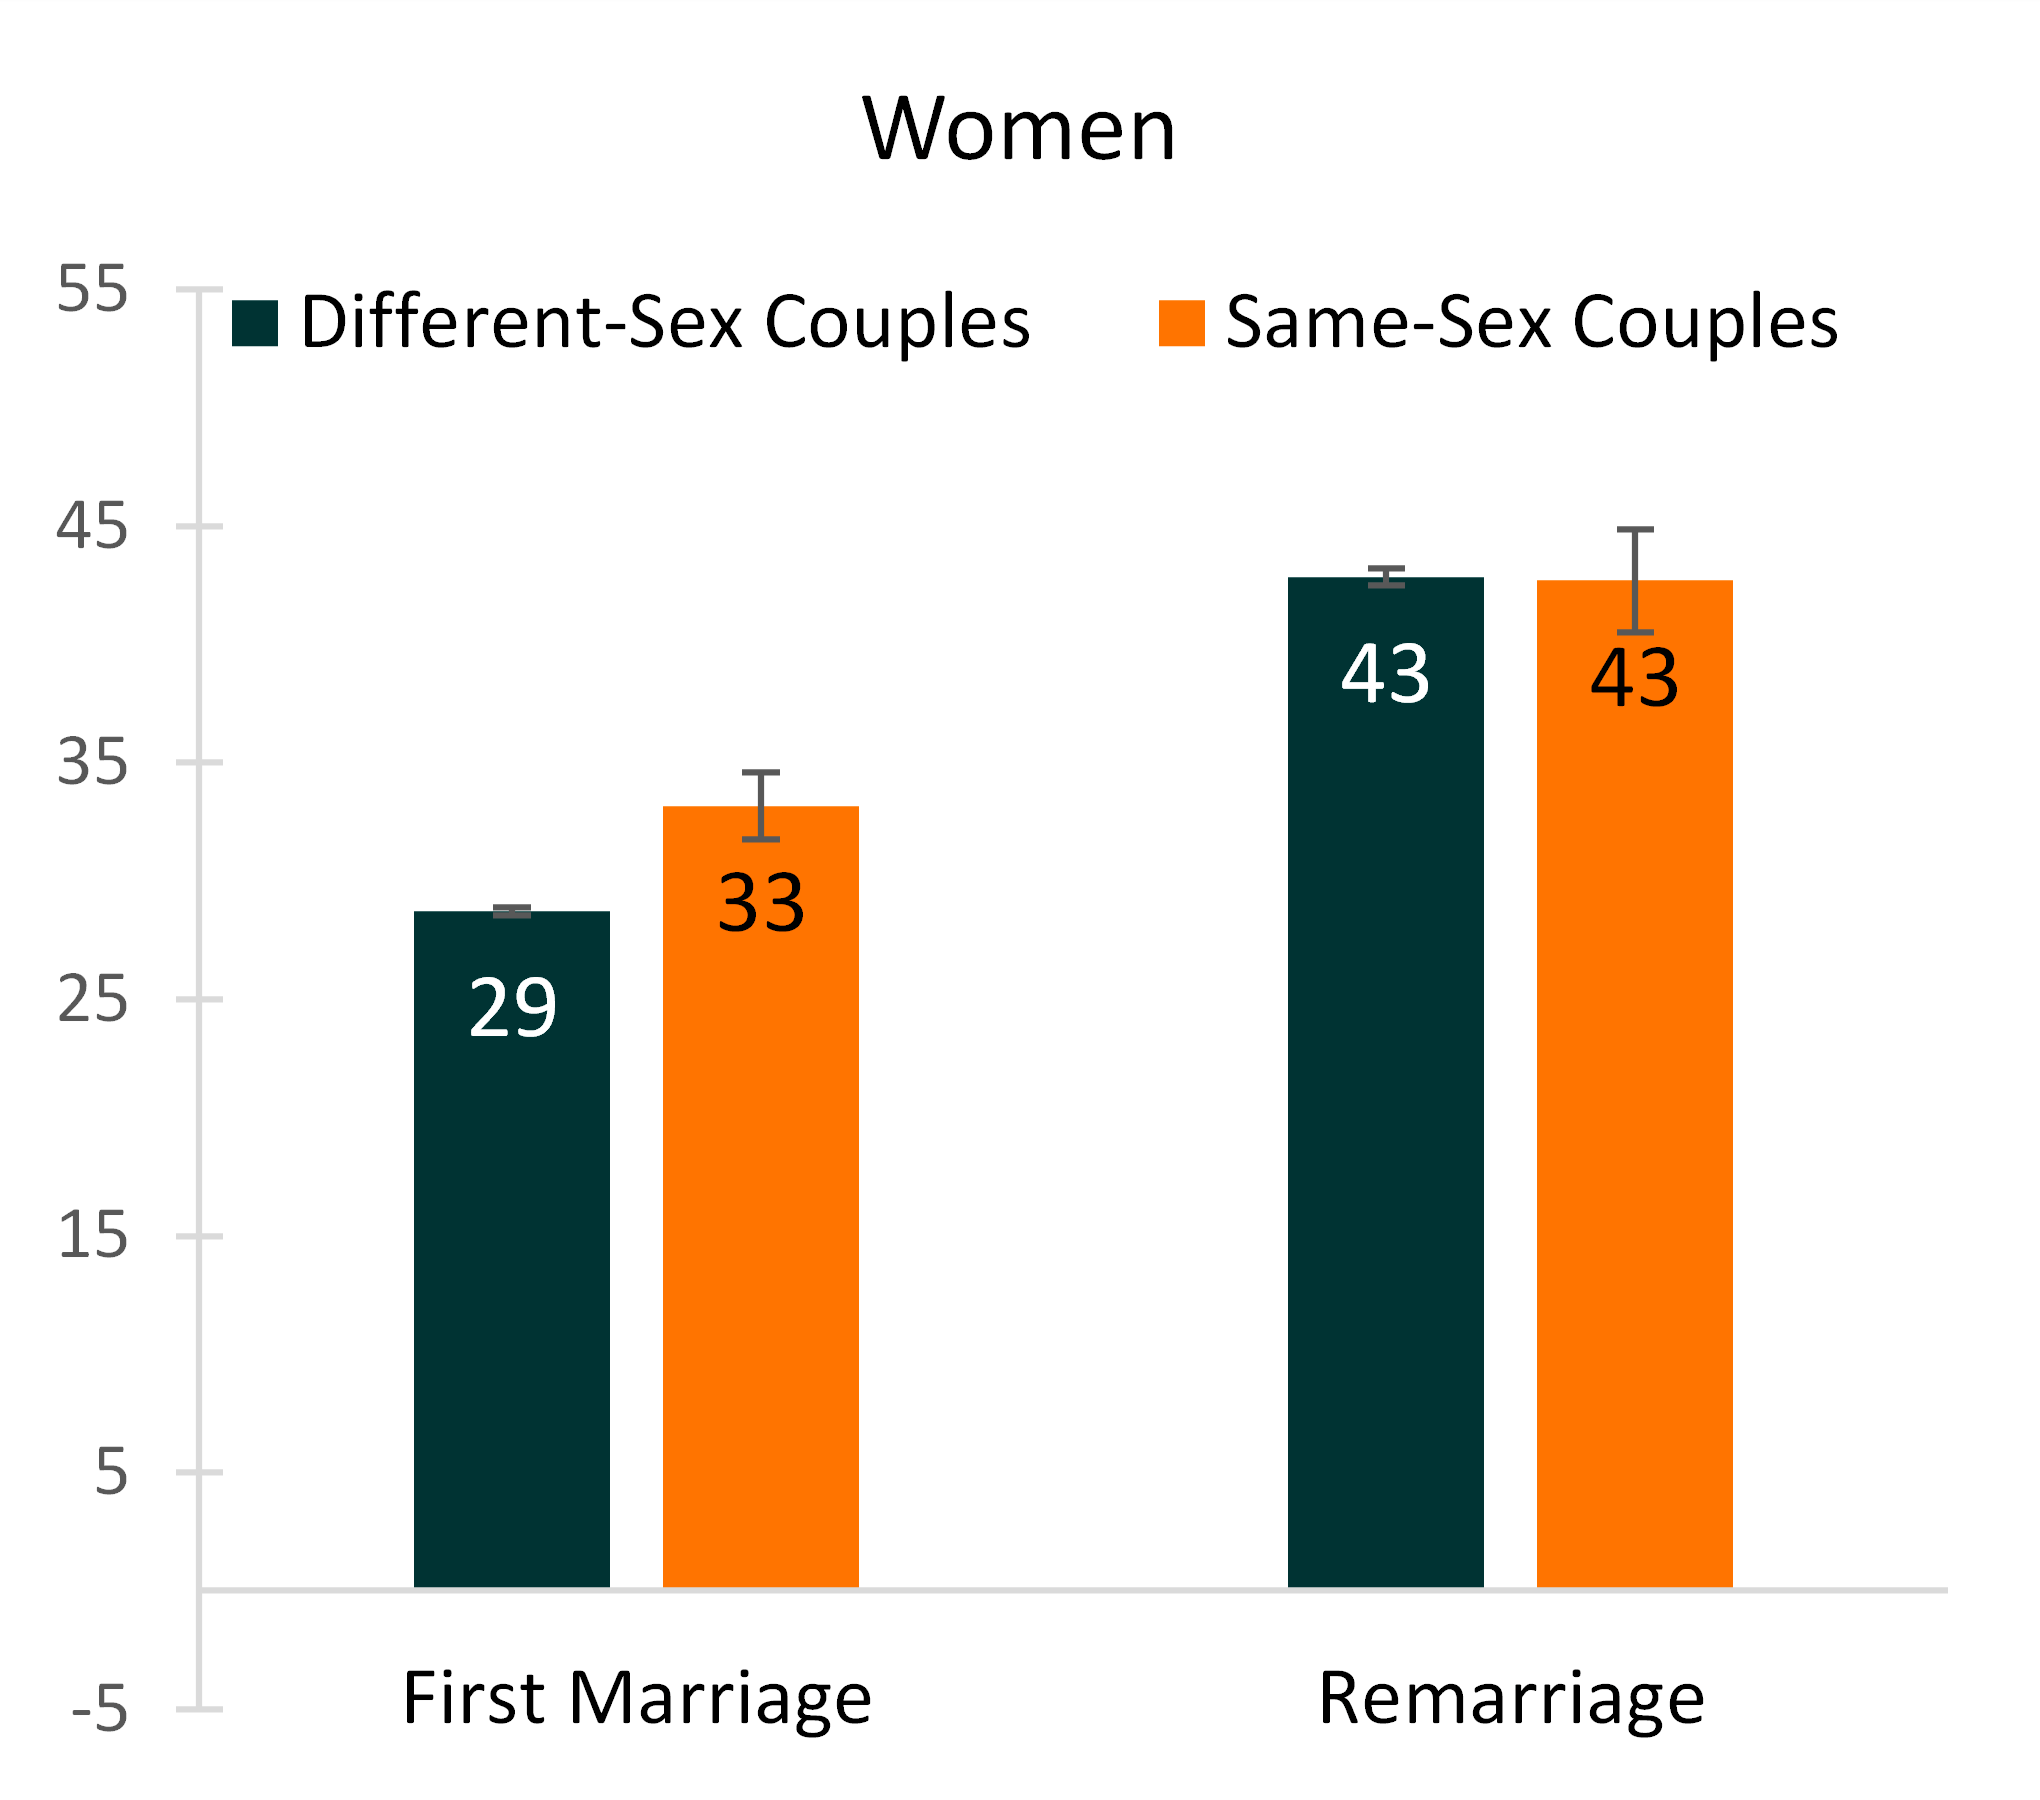
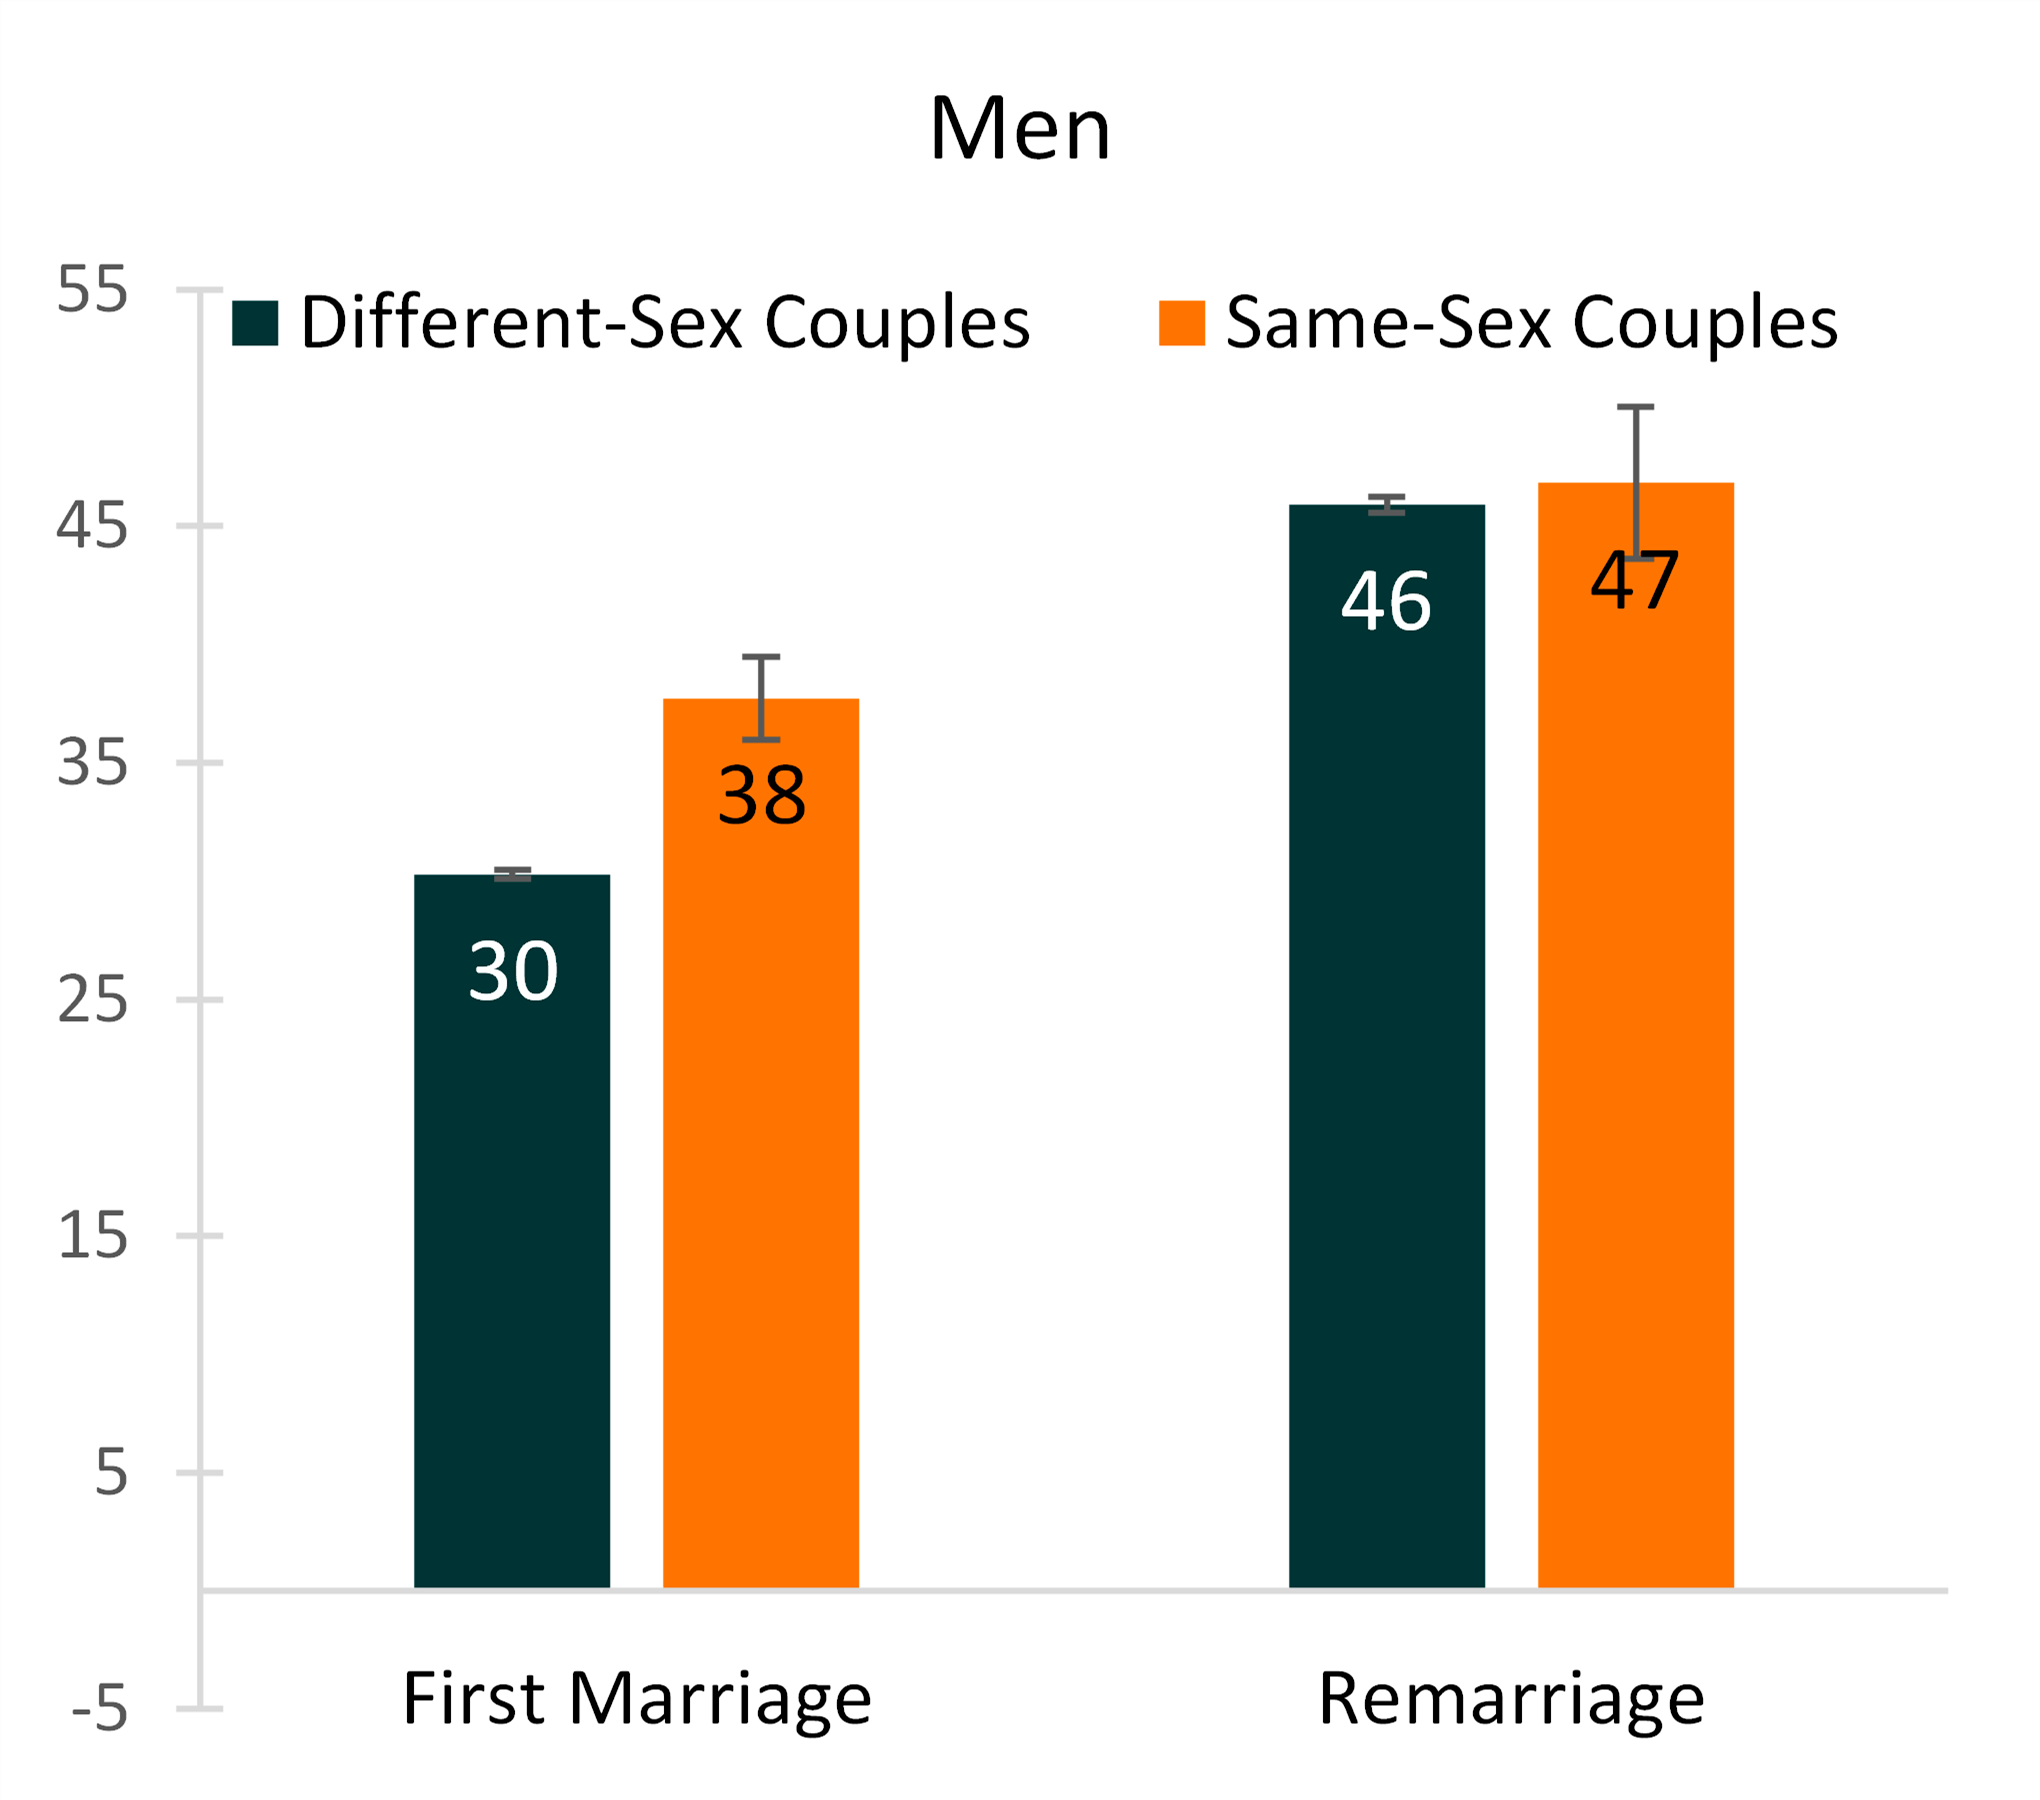
- First-time married same-sex couples were older at first marriage than different-sex couples, and this holds true for men and women.
- The mean age at first marriage for women in same-sex couples was 33 in contrast to age 29 for women in different-sex couples.
- Among men, the mean age at first marriage for same-sex couples was 38 in contrast to 30 for different-sex couples.
- Remarried same-sex couples and different-sex couples shared a similar mean age at marriage.
Figure 3. Mean Age at Marriage and Marital History for Same-Sex and Different-Sex Couples Married in the Last Year, 2019
Source: NCFMR calculations of the American Community Survey 1-year estimates, 2019

Newlyweds’ Age Gap for Same-Sex and Different-Sex Couples: First Marriages and Remarriages
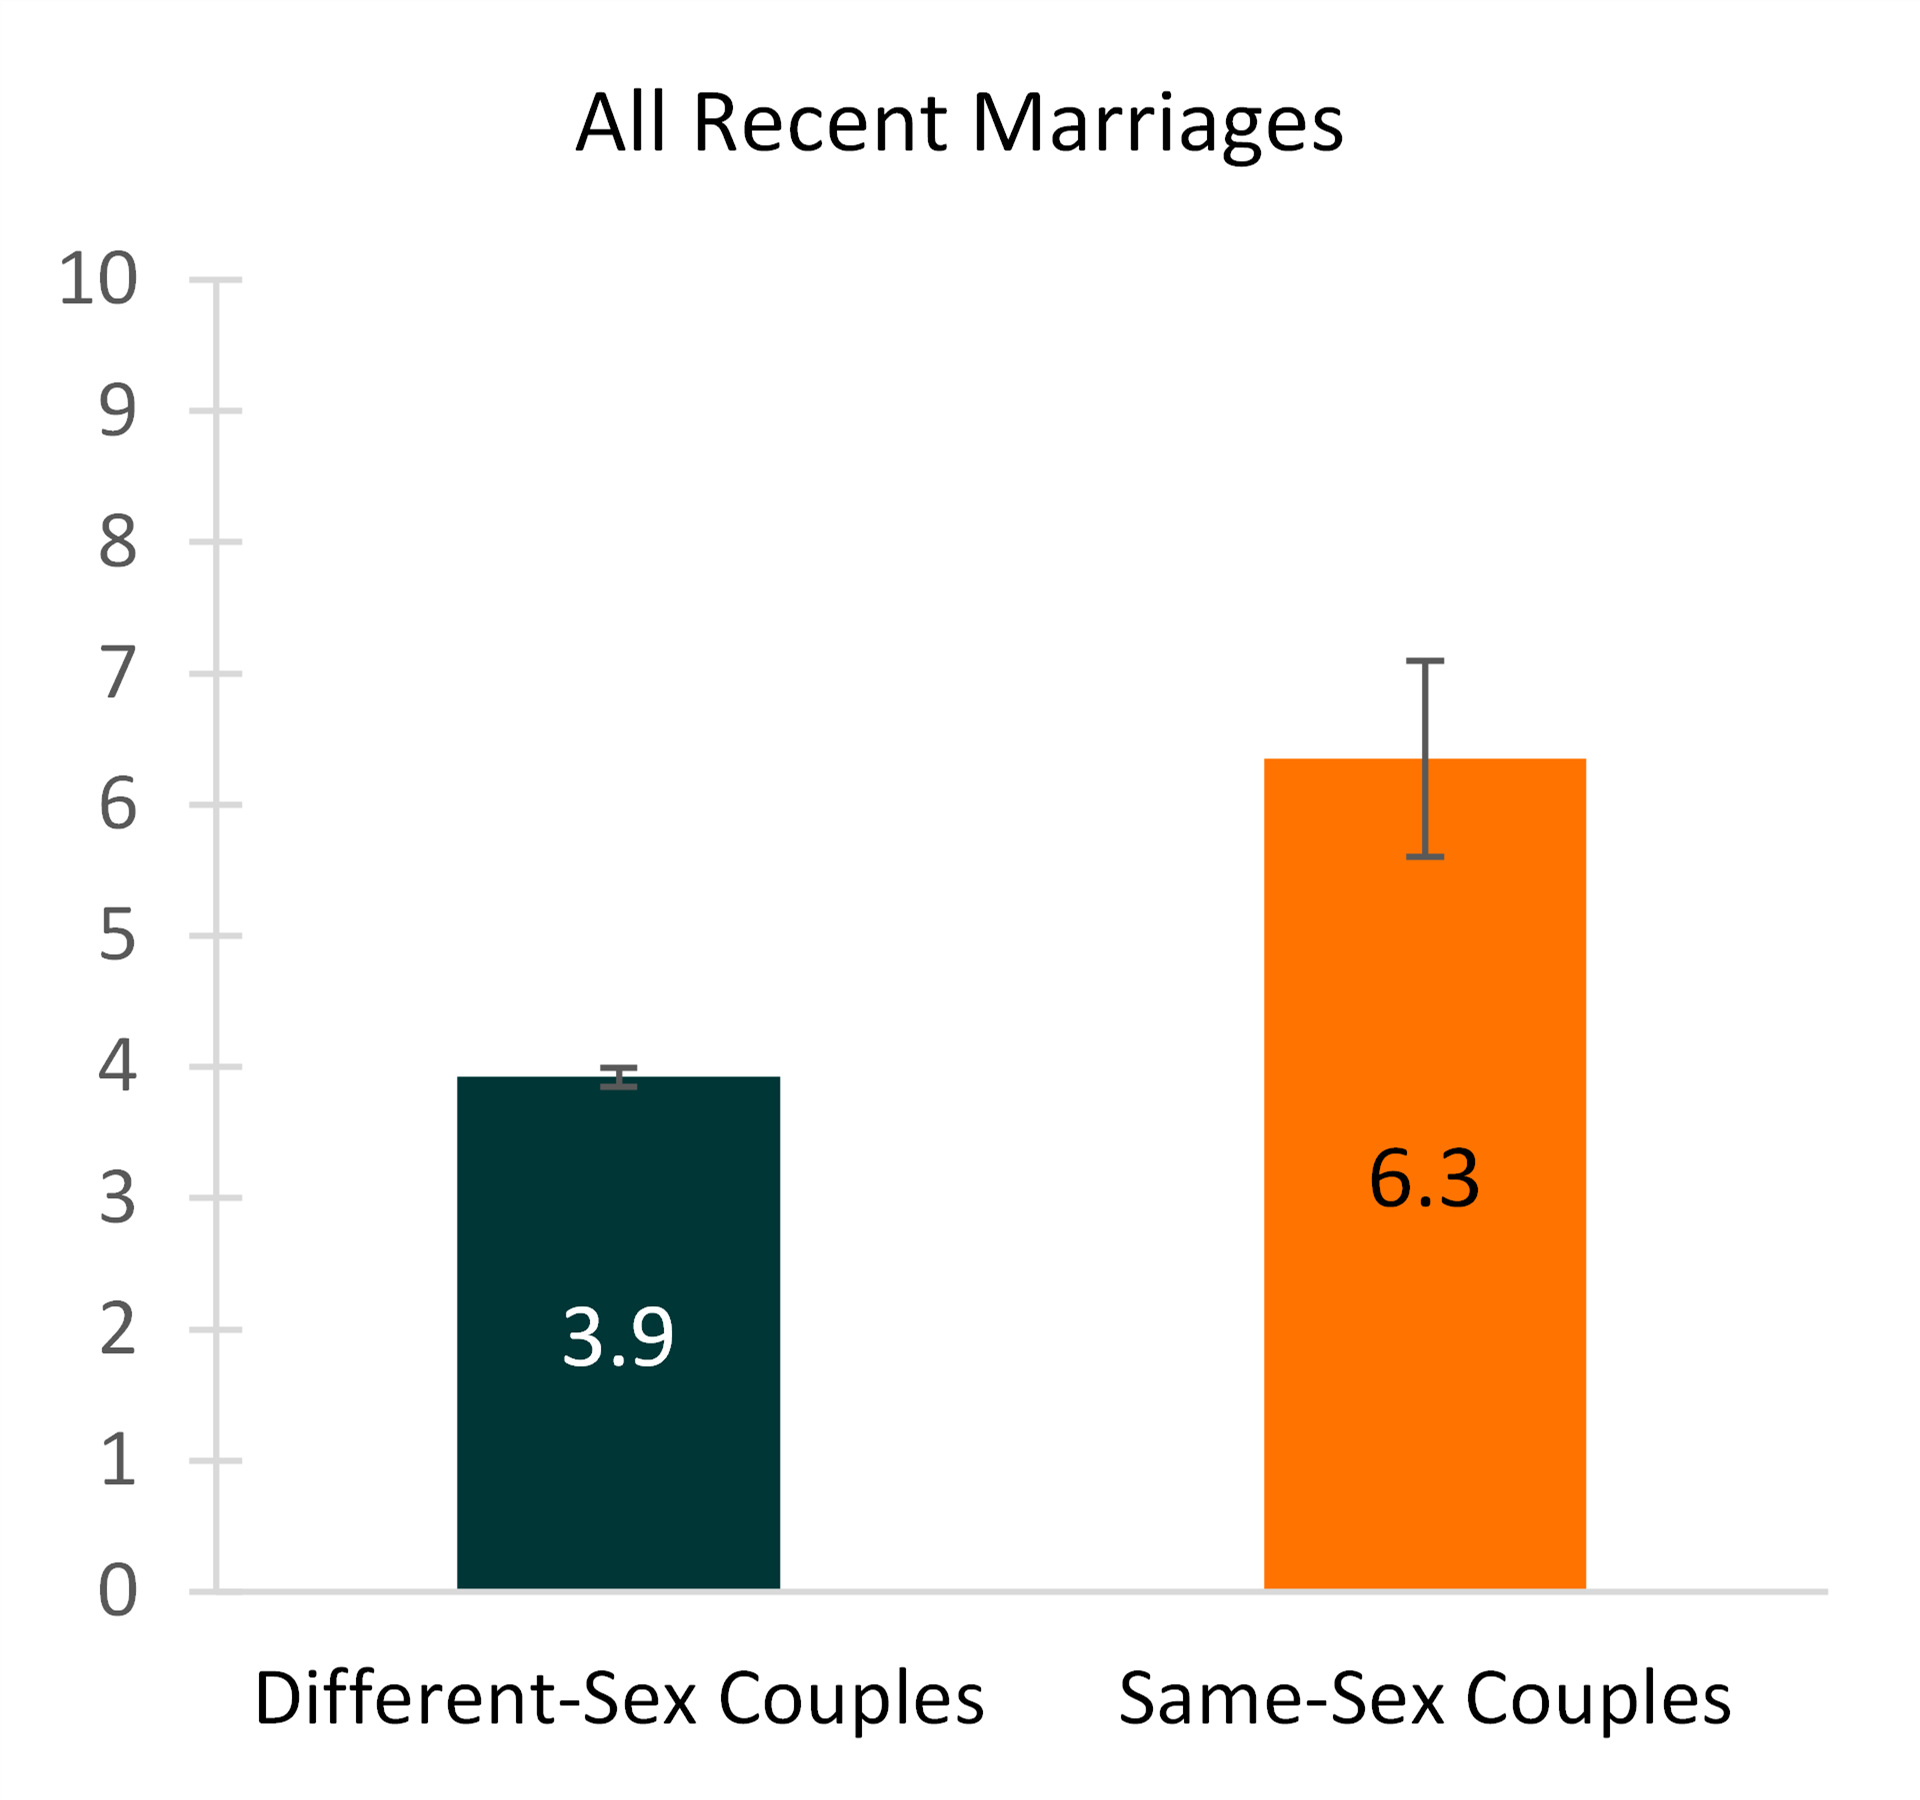
- Mean age differences between same-sex couples who married in the last year were significantly higher than among different-sex couples, 6.3 years contrasted with 3.9 years.
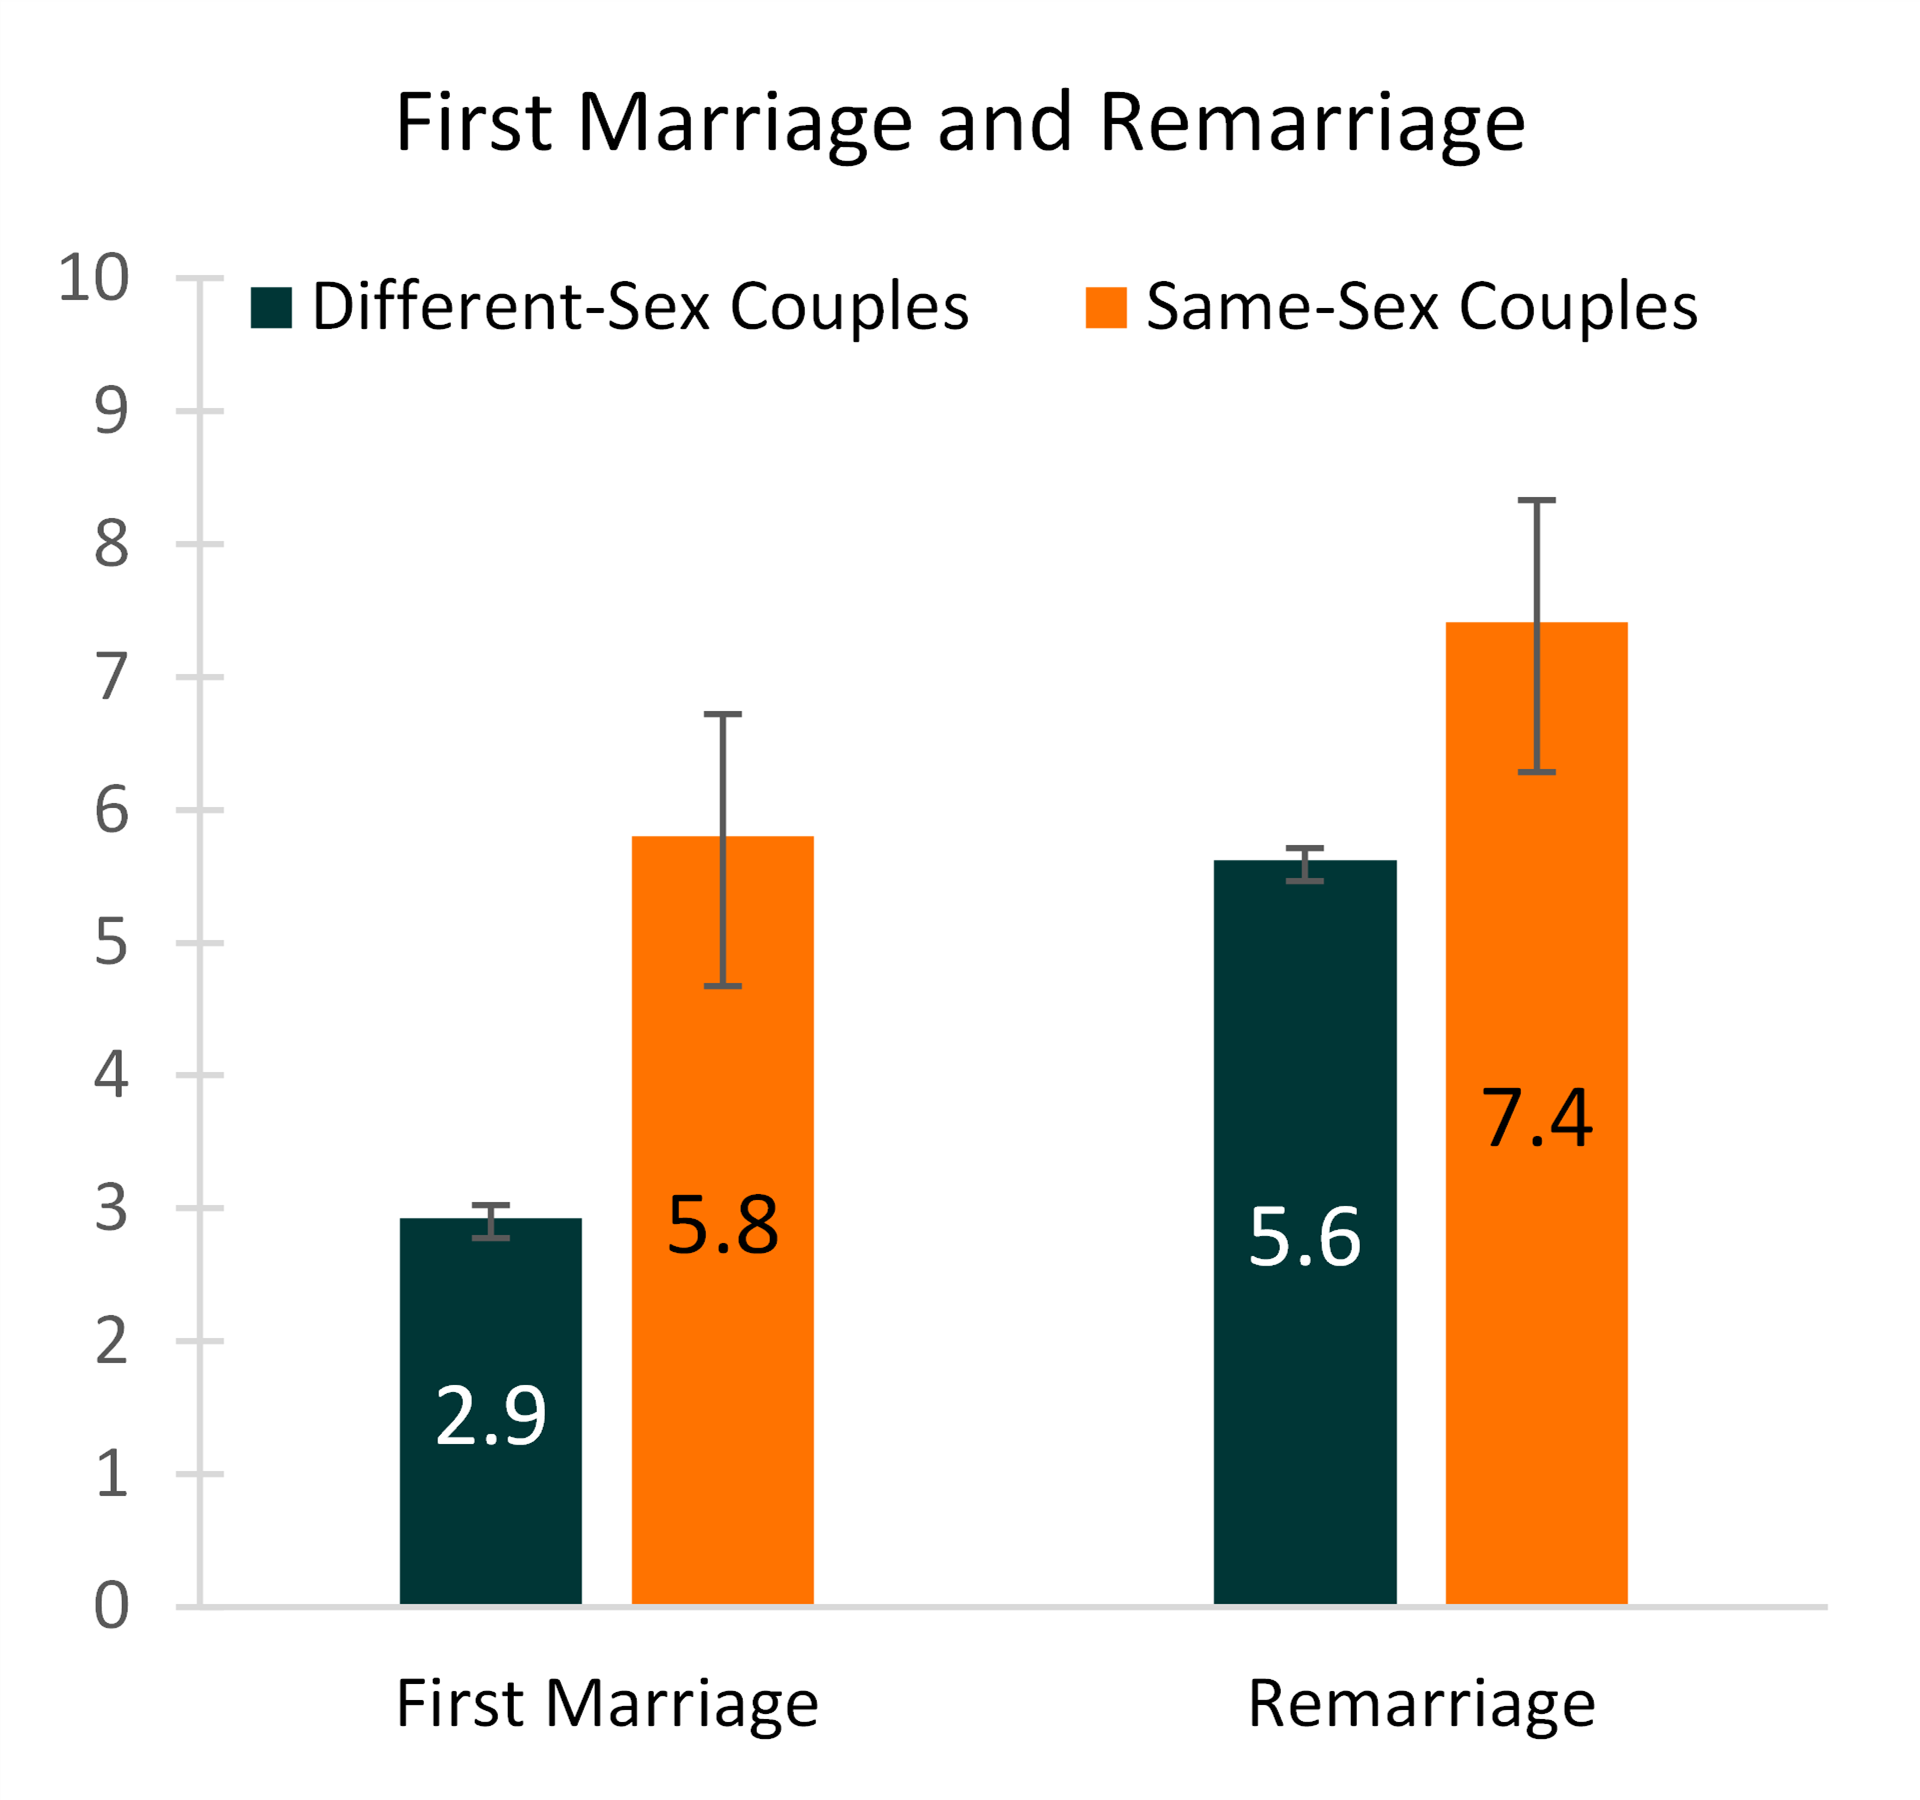
- The age gap was smallest for recent first marriages, particularly among different-sex couples. Among different-sex couples, the gap was 2.9 years compared to 5.8 among same-sex couples.
- The mean age gap is greater for remarried couples. Among remarriages, the mean age difference was significantly smaller for different-sex couples (5.6 years) compared to same-sex couples (7.4 years).
Figure 4. Mean Age Difference & Marital History for Same-Sex and Different-Sex Couples Married in the Last Year, 2019
Source: NCFMR calculations of the American Community Survey 1-year estimates, 2019
Data Source:
U.S. Census Bureau, American Community Survey, 1-year estimates, 2019.
Suggested Citation:
Payne, K. K. & Manning, W. D. (2021). Recent (2019) marriages to same-sex and different-sex couples: Marital history and age at marriage. Family Profiles, FP-21-19. Bowling Green, OH: National Center for Family & Marriage Research. https://doi.org/10.25035/ncfmr/fp-21-19
Updated: 11/10/2025 04:56PM


