Older Adult Cohabiting and Married Couples
Family Profile No. 16, 2022
Author: Christopher A. Julian
In 2000, the number of older men and women in a cohabiting relationship was estimated to be about 1.2 million (Brown, Bulanda, & Lee, 2005). In 2017, the number of cohabiting older adults rose to an estimated 4 million (Stepler, 2017). The increasing number of older adult cohabitators occurs simultaneously with a growing literature suggesting that later-life cohabitation operates as an alternative to marriage (King & Scott, 2005; Brown, Bulanda, & Lee, 2012; Brown & Wright, 2017; Wright 2020). Using data from the 2019 American Community Survey, this Family Profile examines older adult couples where an older couple is defined as one where at least one member of the couple is 50 years old. This profile estimates the number of cohabiting and married couples’ relative to the number of single older adults. Additionally, this profile assesses marital history and the educational homogamy of cohabiting and married couples. Lastly, it examines the average age differences between partners within cohabiting and married couples.
Union-type Composition of Older Adults
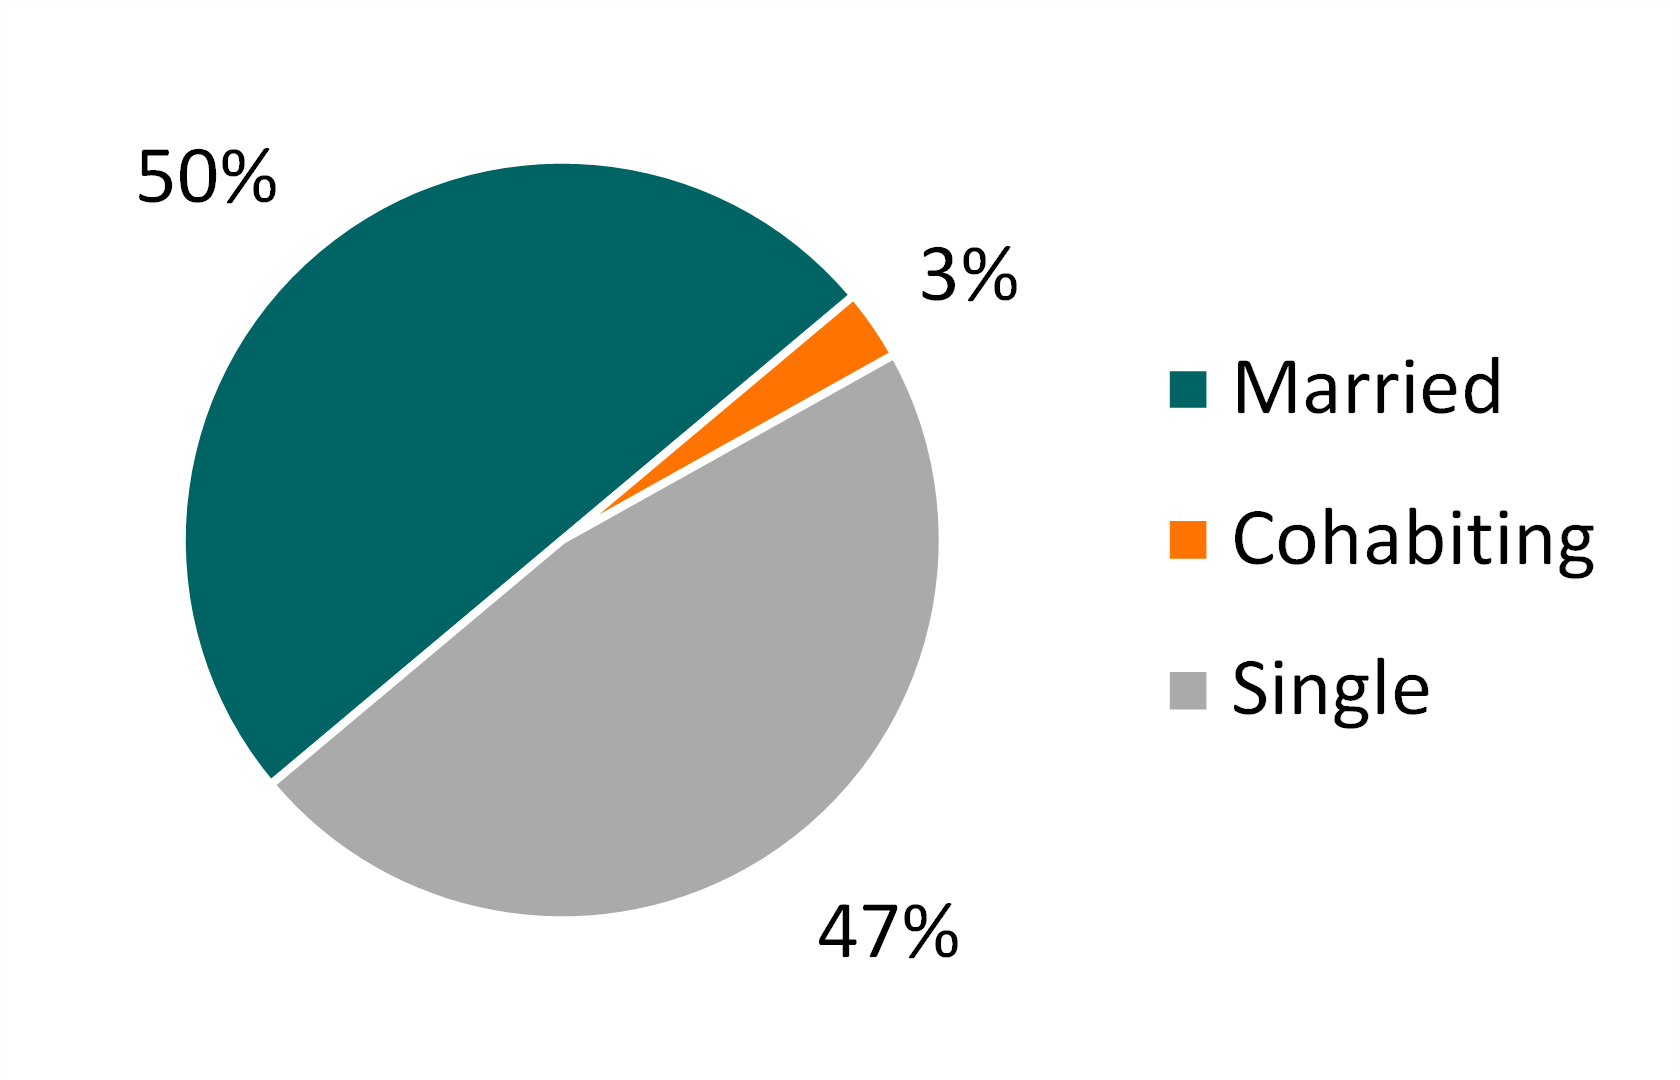
Figure 1 illustrates the union-type composition of older adults in 2019.
- In 2019 the share of single (50%) was larger than the share married (47%) or cohabiting (3%).
Figure 1. Union-type Composition of Older Adults, 2019
Marital History of Older Adult Couples
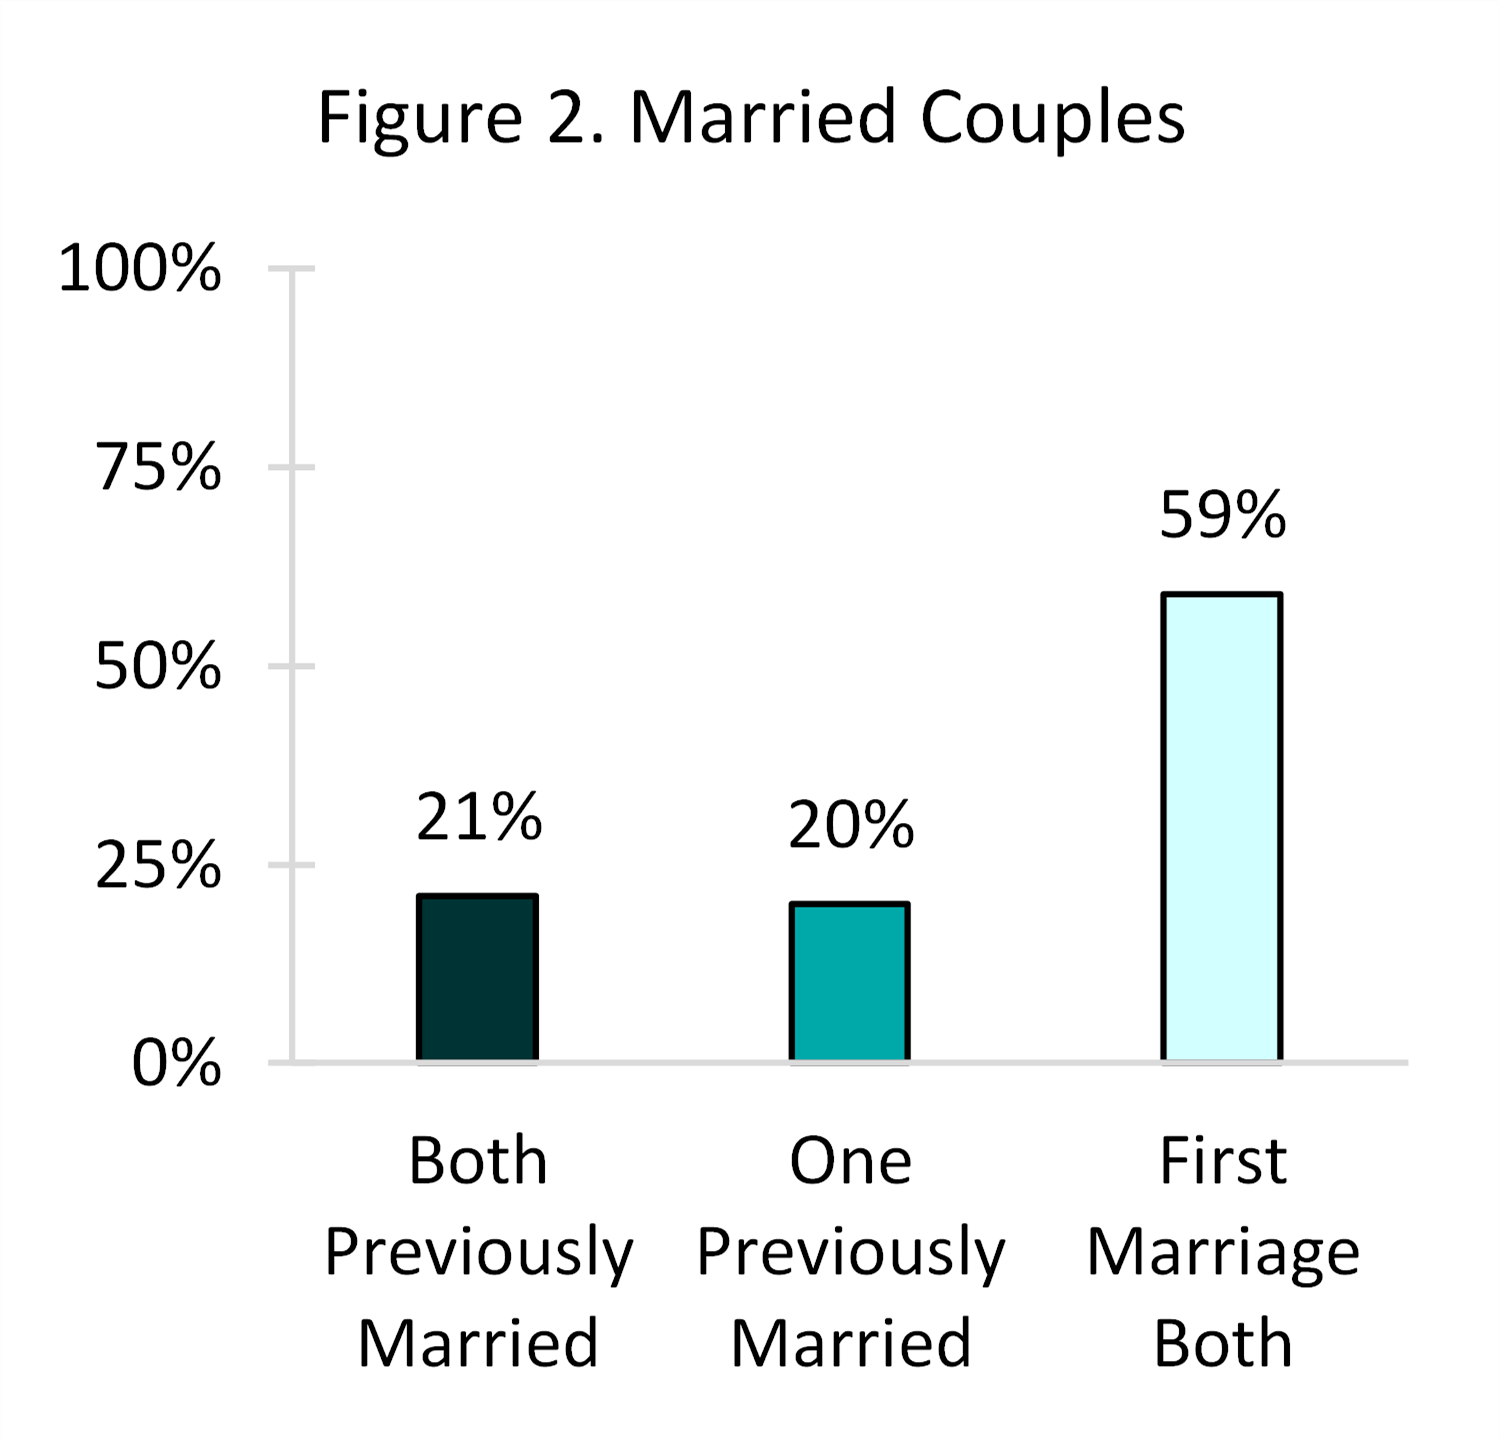
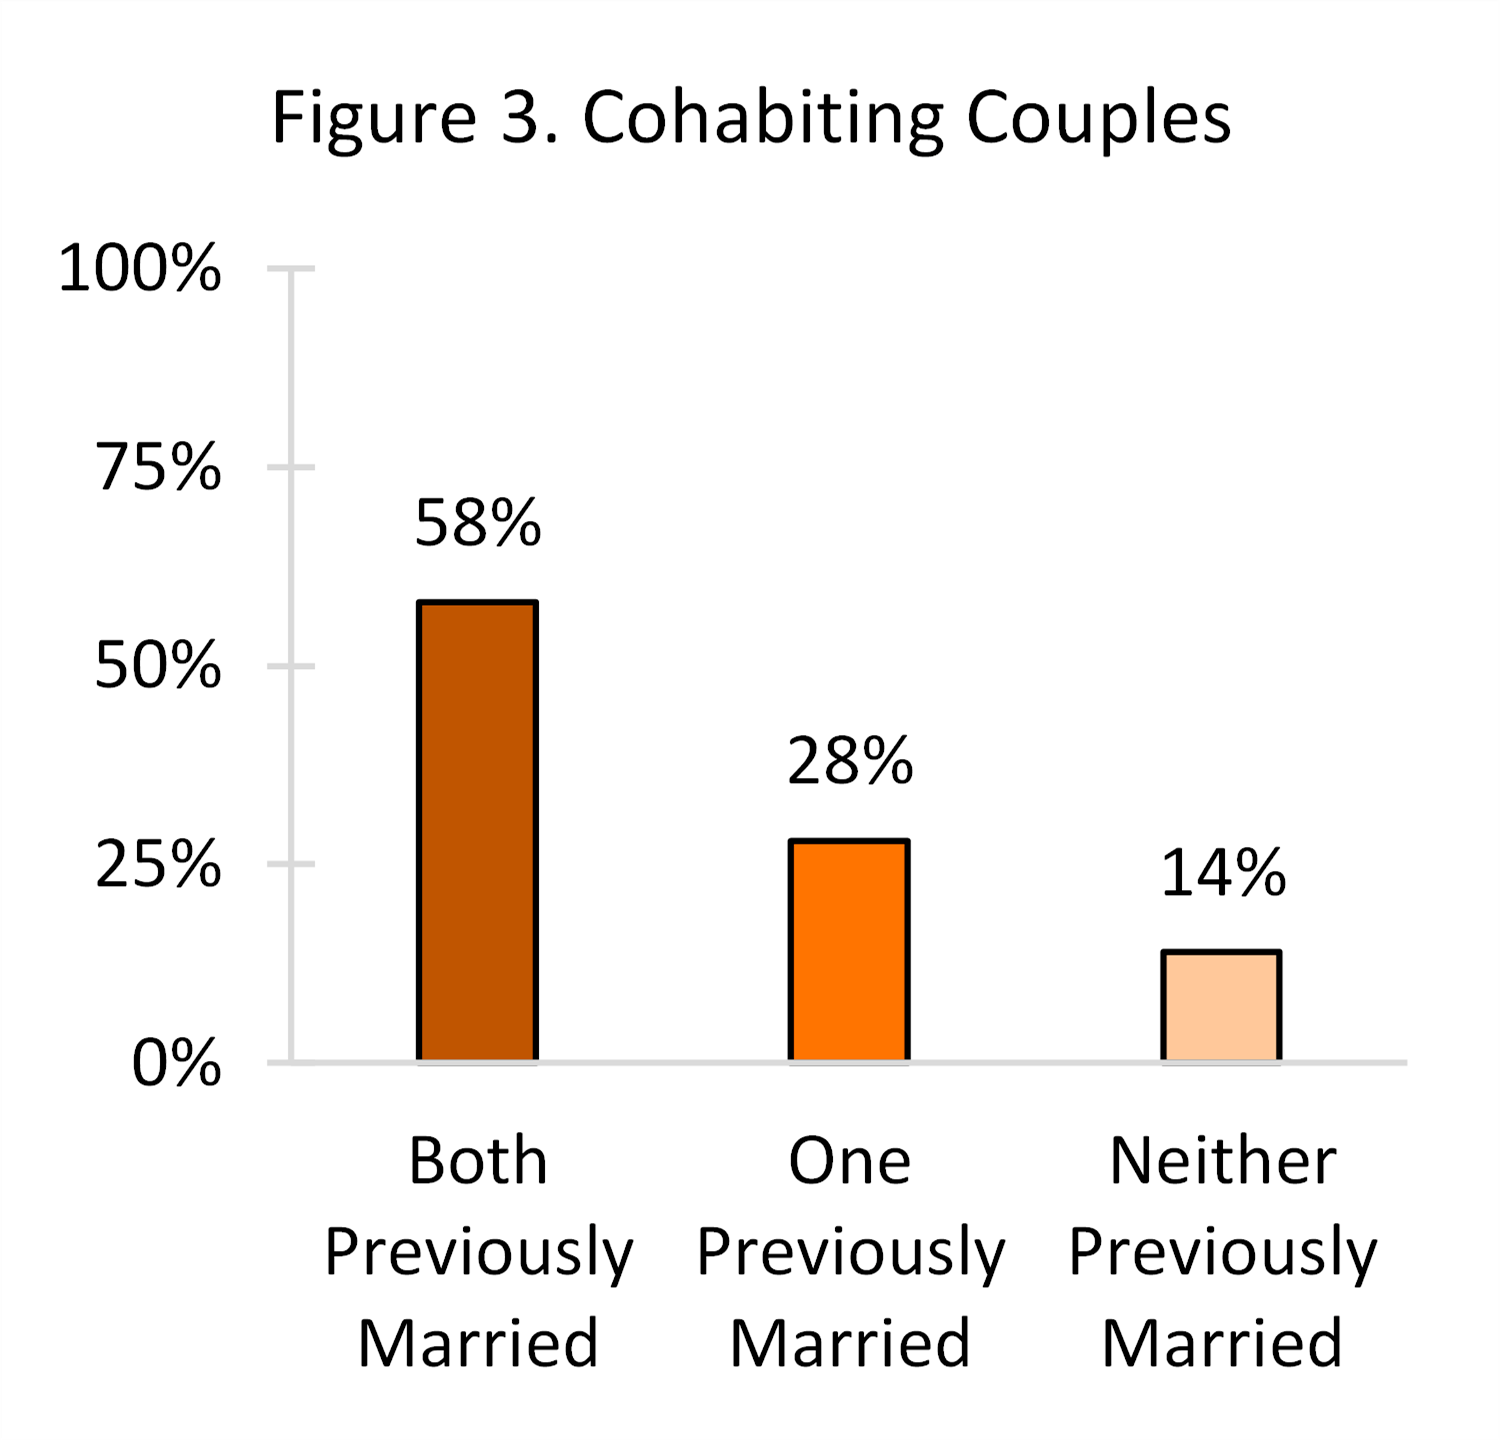
Figures 2 and 3 display the marital histories of older adult couples in 2019.
- Among most married older adult couples, both partners were in their first marriage (59%). The rest of married couples were nearly split between one partner being previously married (20%) and both partners being previously married (21%).
- The marital history distribution of cohabiting older adult couples is opposite of married couples. Among most cohabiting couples, both partners were previously married (58%). In 28% of cohabiting couples only one partner was previously married. Lastly, only in 14% of cohabiting older adult couples had both partners not been previously married.
Figures 2 and 3. Marital History of Older Adult Couples, 2019
Source: NCFMR Analyses of U.S Census Bureau American Community Survey, 1-year estimates, 201
Educational Homogamy of Older Adult Couples
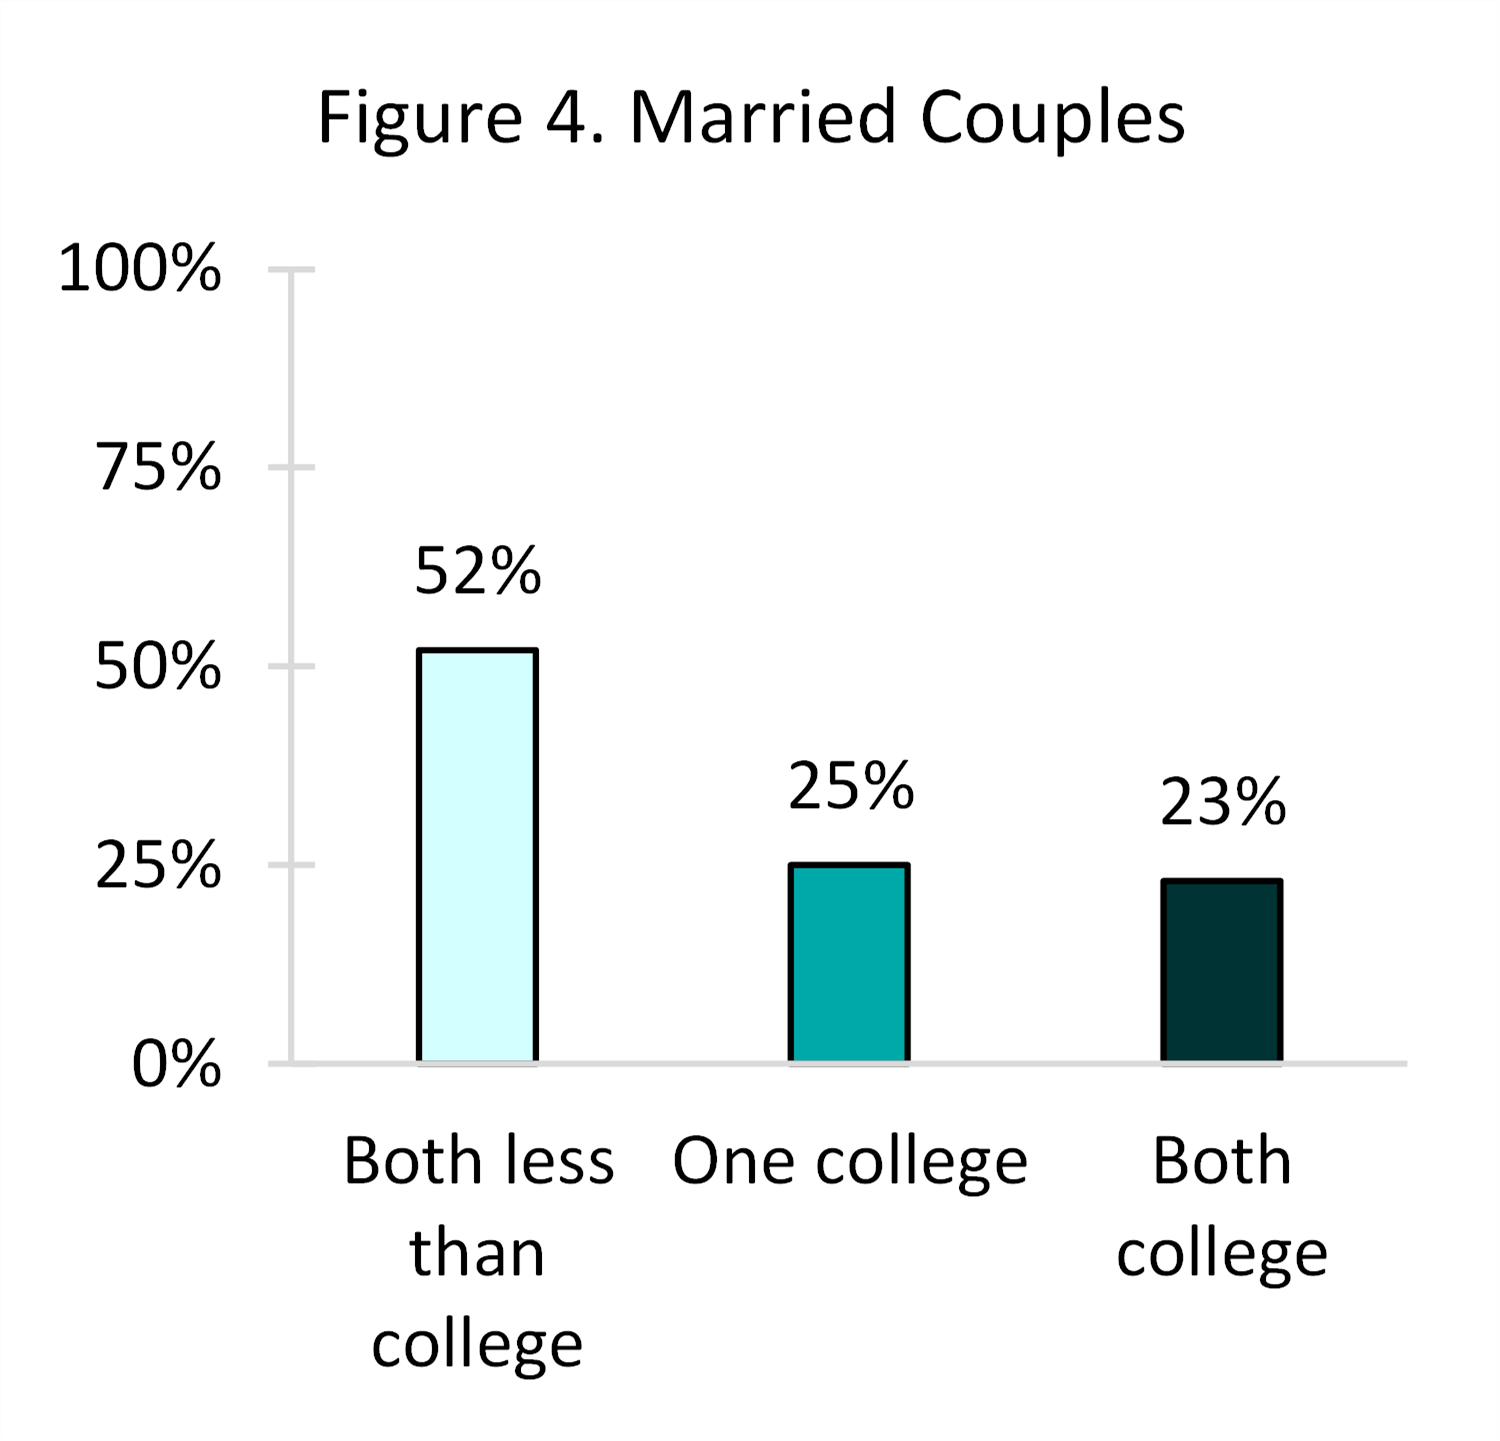
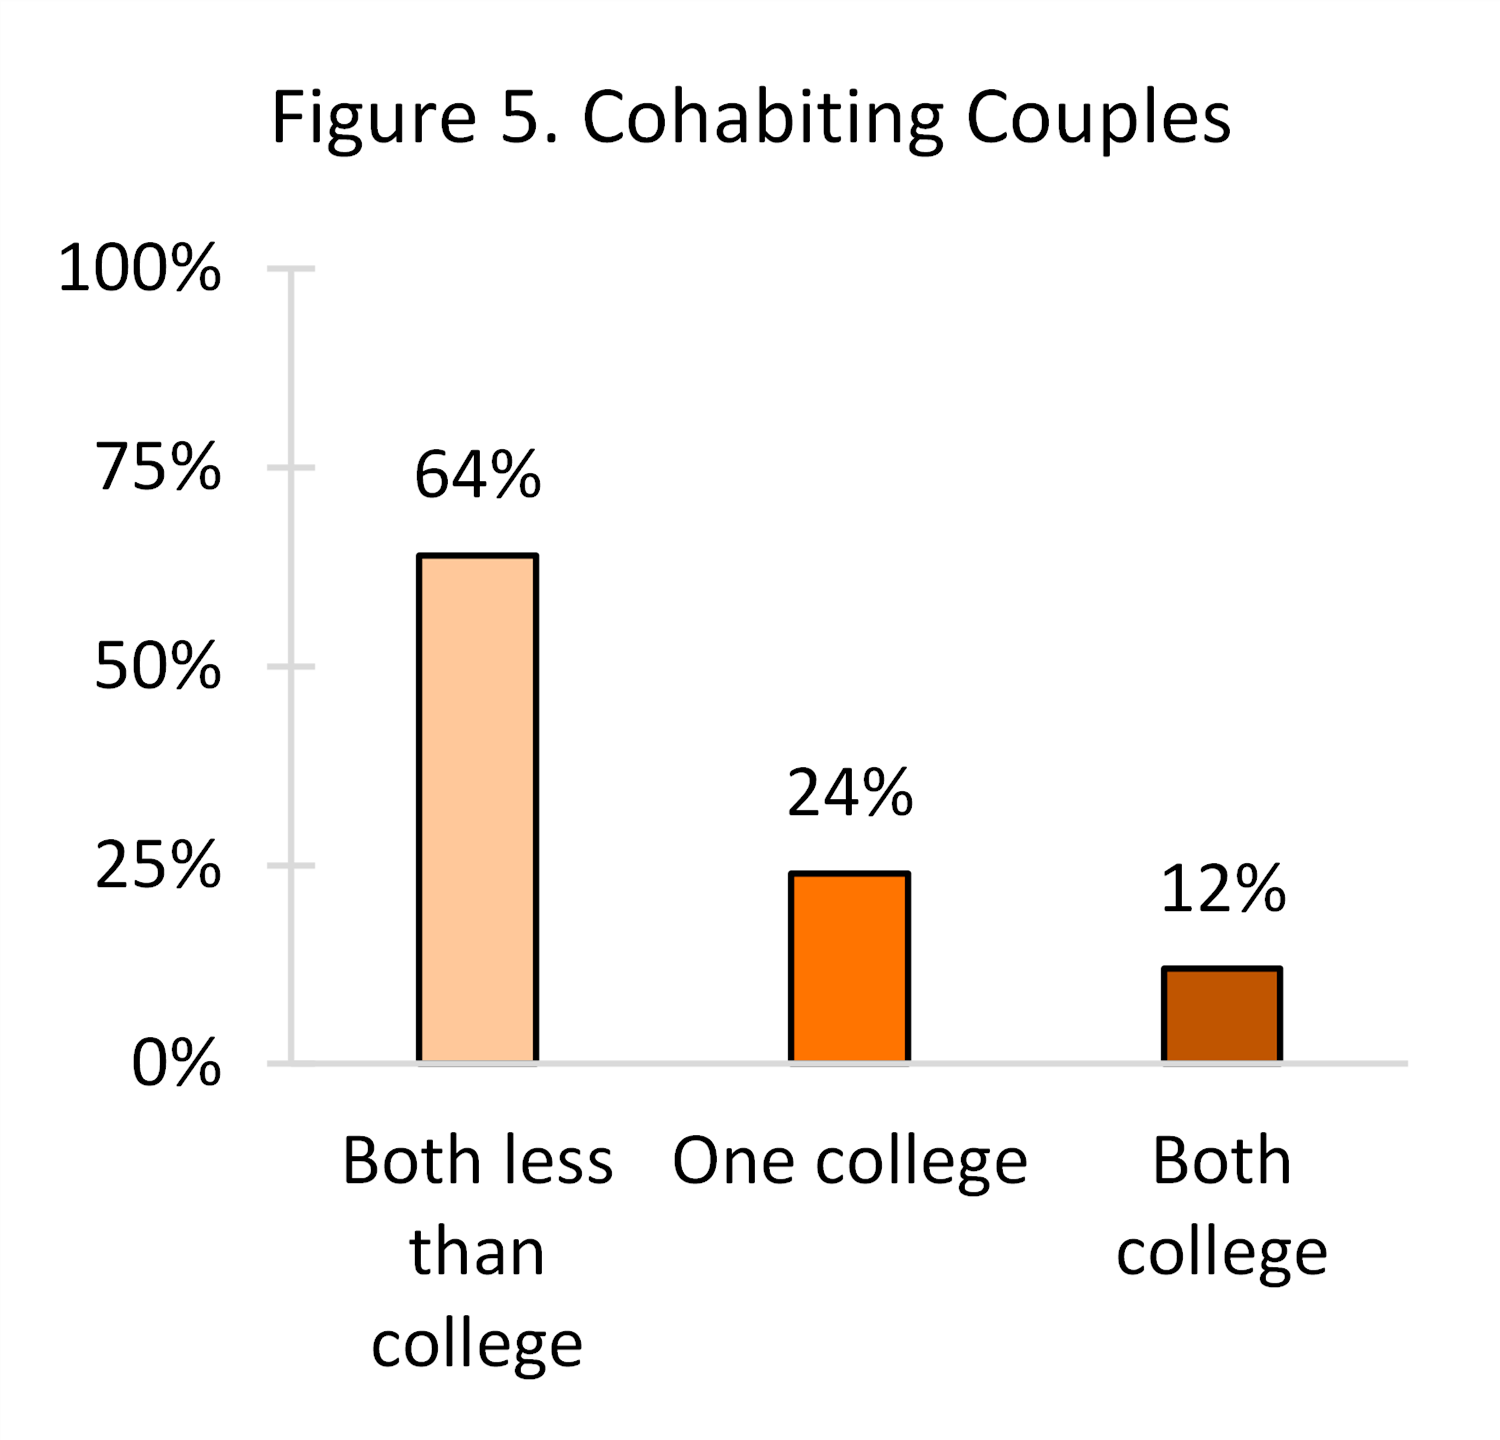
Figures 4 and 5 exhibit the educational homogamy of older adult couples in 2019.
- In about half (52%) of married couples both members did not have a college degree, and this is true in a higher share of cohabiting couples (64%).
- The share of couples in which one spouse/ partner had a college degree was nearly identical for married and cohabiting couples.
- The share of married couples where both spouses/ partners had college degrees was two-times larger (25%) compared to their cohabiting counterparts (12%).
Figures 4 and 5. Educational Homogamy of Older Adult Couples, 2019
Source: NCFMR Analyses of U.S Census Bureau American Community Survey, 1-year estimates, 2019
Mean Age Gap of Cohabiting and Married Couples
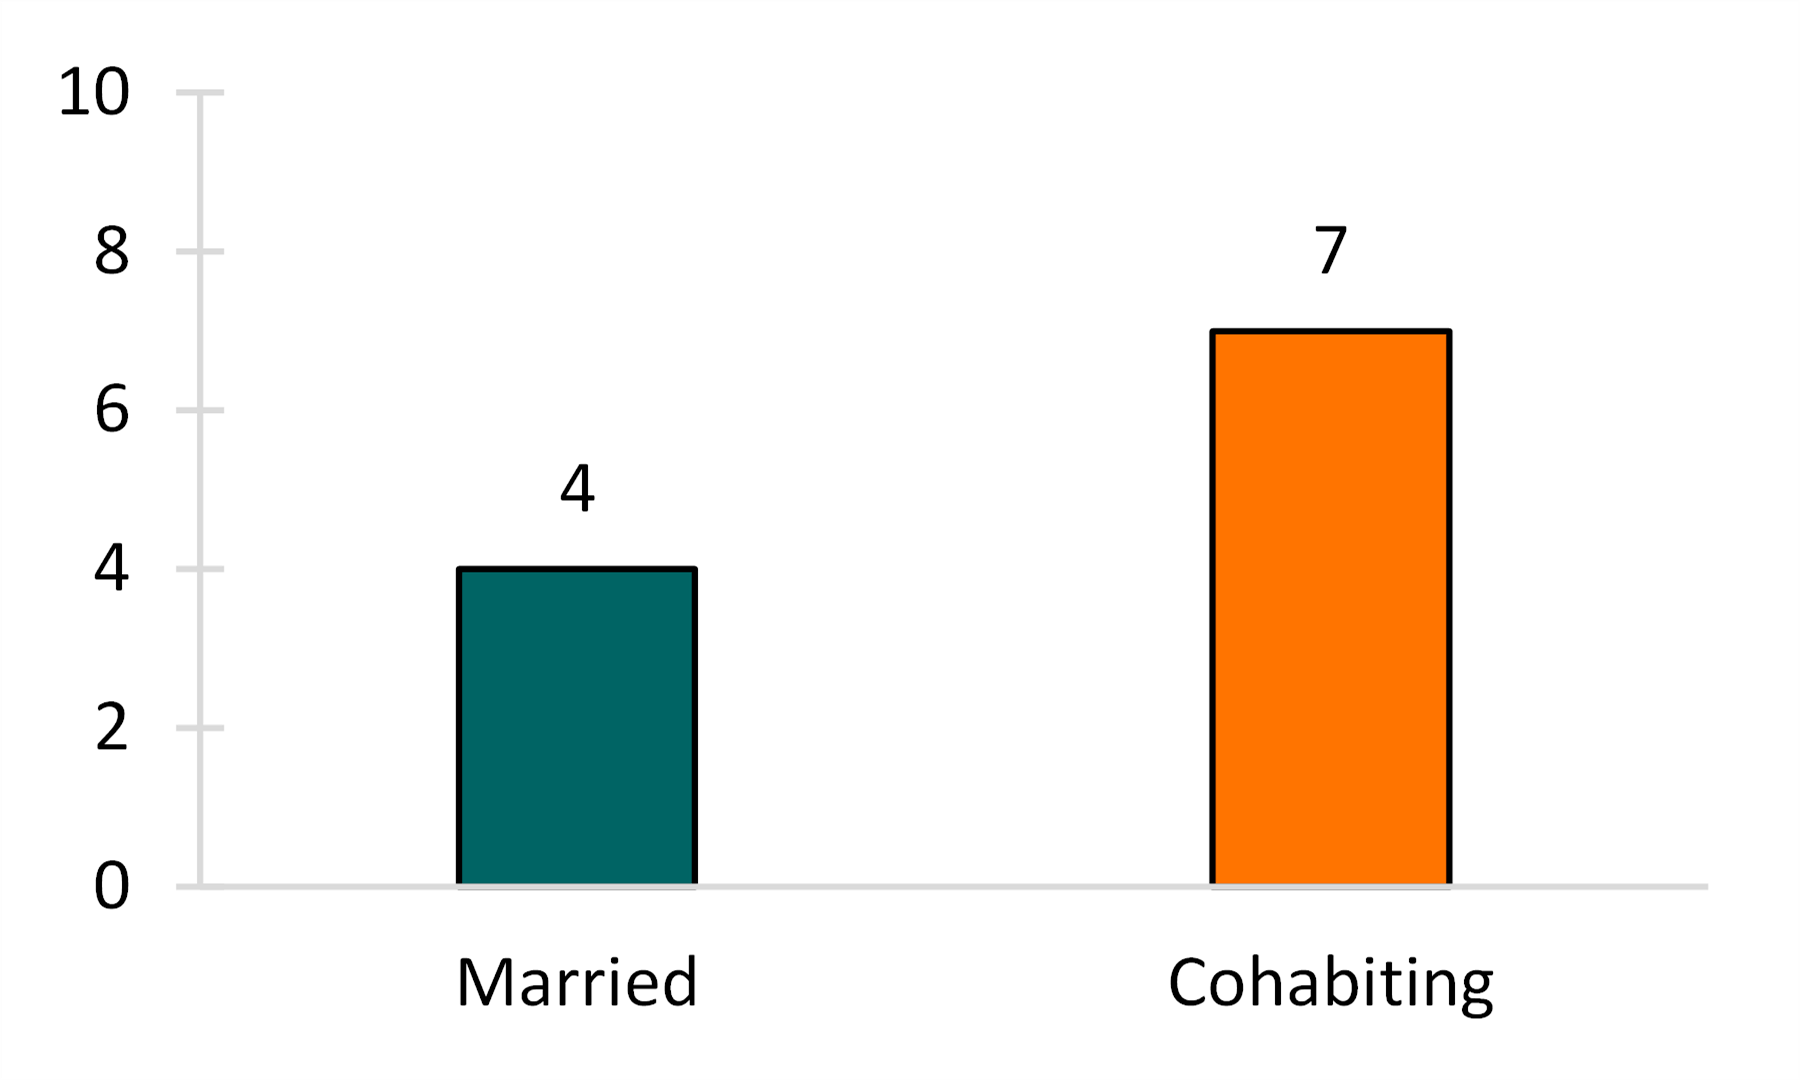
Figure 6 displays the mean age differences among older married and cohabiting couples in 2019.
- The average age gap was lower among married couples (4 years) than among cohabiting couples (seven years). Meaning, that on average, married spouses were closer in age than cohabiting partners.
Figure 6. Mean Age Difference for Married and Cohabiting Couples, 2019
Data Source:
U.S. Census Bureau, American Community Survey, 1-year estimates, 2019.
References:
Brown, S. L., Bulanda, J. R., & Lee, G. R. (2005). The significance of nonmarital cohabitation: Marital status and mental health benefits among middle-aged and older adults. Journals of Gerontology Series B: Psychological Sciences & Social Sciences, 60(1), S21–S29. https://doi-org.ezproxy.bgsu.edu/10.1093/geronb/60.1.S21
Brown, S.L., Wright, M.R. (2017), Marriage, cohabitation, and divorce in later life. Innovation in Aging, 1(2), September 2017, igx015, https://doi.org/10.1093/geroni/igx015
King, V., & Scott, M. E. (2005). A comparison of cohabiting relationships among older and younger adults. Journal of Marriage and Family, 67(2), 271–285. http://www.jstor.org/stable/3600268
Stepler, R. (2017). Number of U.S. adults cohabiting with a partner continues to rise, especially among those 50 and older. Fact Tank: Pew Research Center. Retrieved from http://www.pewresearch.org/fact-tank/2017/04/06/number-of-u-s-adults-cohabiting-with-a-partner-continues-to-rise-especially-among-those-50-and-old
Wright, M. R. (2020). Relationship quality among older cohabitors: A comparison to remarrieds. Journals of Gerontology Series B: Psychological Sciences & Social Sciences, 75(8), 1808–1817. https://doi-org.ezproxy.bgsu.edu/10.1093/geronb/gbz069
Suggested Citation:
Julian, C. A. (2022). Older adult cohabiting and married couples. Family Profiles, FP-22-16. Bowling Green, OH: National Center for Family & Marriage Research. https://doi.org/10.25035/ncfmr/fp-22-16
Updated: 11/07/2025 04:27PM

